Copyright
©The Author(s) 2023.
World J Gastrointest Oncol. Nov 15, 2023; 15(11): 2017-2032
Published online Nov 15, 2023. doi: 10.4251/wjgo.v15.i11.2017
Published online Nov 15, 2023. doi: 10.4251/wjgo.v15.i11.2017
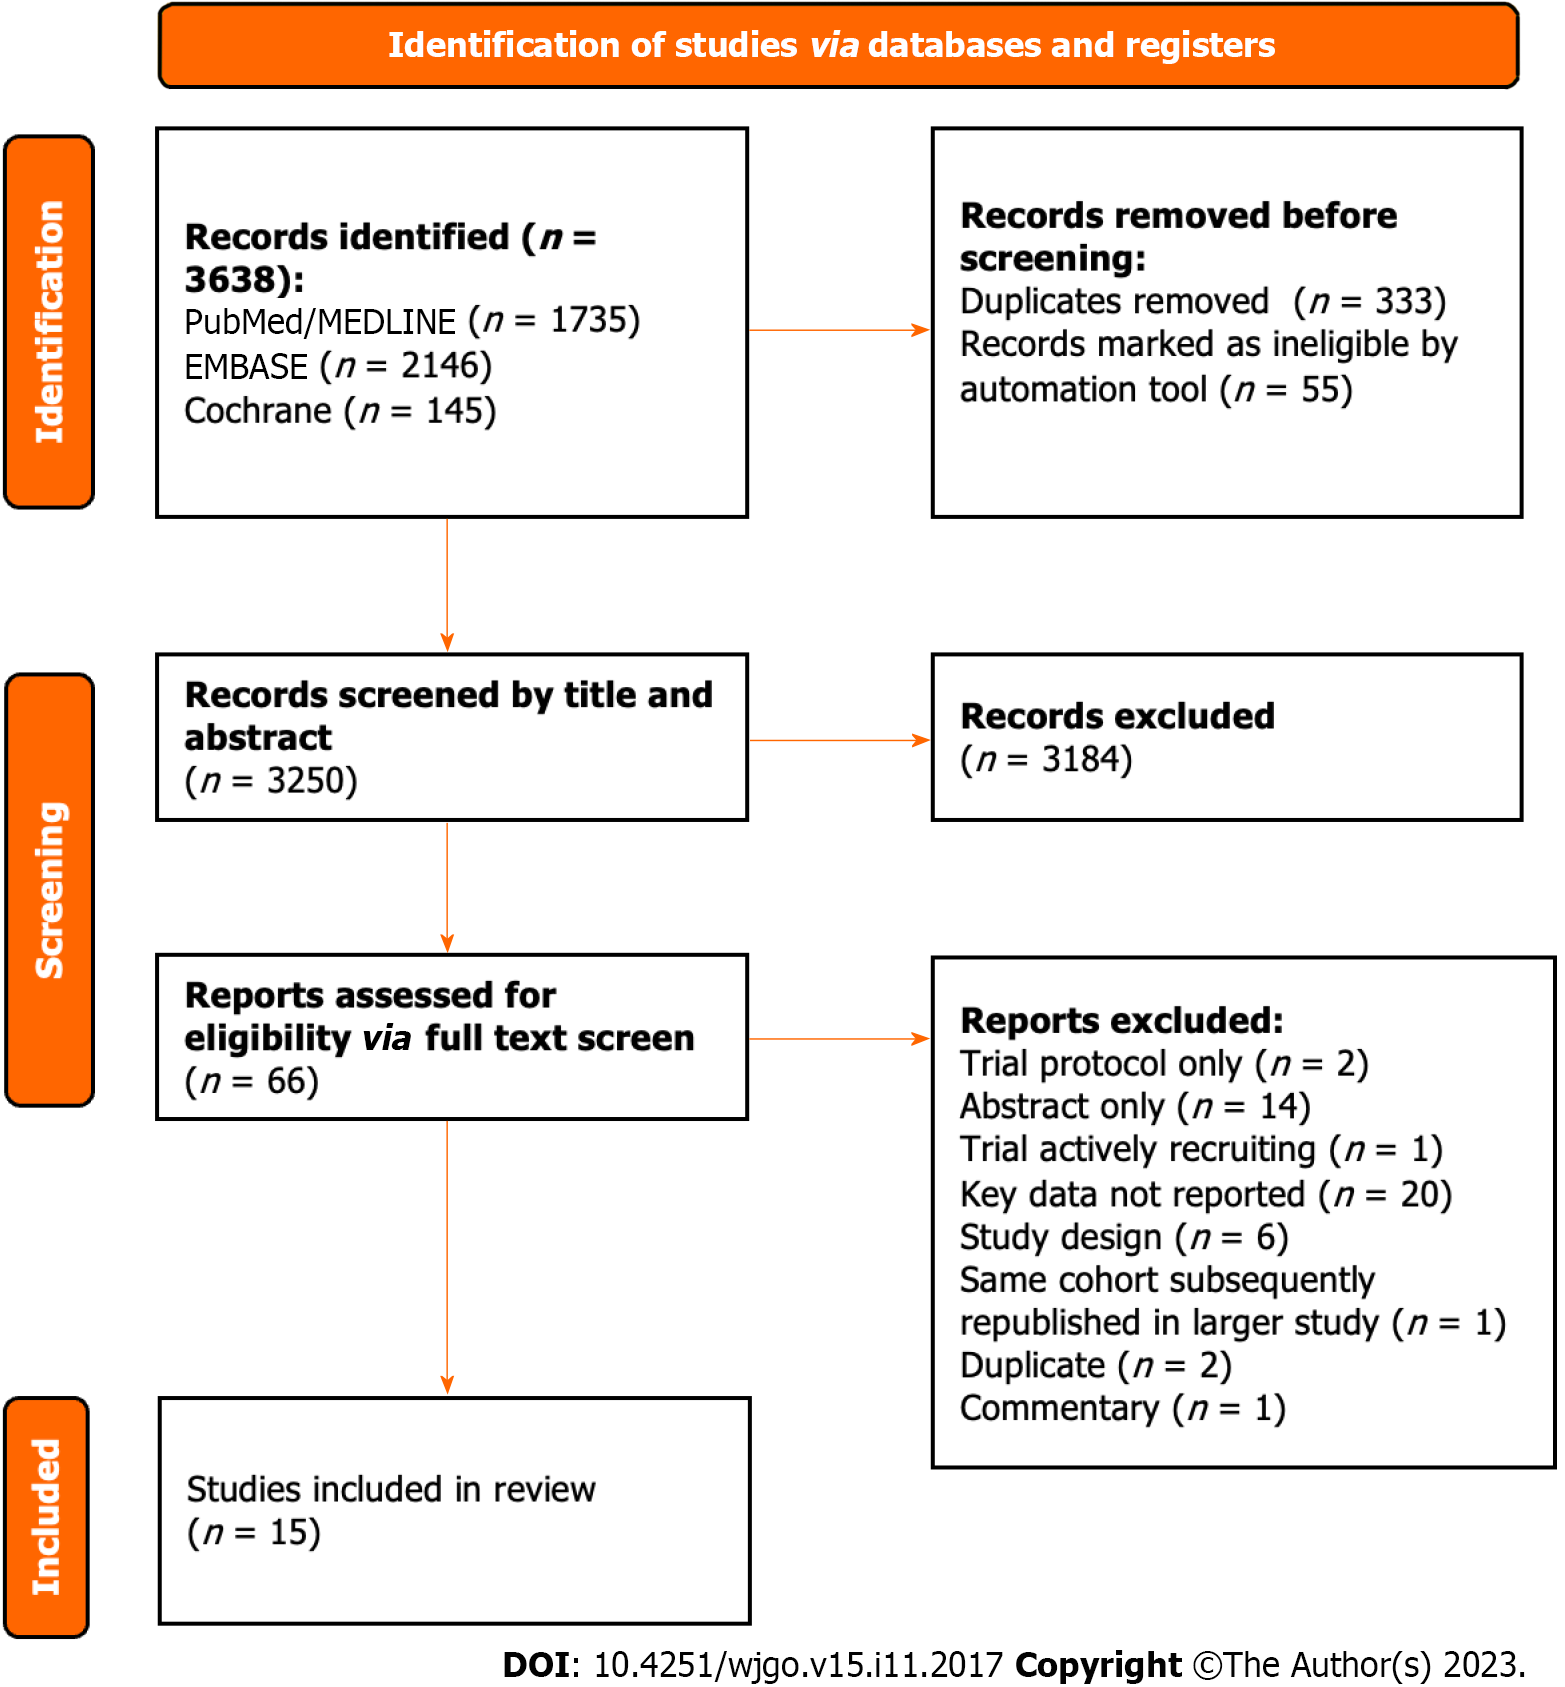
Figure 1 PRISMA flow chart demonstrating study selection commencing from all studies identified during initial search.
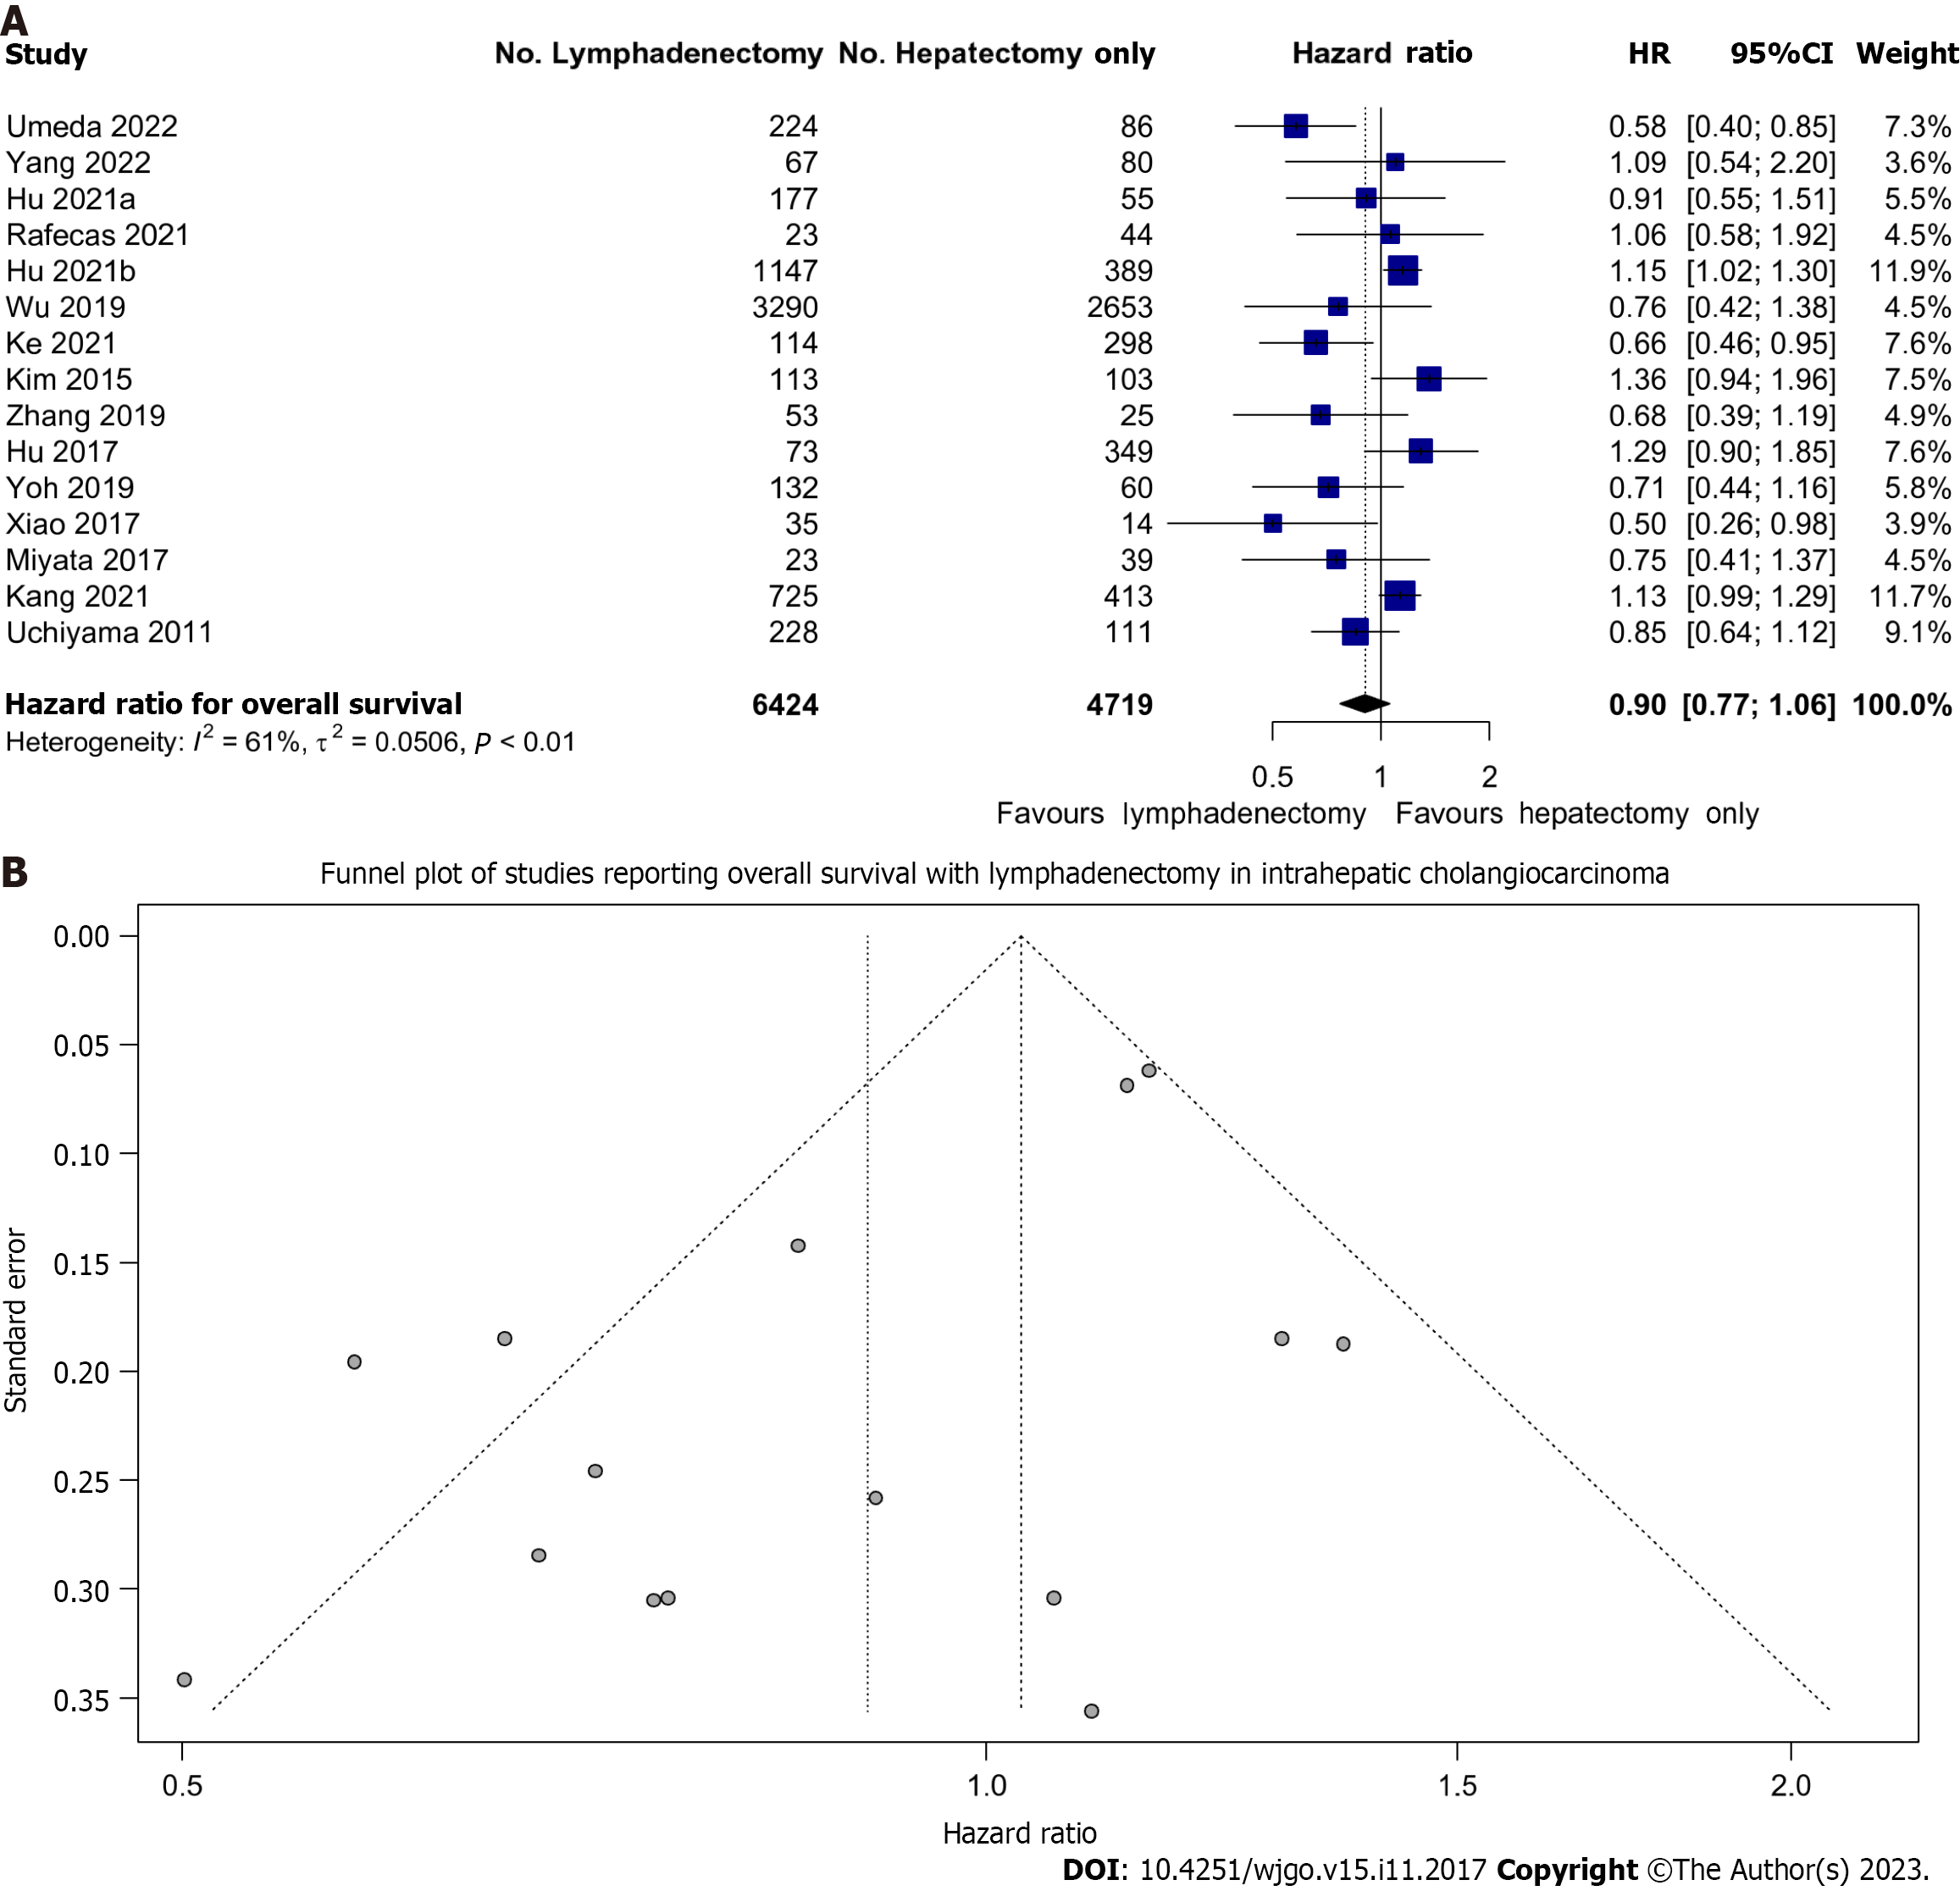
Figure 2 Lymph node dissection and overall survival.
A: Forest plot demonstrating the effect of lymph node dissection (LND) on overall survival (OS); B: Funnel plot of all included studies reporting OS in patients undergoing LND. 95%CI: 95% confidence intervals; HR: Hazard ratios.
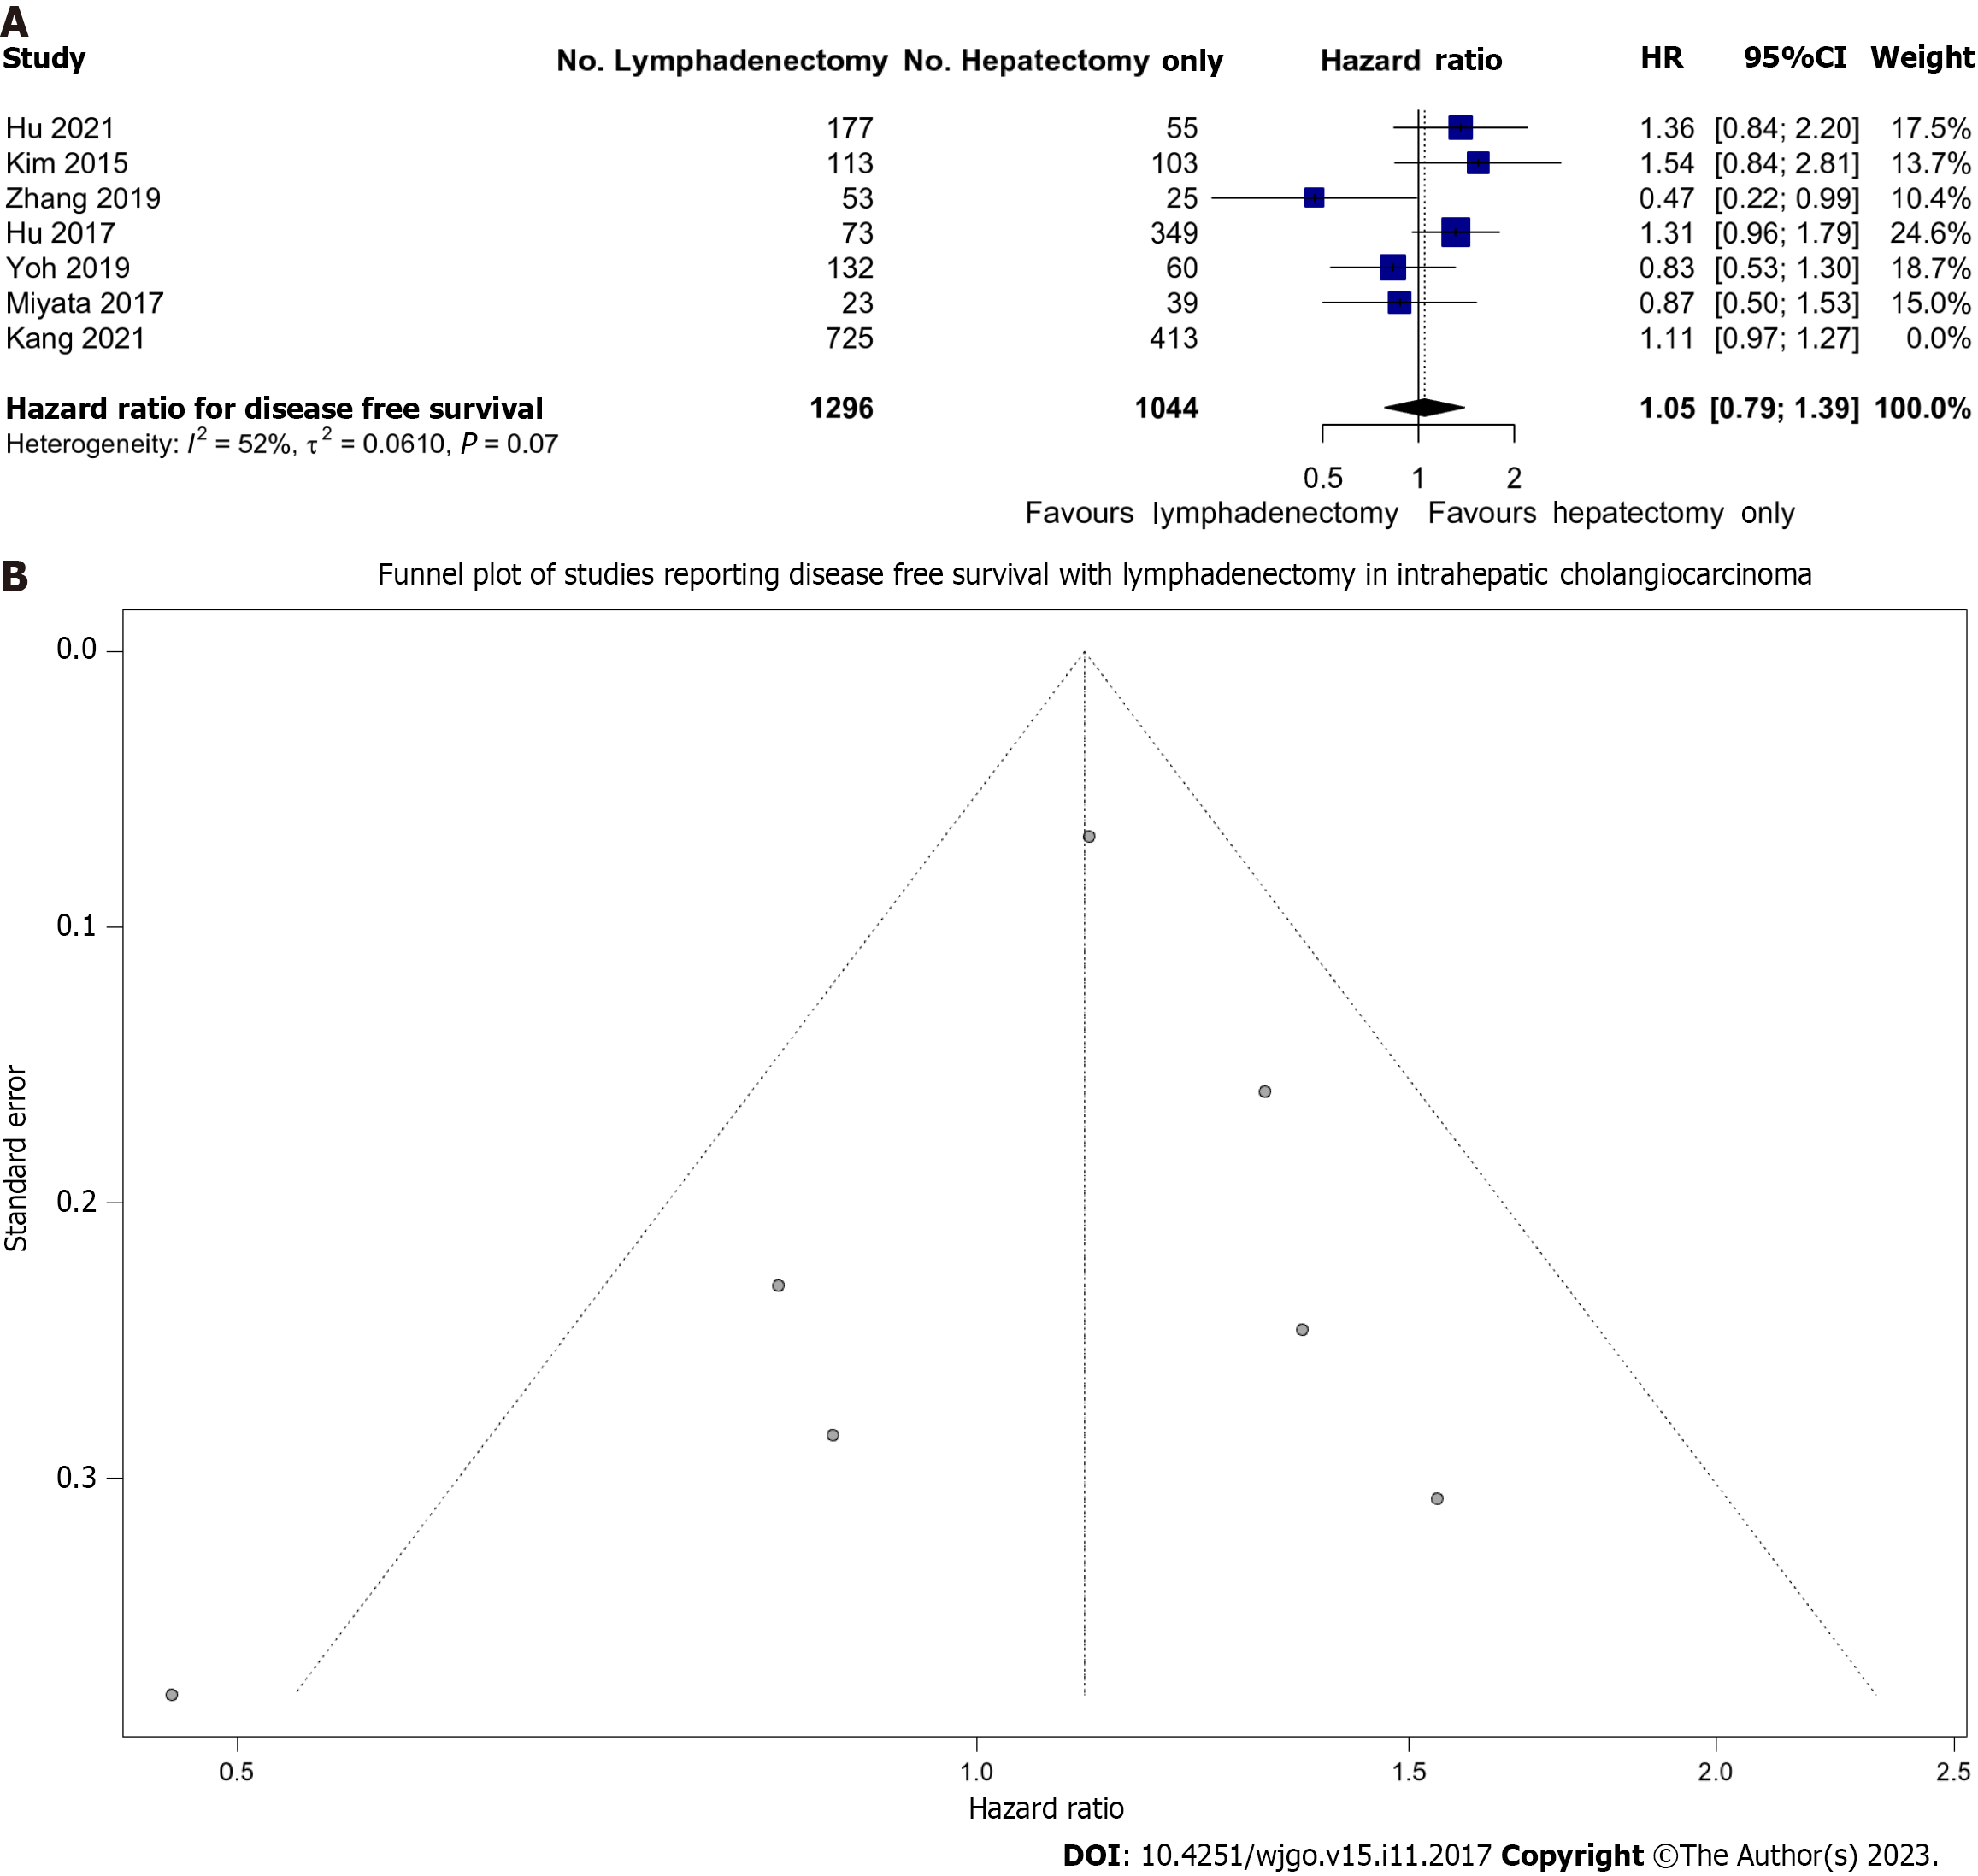
Figure 3 Lymph node dissection and disease-free survival.
A: Forest plot demonstrating the effect of lymph node dissection (LND) on disease-free survival (DFS); B: Funnel plot of all included studies reporting DFS in patients undergoing LND.
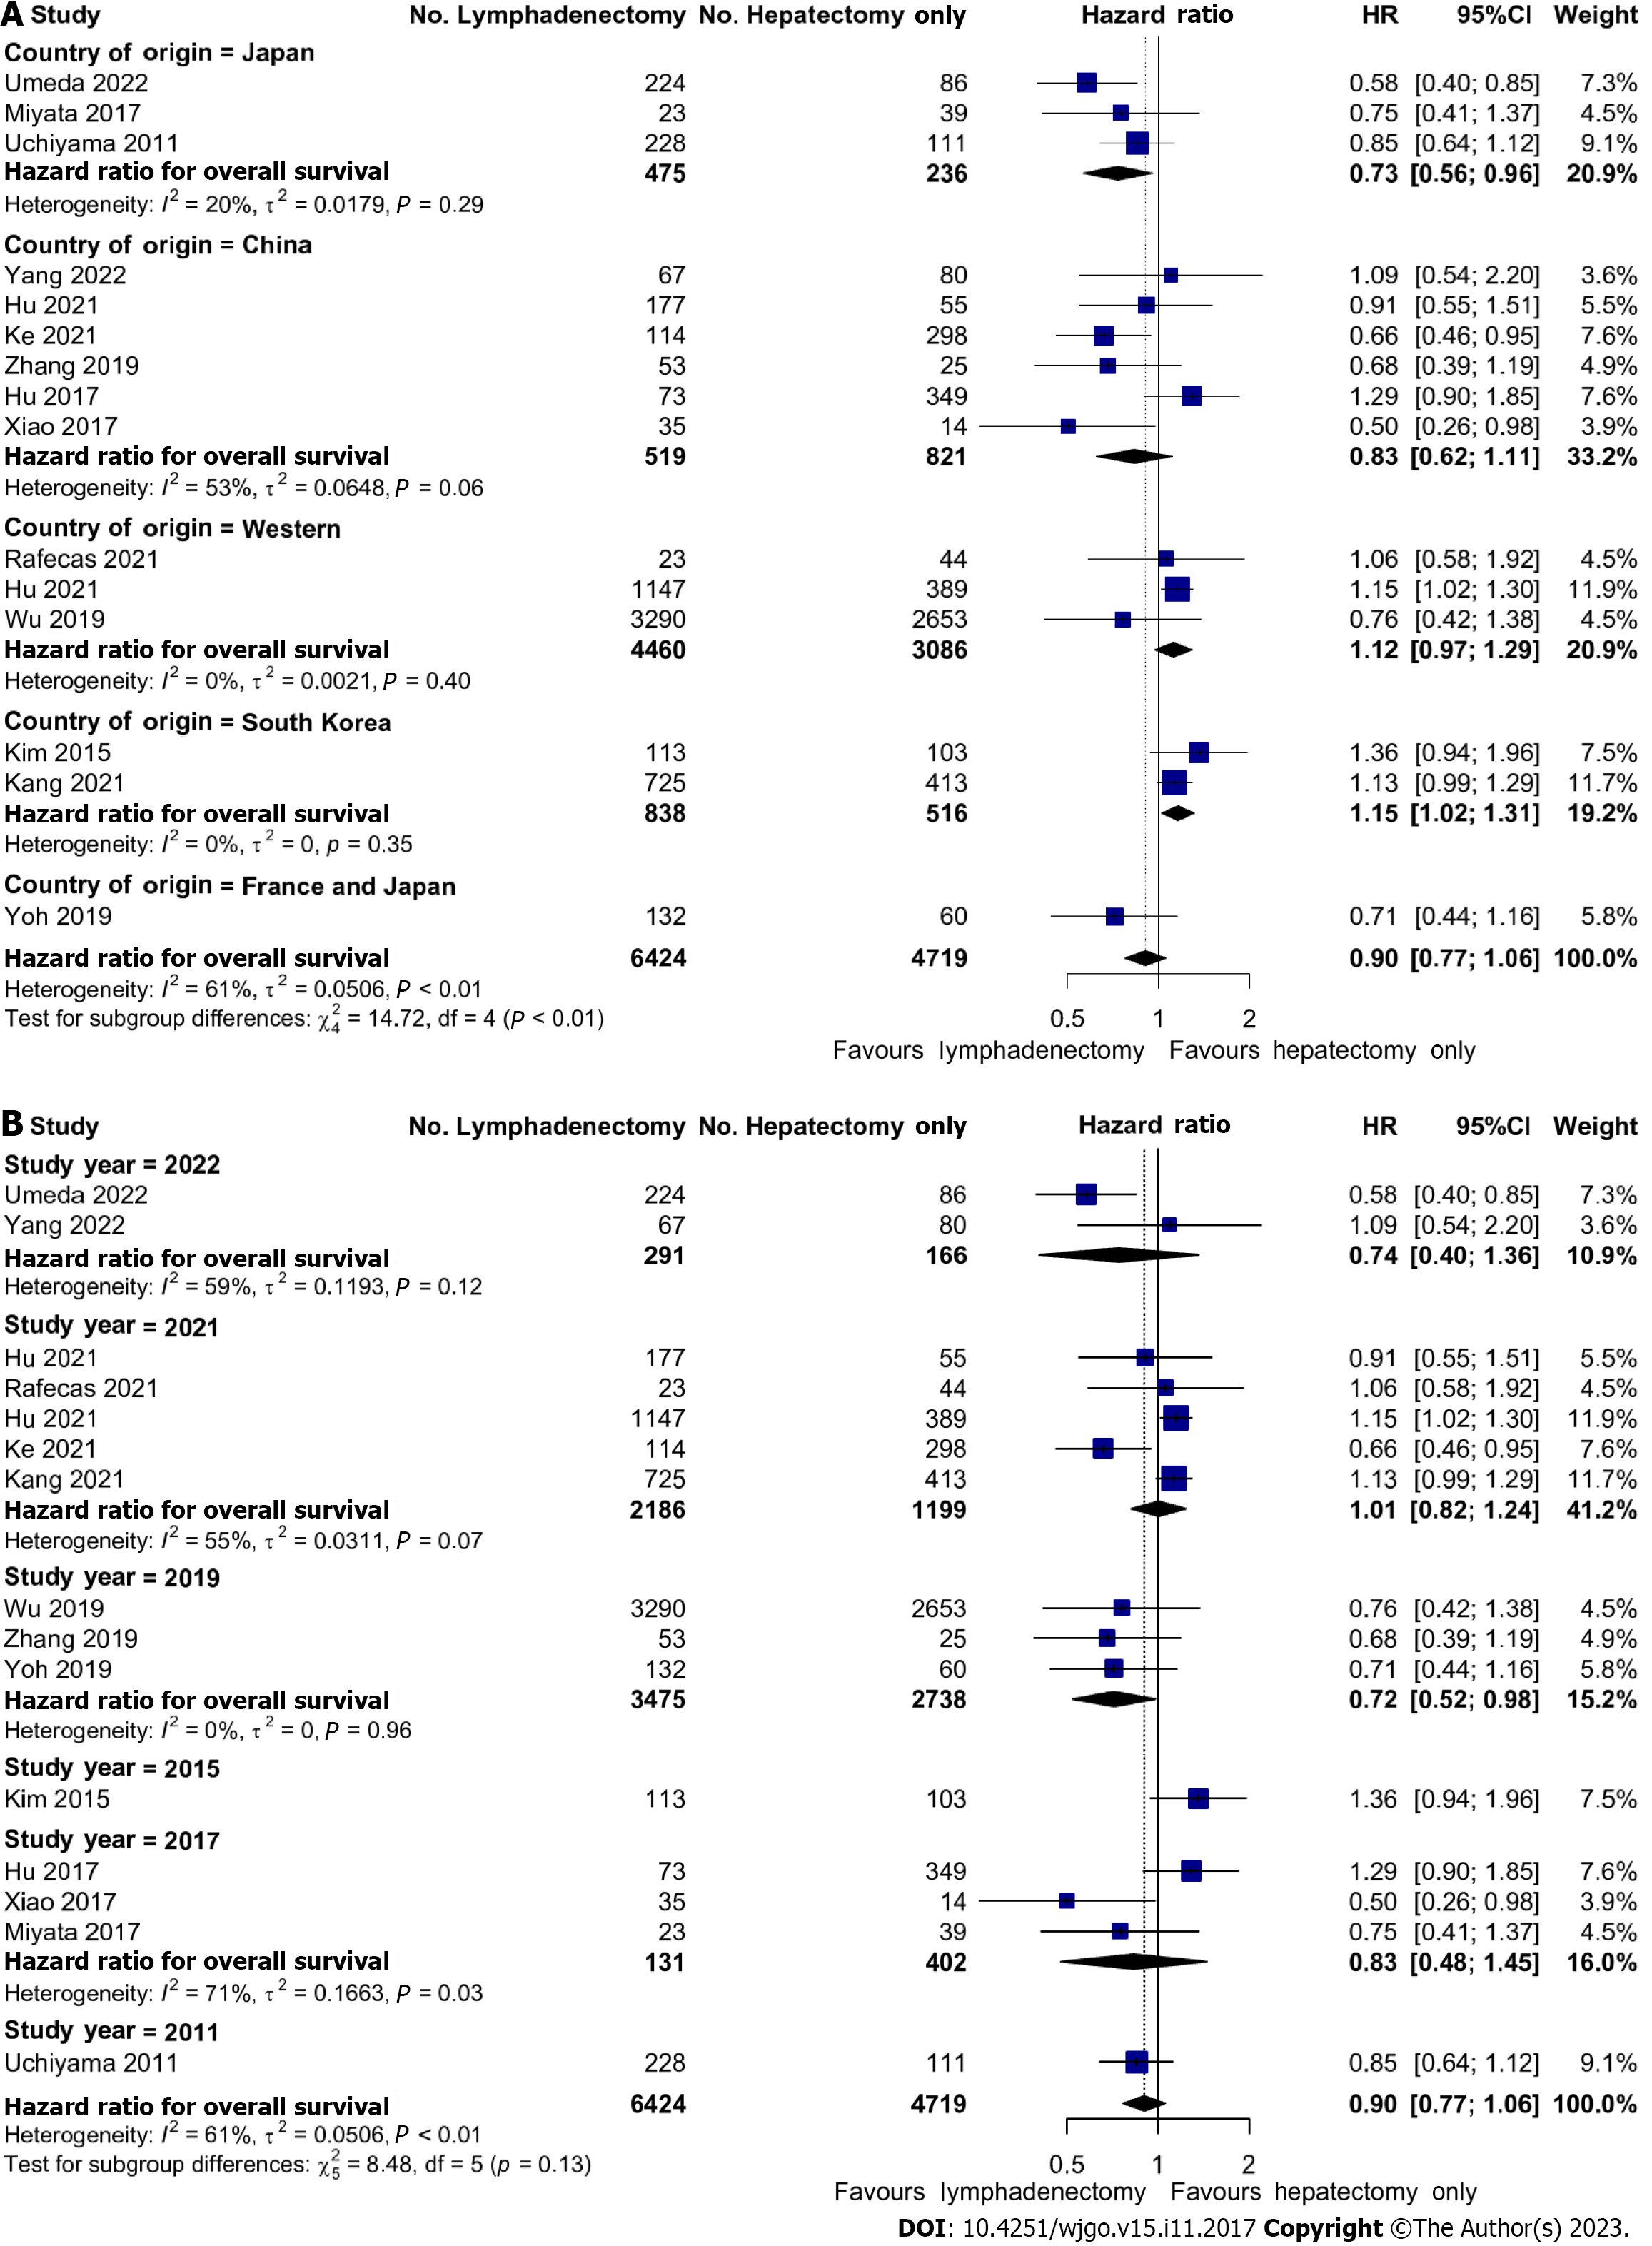
Figure 4 Geographical and Time-Based effects of lymph node dissection on overall survival.
A: Forest plot demonstrating regional differences (Eastern vs Western) between the effect of lymph node dissection (LND) on overall survival (OS); B: Forest plot demonstrating time-dependent differences of the effect of LND on OS.
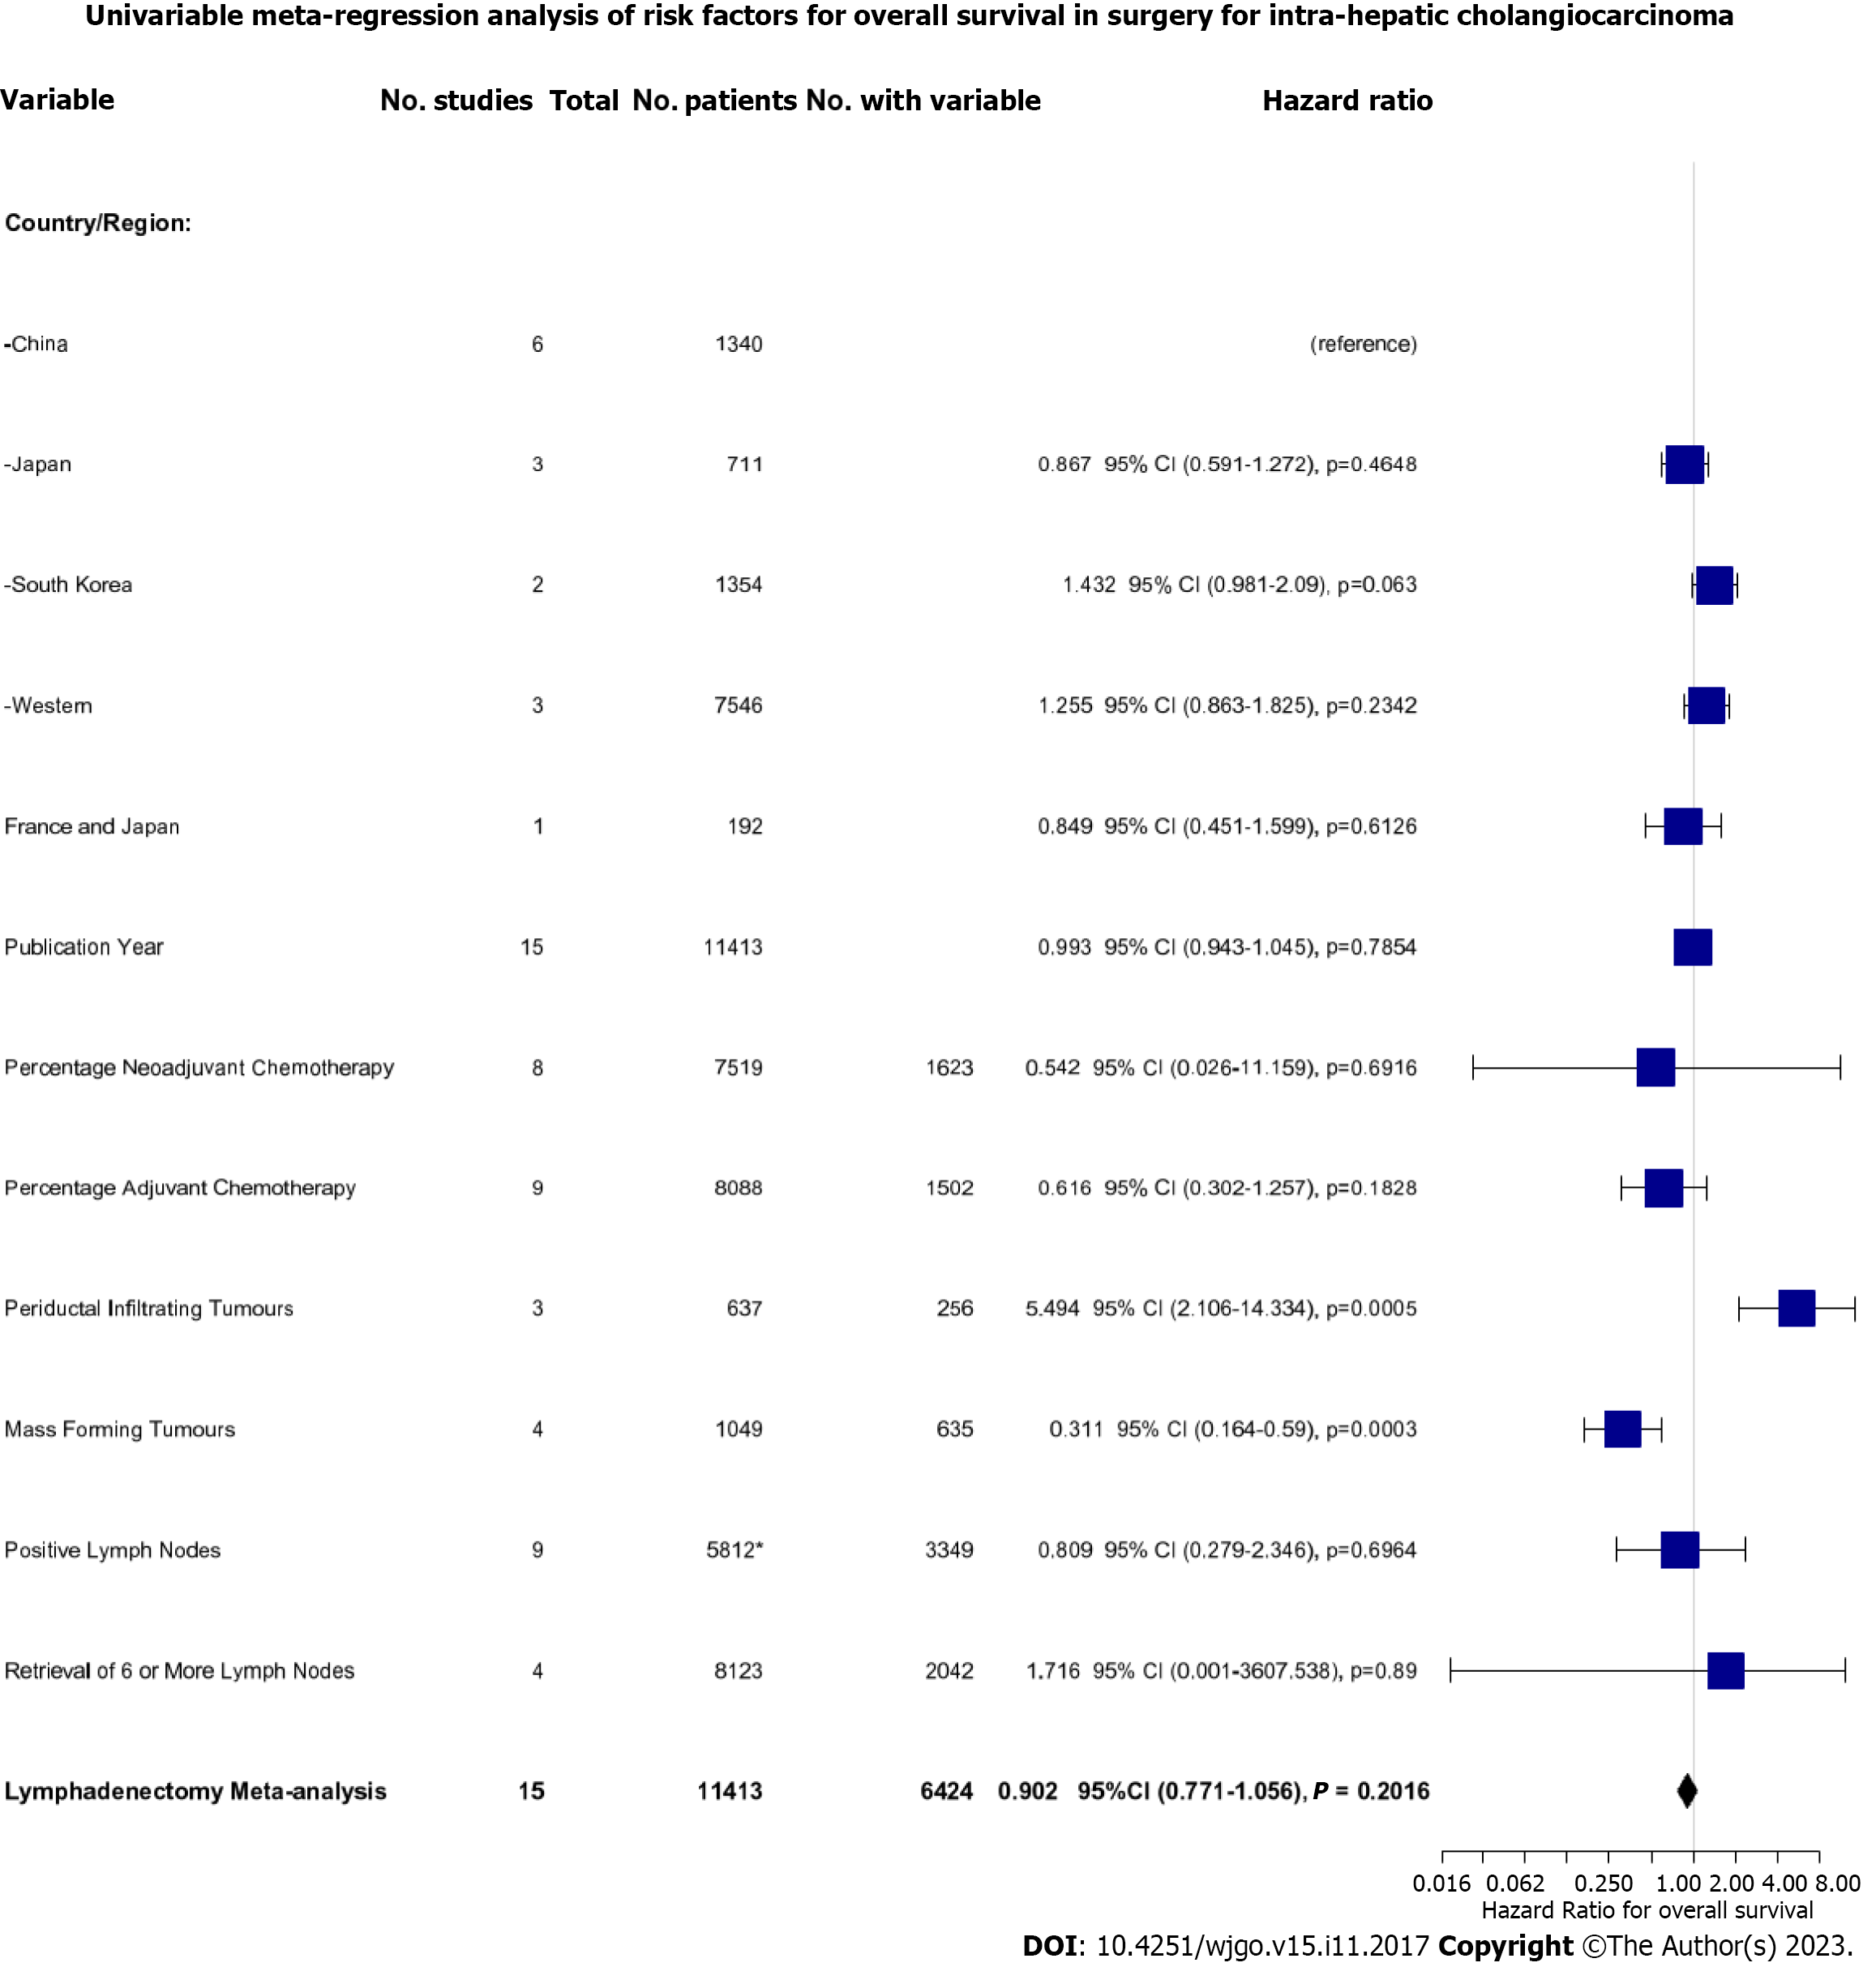
Figure 5 Univariate meta-regression analysis of the risk factors for overall survival in all patients undergoing resection.
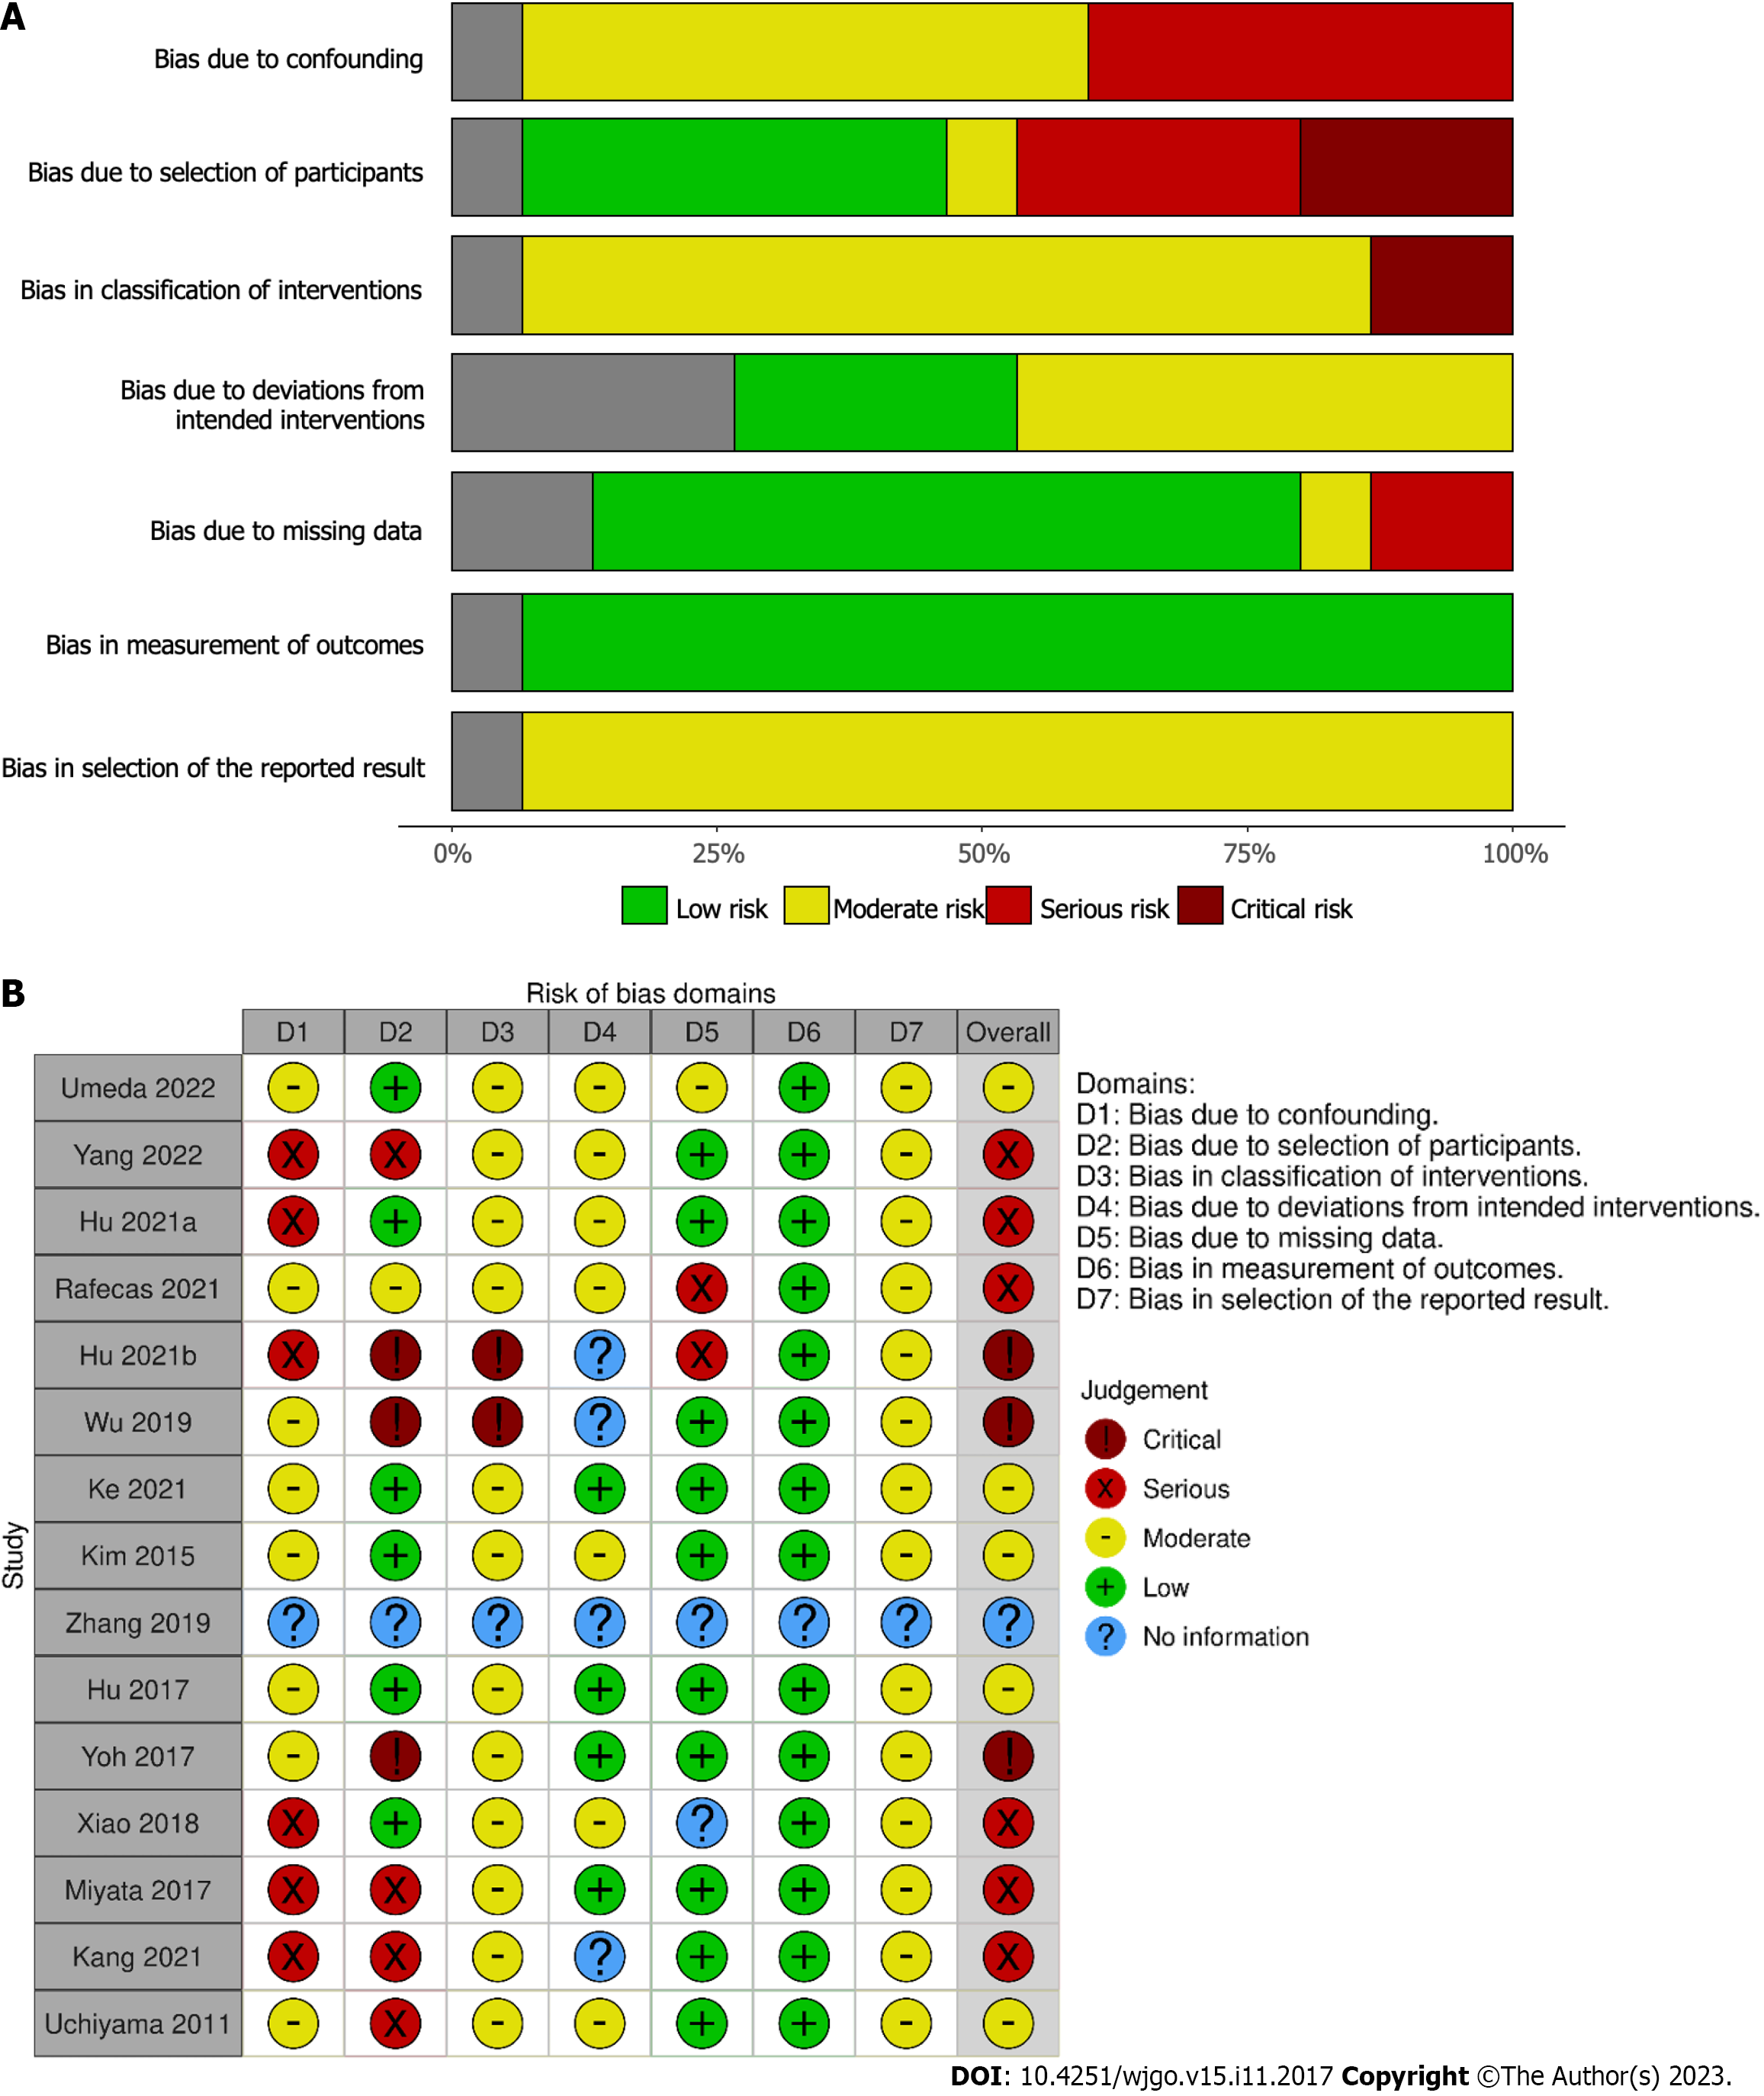
Figure 6 Risk of bias assessment of included studies.
A: Summary of risk of bias in each domain of ROBINS-I tool for included studies; B: Risk of bias using ROBINS-I tool for each included study.
- Citation: Atif M, Borakati A, Mavroeidis VK. Role of routine lymph node dissection alongside resection of intrahepatic cholangiocarcinoma: Systematic review and meta-analysis. World J Gastrointest Oncol 2023; 15(11): 2017-2032
- URL: https://www.wjgnet.com/1948-5204/full/v15/i11/2017.htm
- DOI: https://dx.doi.org/10.4251/wjgo.v15.i11.2017


