Copyright
©The Author(s) 2023.
World J Gastrointest Oncol. Nov 15, 2023; 15(11): 1974-1987
Published online Nov 15, 2023. doi: 10.4251/wjgo.v15.i11.1974
Published online Nov 15, 2023. doi: 10.4251/wjgo.v15.i11.1974
Figure 1 CDKN2B-AS1 expression pattern and prognostic value in hepatocellular carcinoma.
A: Box plot showing log2-transformed gene expression levels of CDKN2B-AS1 in 374 hepatocellular carcinoma (HCC) cancer patients (orange box) compared with that in 50 normal counterparts (purple box), provided by the StarBase database; B: The relative transcriptional expression level of CDKN2B-AS1 in HCC tumor tissue samples and in paired normal tissue samples detected by quantitative real-time polymerase chain reaction (n = 55 in both groups). Each dot represents one patient, and two samples connected by a line are considered a pair; C: Bar chart showing the relative transcriptional expression levels of CDKN2B-AS1 in HCC cell lines (Li-7, Huh-7, SK-HEP-1, SNU-182, SNU-387) compared to that in THLE-2 cells; D: Overall survival plot of HCC patients grouped by CDKN2B-AS1 expressions (high vs low). Red line represents the high expression group and blue line represents the low expression group. cP < 0.001. HR: hazards ratio.
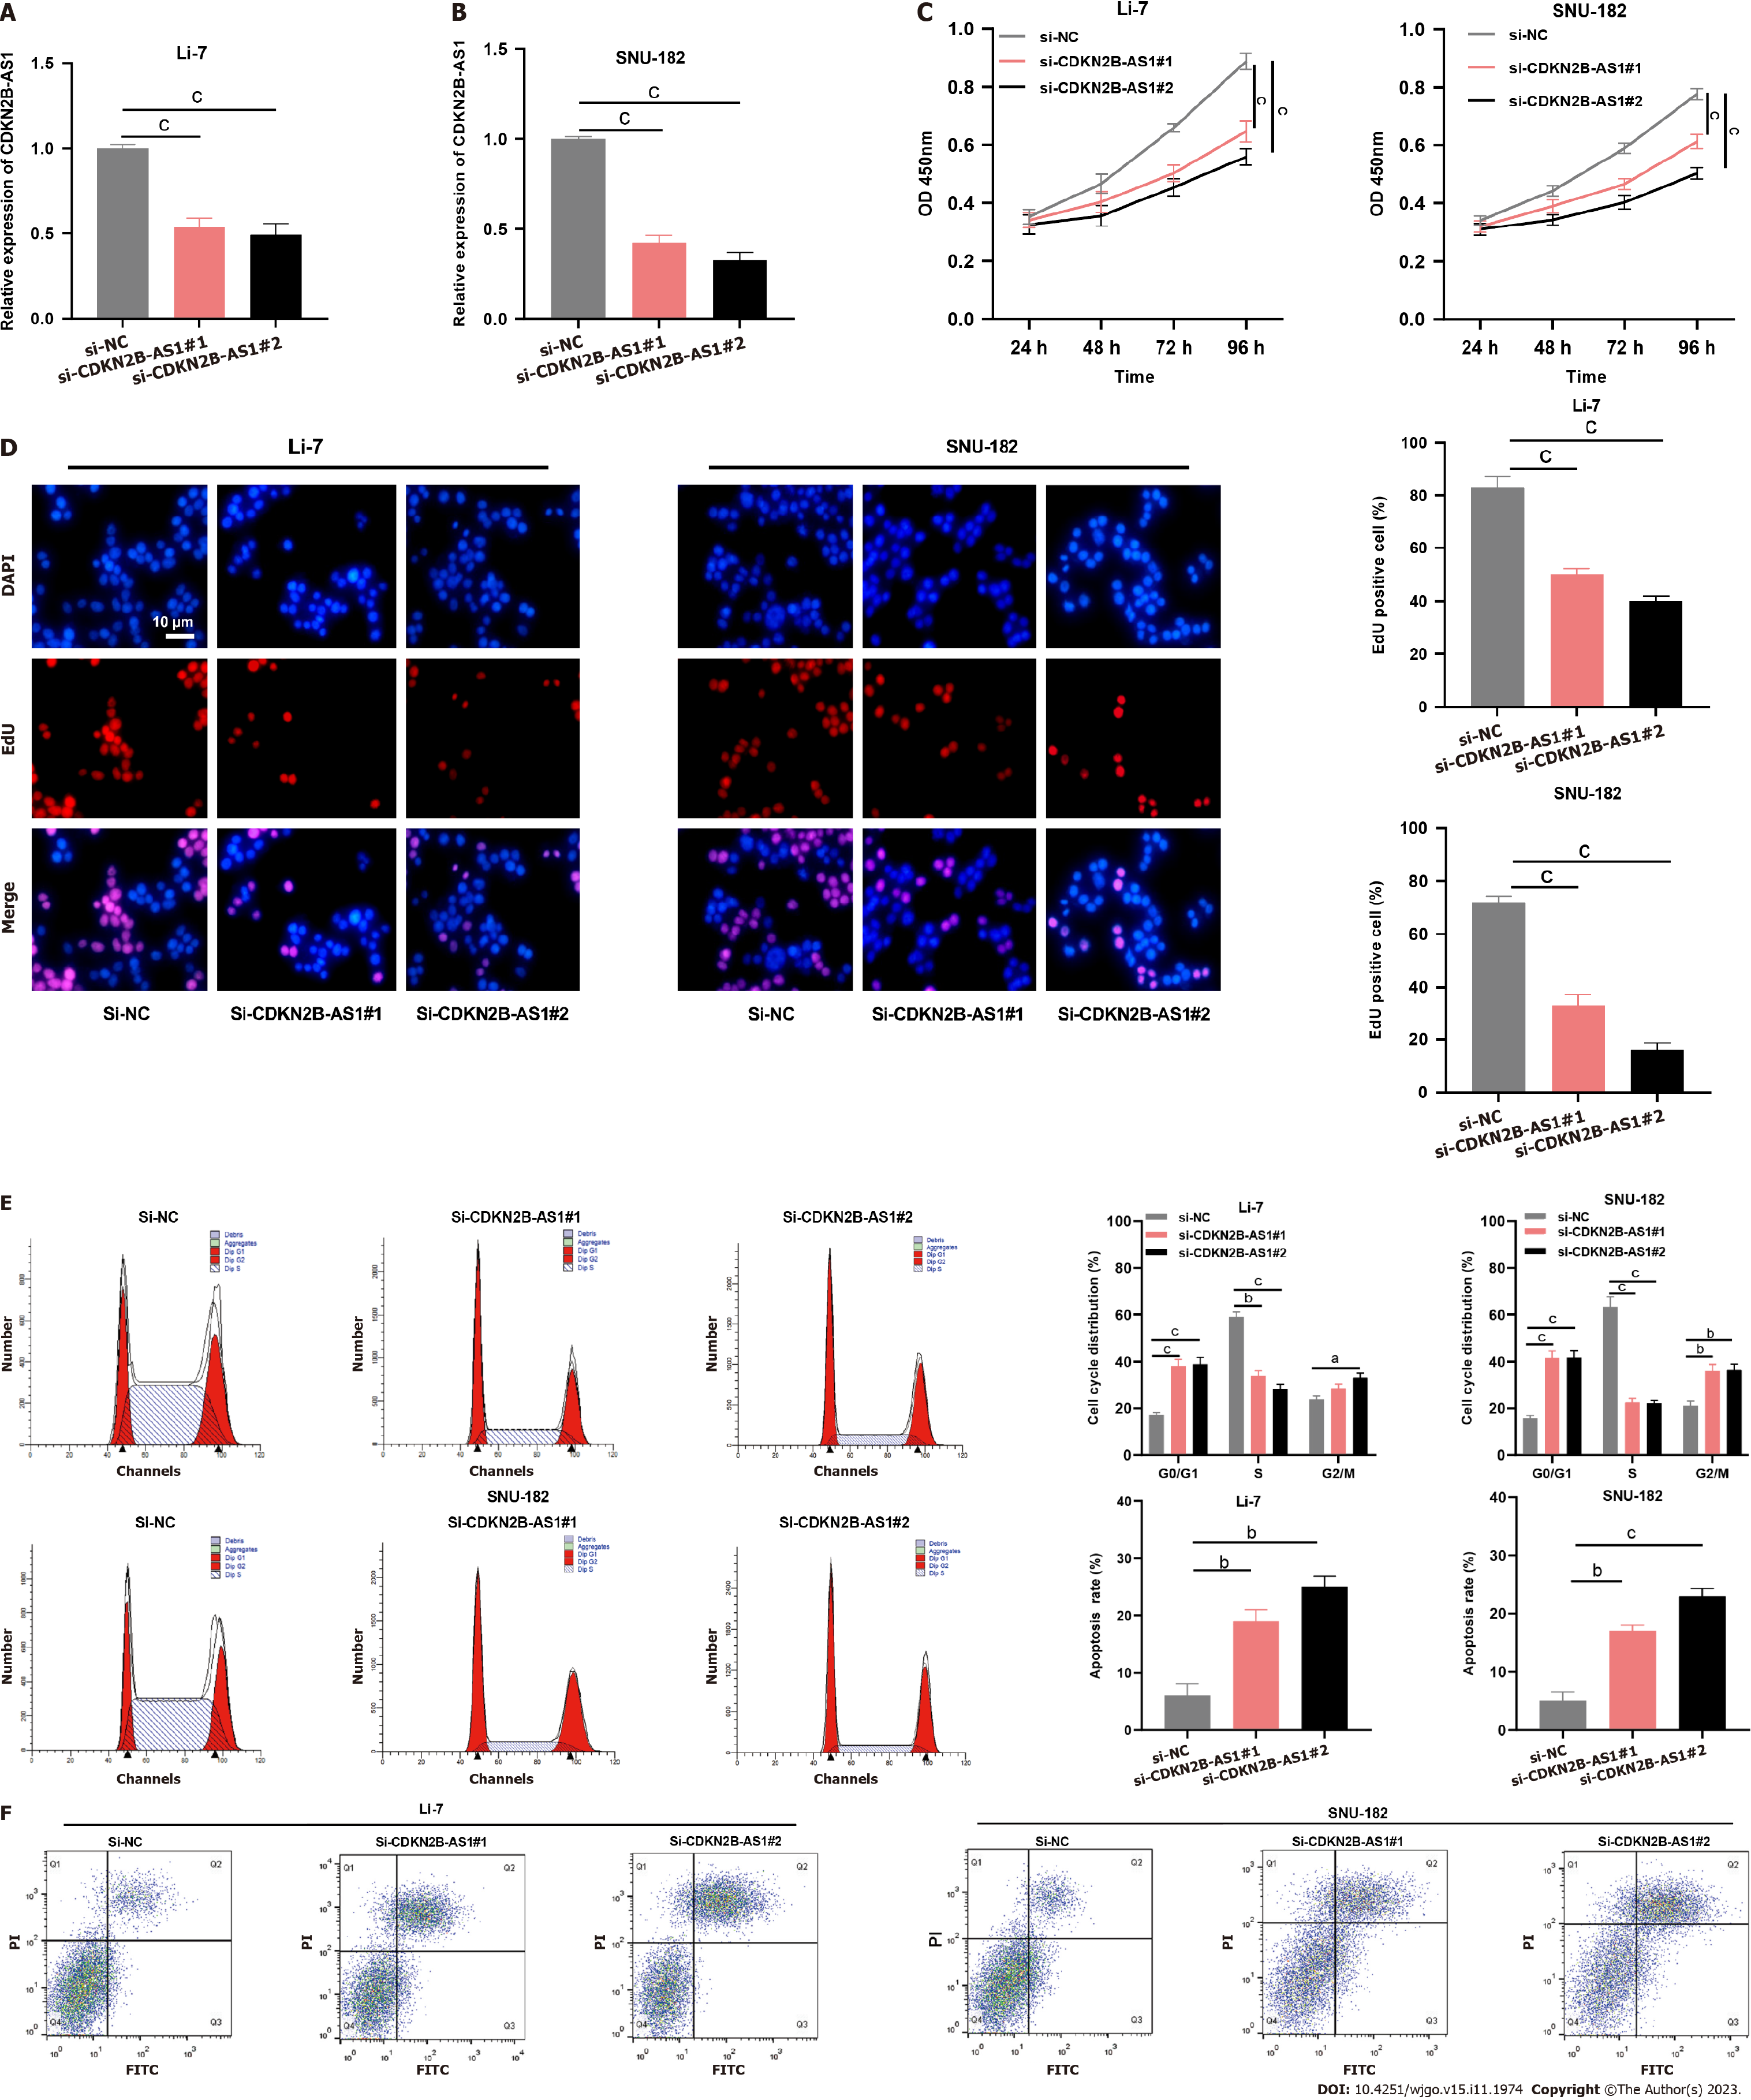
Figure 2 Depletion of CDKN2B-AS1 significantly inhibited the malignancy of hepatocellular carcinoma cells.
A and B: Bar charts that demonstrate the validation results of transfection efficiency after silencing CDKN2B-AS1 in Li-7 (A) and SNU-182 (B) cell lines, which were evaluated by quantitative real-time polymerase chain reaction; C: Line graphs showing proliferation changes in Li-7 (left) and SNU-182 (right) cells after CDKN2B-AS1 knockdown at different time points (24 h, 48 h, 72 h, 96 h); D: Images from EdU assay showing changes in DNA synthesis in Li-7 and SNU-182 cells after CDKN2B-AS1 knockdown. Bar charts summarize the quantitative results of EdU positive cells%; E and F: Flow cytometry results that reveal the effect of silencing of CDKN2B-AS1 on Li-7 and SNU-182 cell cycle (E) and apoptosis (F), E: (Left panel) cell cycle analysis results, the first and last peaks in red indicate G0-G1, G2-M stage, respectively, and the middle part indicates S stage; (right panel) bar charts summarizing cell cycle distribution%; F: (Left panel) dot plot diagrams showing apoptotic cell population changes in CDKN2B-AS1 silenced cells; (right panel) Bar charts summarizing apoptosis rate%. aP < 0.05, bP < 0.01 and cP < 0.001. PI: Propidium iodide.
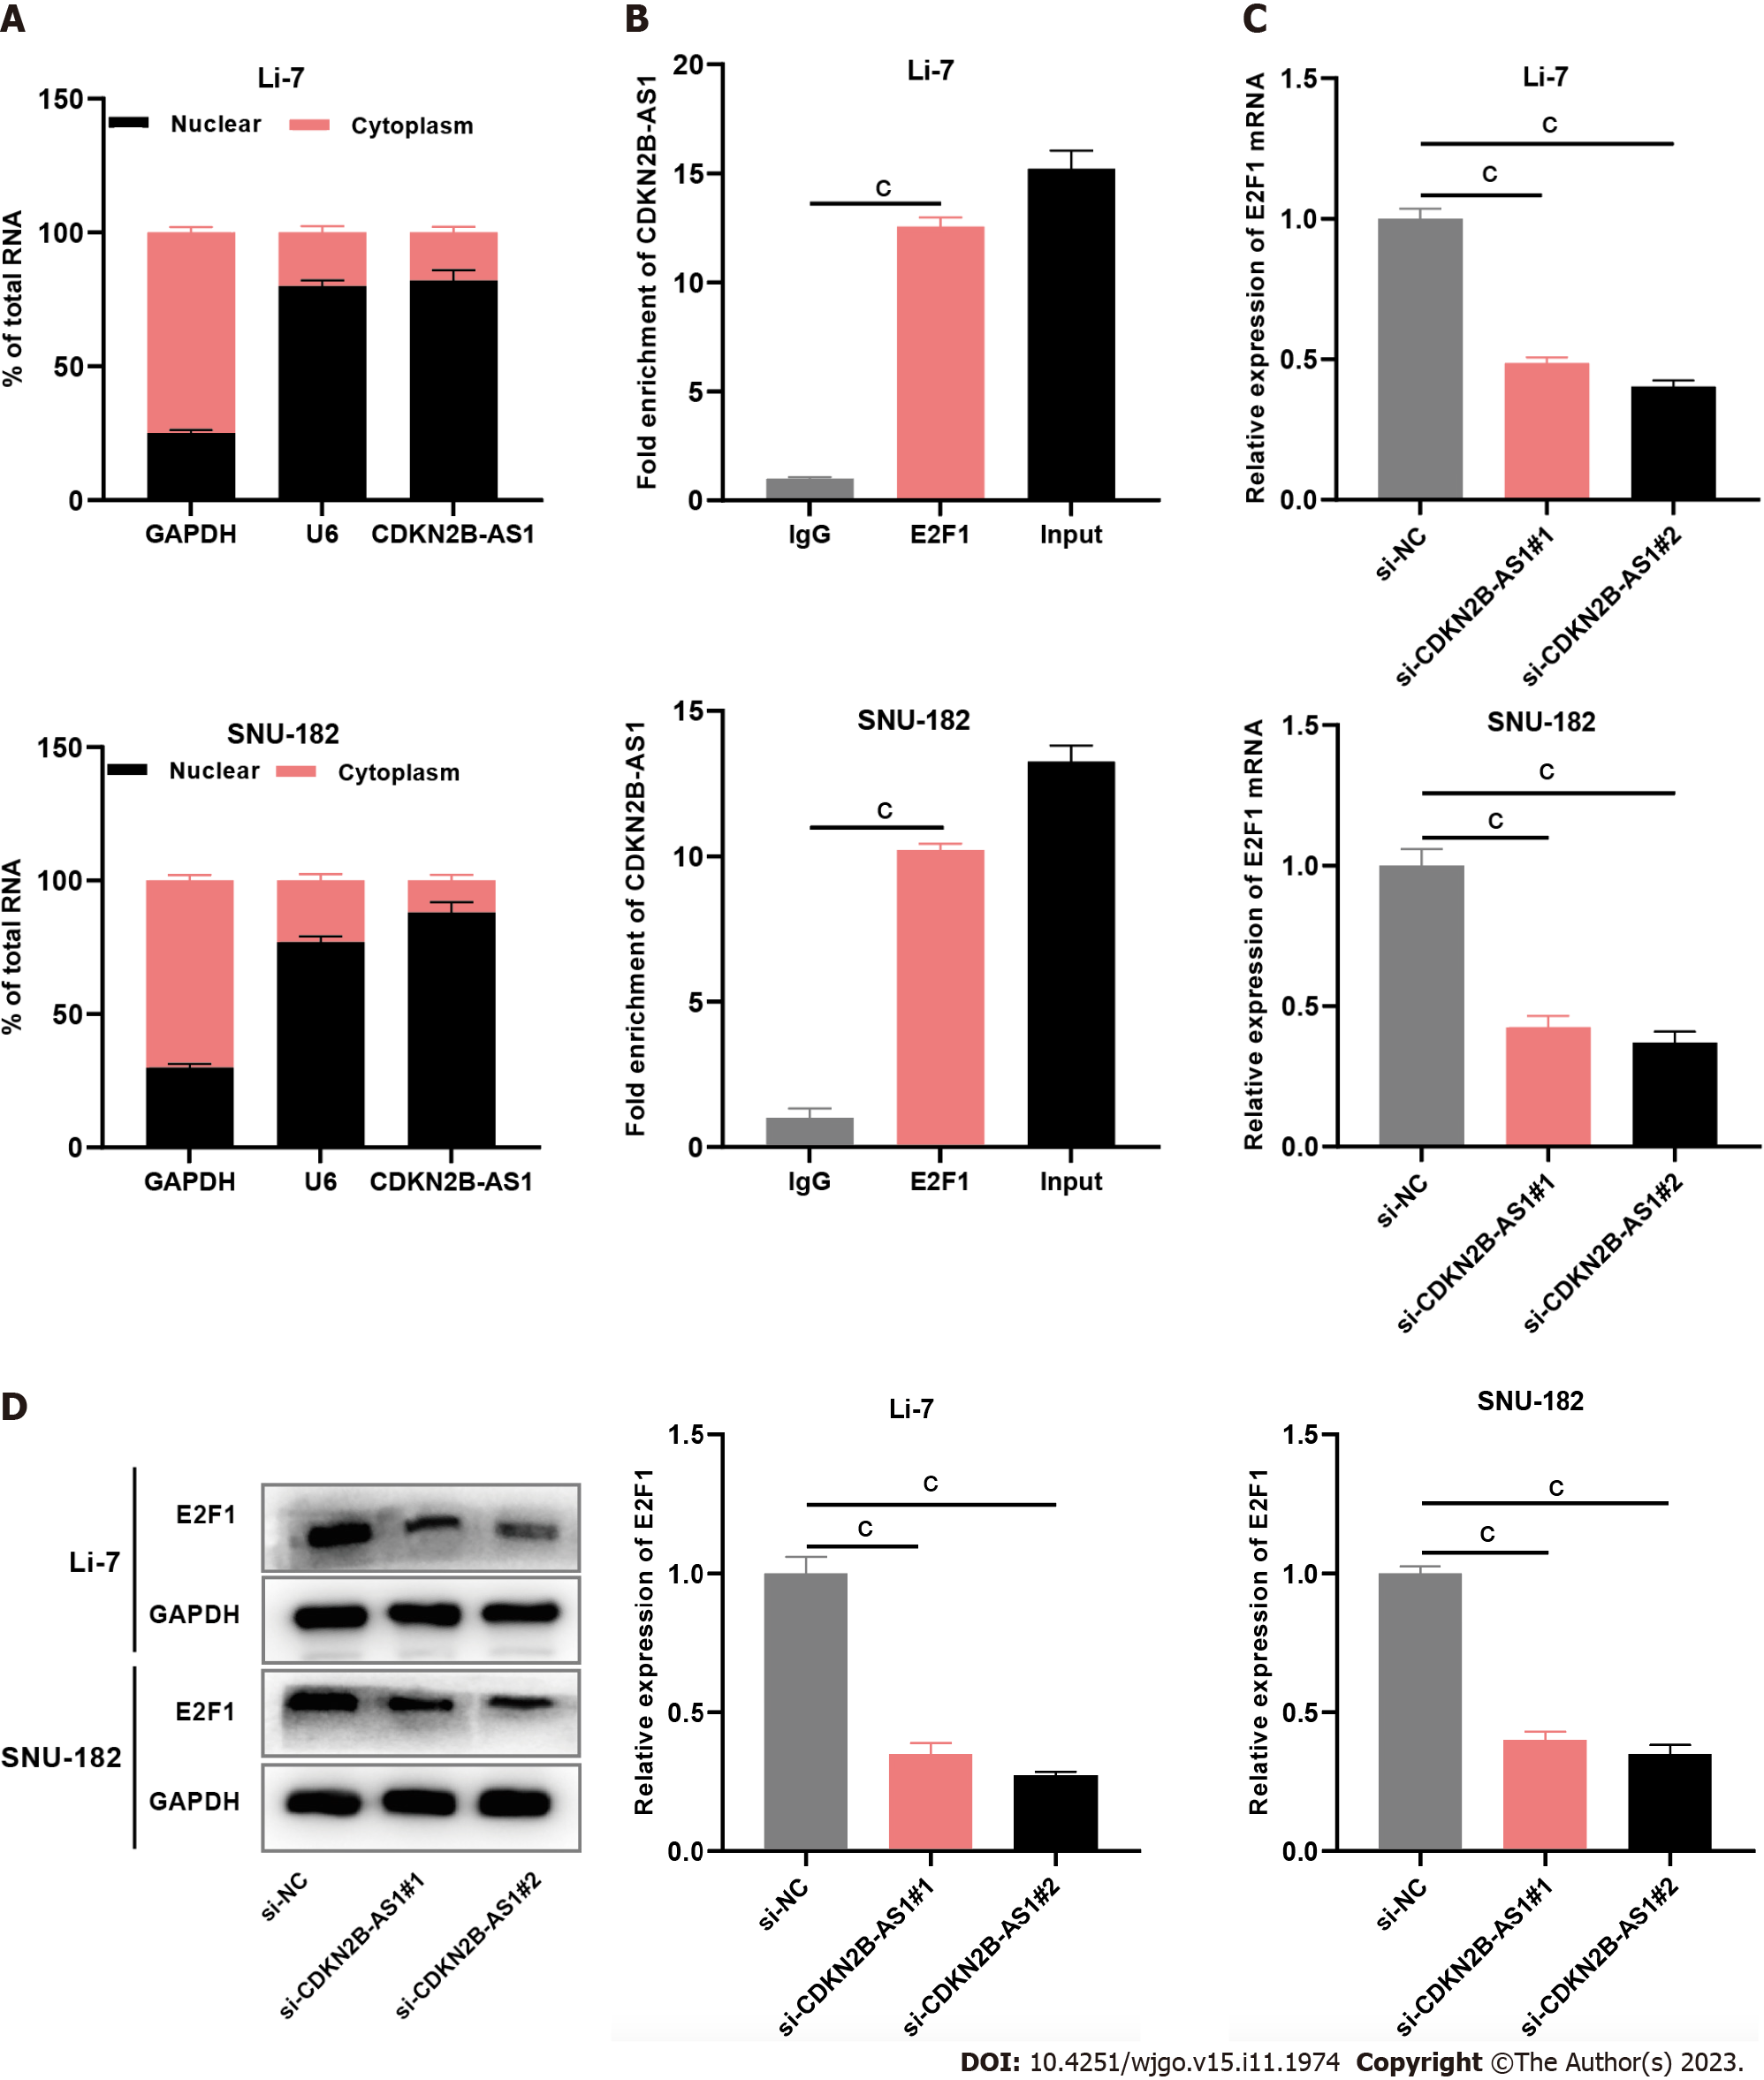
Figure 3 CDKN2B-AS1 interacts with transcription factor E2F transcription factor 1.
A: Bar charts showing CDKN2B-AS1, U6, and GAPDH expressions in the nucleus faction (black part of the column) and cytoplasm fraction (pink part of the column) of Li-7 (left chart) and SNU-182 (right chart) cells detected by subcellular grading assay; B: Bar charts showing the fold enrichment of CDKN2B-AS1 from immunoglobulin G, E2F transcription factor 1 (E2F1), and total input, separately, in Li-7 and SNU-182 cells detected by RNA immunoprecipitation assays; C and D: Bar charts showing the expression levels of E2F1 in Li-7 and SNU-182 cells, after depletion of CDKN2B-AS1, examined by quantitative real-time polymerase chain reaction (C) and western blot assays (D). cP < 0.001. E2F1: E2F transcription factor 1.
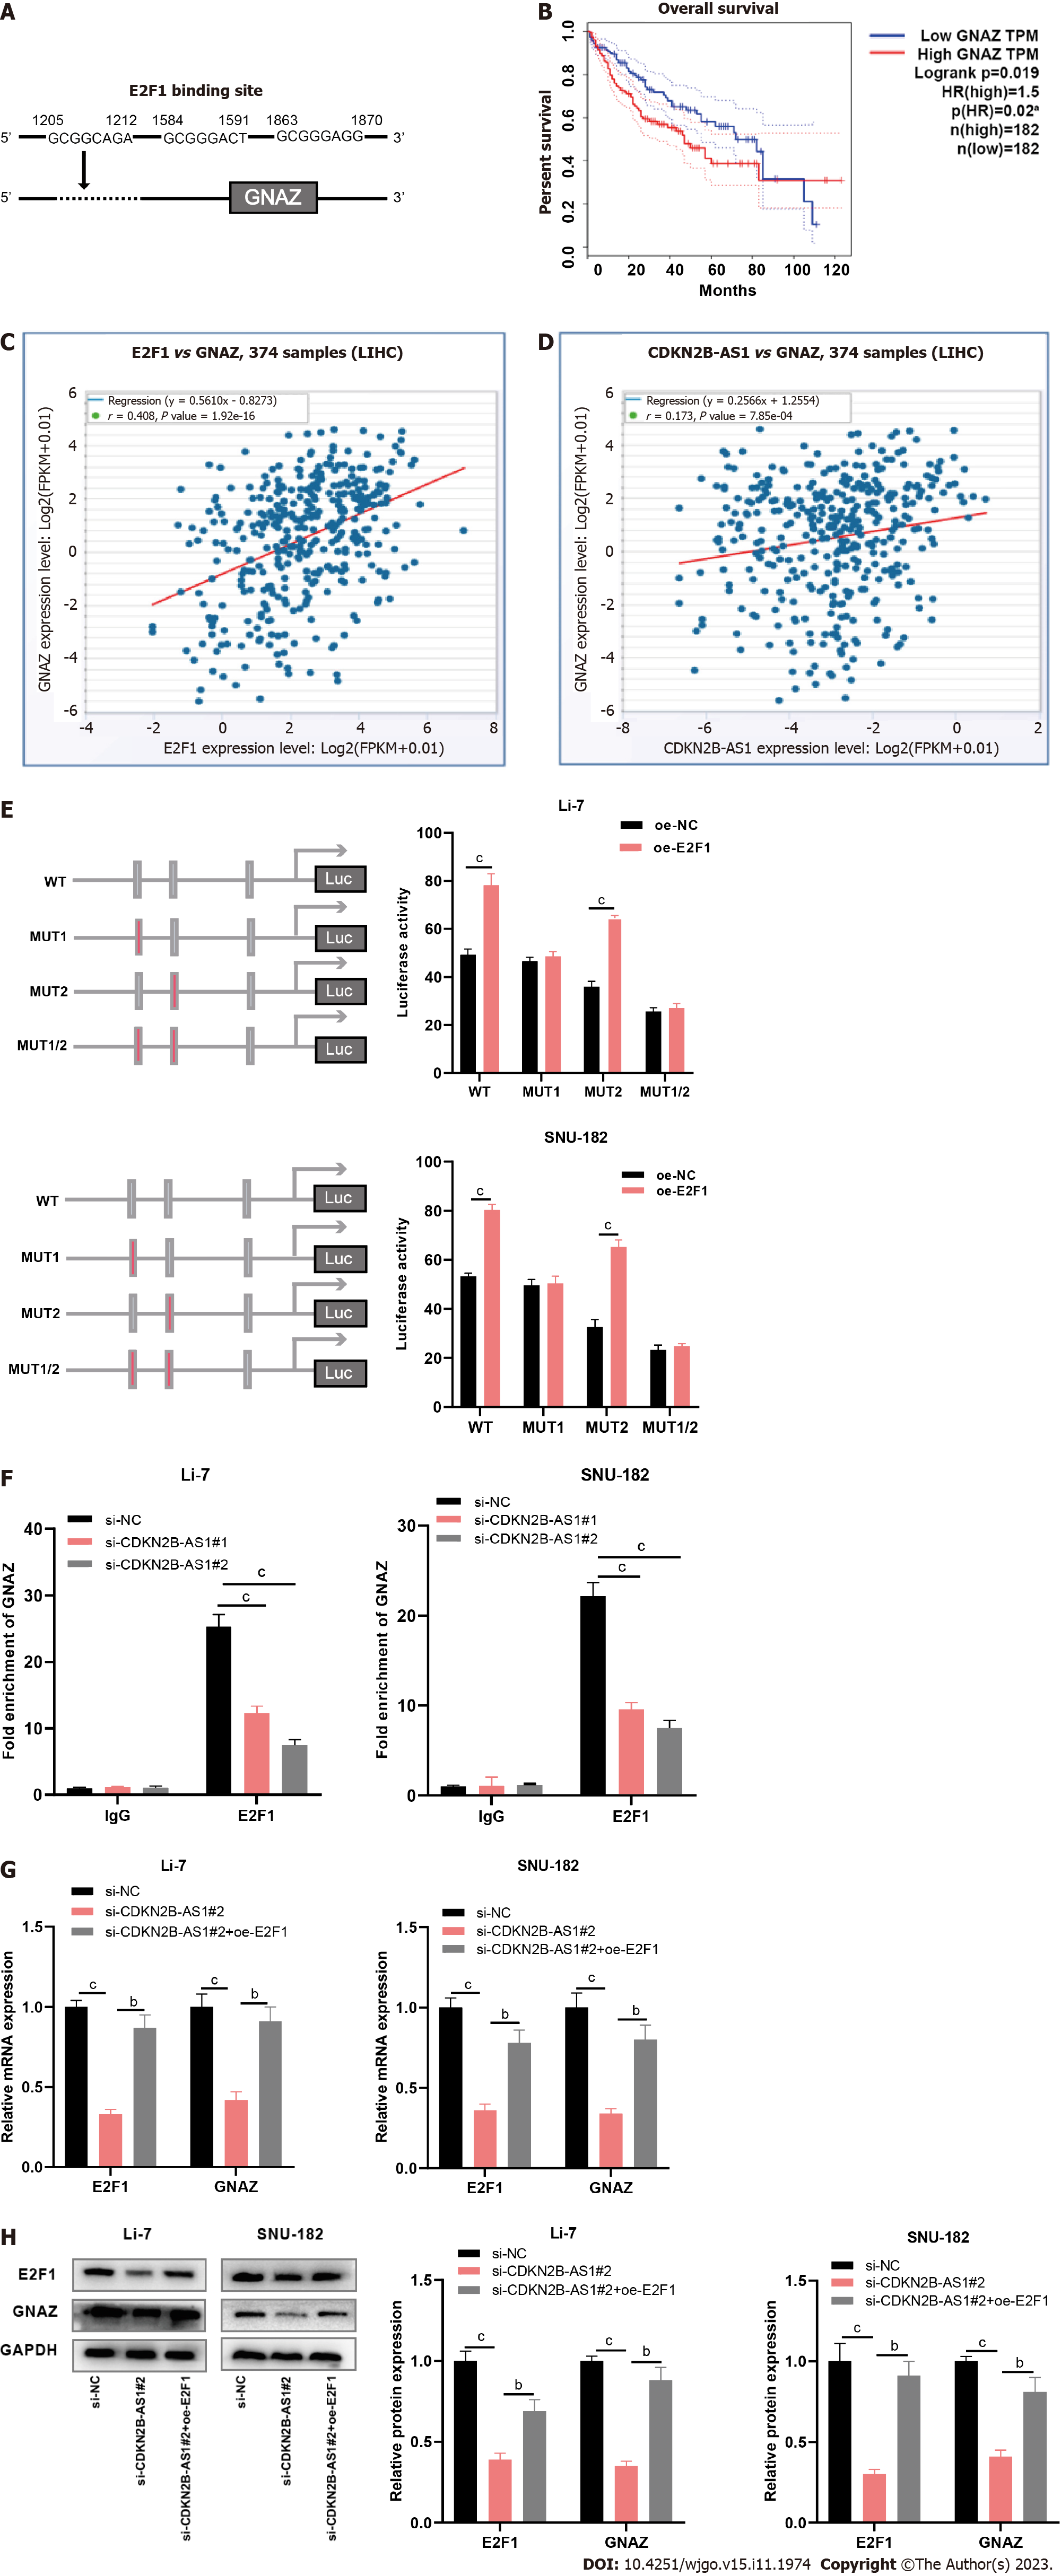
Figure 4 CDKN2B-AS1 promotes transcription of G protein subunit alpha Z by recruiting transcription factor E2F transcription factor 1.
A: Illustration of predicted binding site of E2F transcription factor 1 (E2F1) on the G protein subunit alpha Z (GNAZ) promoter sequence generated from the PROMO database; B: Overall survival plot of hepatocellular carcinoma (HCC) patients grouped by GNAK expressions (high vs low). Red line represents the high expression group and blue line represents the low expression group; C and D: Correlation analyses between expressions of E2F1 and GNAZ (C), and expressions of CDKN2B-AS1 and GNAZ (D), respectively, in HCC tissues from StarBase database. P < 0.05 indicates a significant correlation; E: Dual-luciferase reporter gene assays were conducted to predict the specific site of binding of E2F1 protein to the GNAZ promoter. Bar charts summarize the luciferase activity in Li-7 and SNU-182 cell lines overexpressed with E2F1 with wild type and mutated form of GNAZ (MUT1, MUT2, MUT1/2); F: Bar charts showing the fold enrichment of GNAZ promoter from immunoglobulin G and E2F1, separately, in CDKN2B-AS1 silenced Li-7 and SNU-182 cells, detected by Chromatin immunoprecipitation experiments; G and H: Bar charts showing the expression levels of E2F1 and GNAZ in Li-7 and SNU-182 cells, after depletion of CDKN2B-AS1, examined by quantitative real-time polymerase chain reaction (G) and western blot assays (H). bP < 0.01, cP < 0.001. E2F1: E2F transcription factor 1; GNAZ: G protein subunit alpha Z; IgG: Immunoglobulin G.
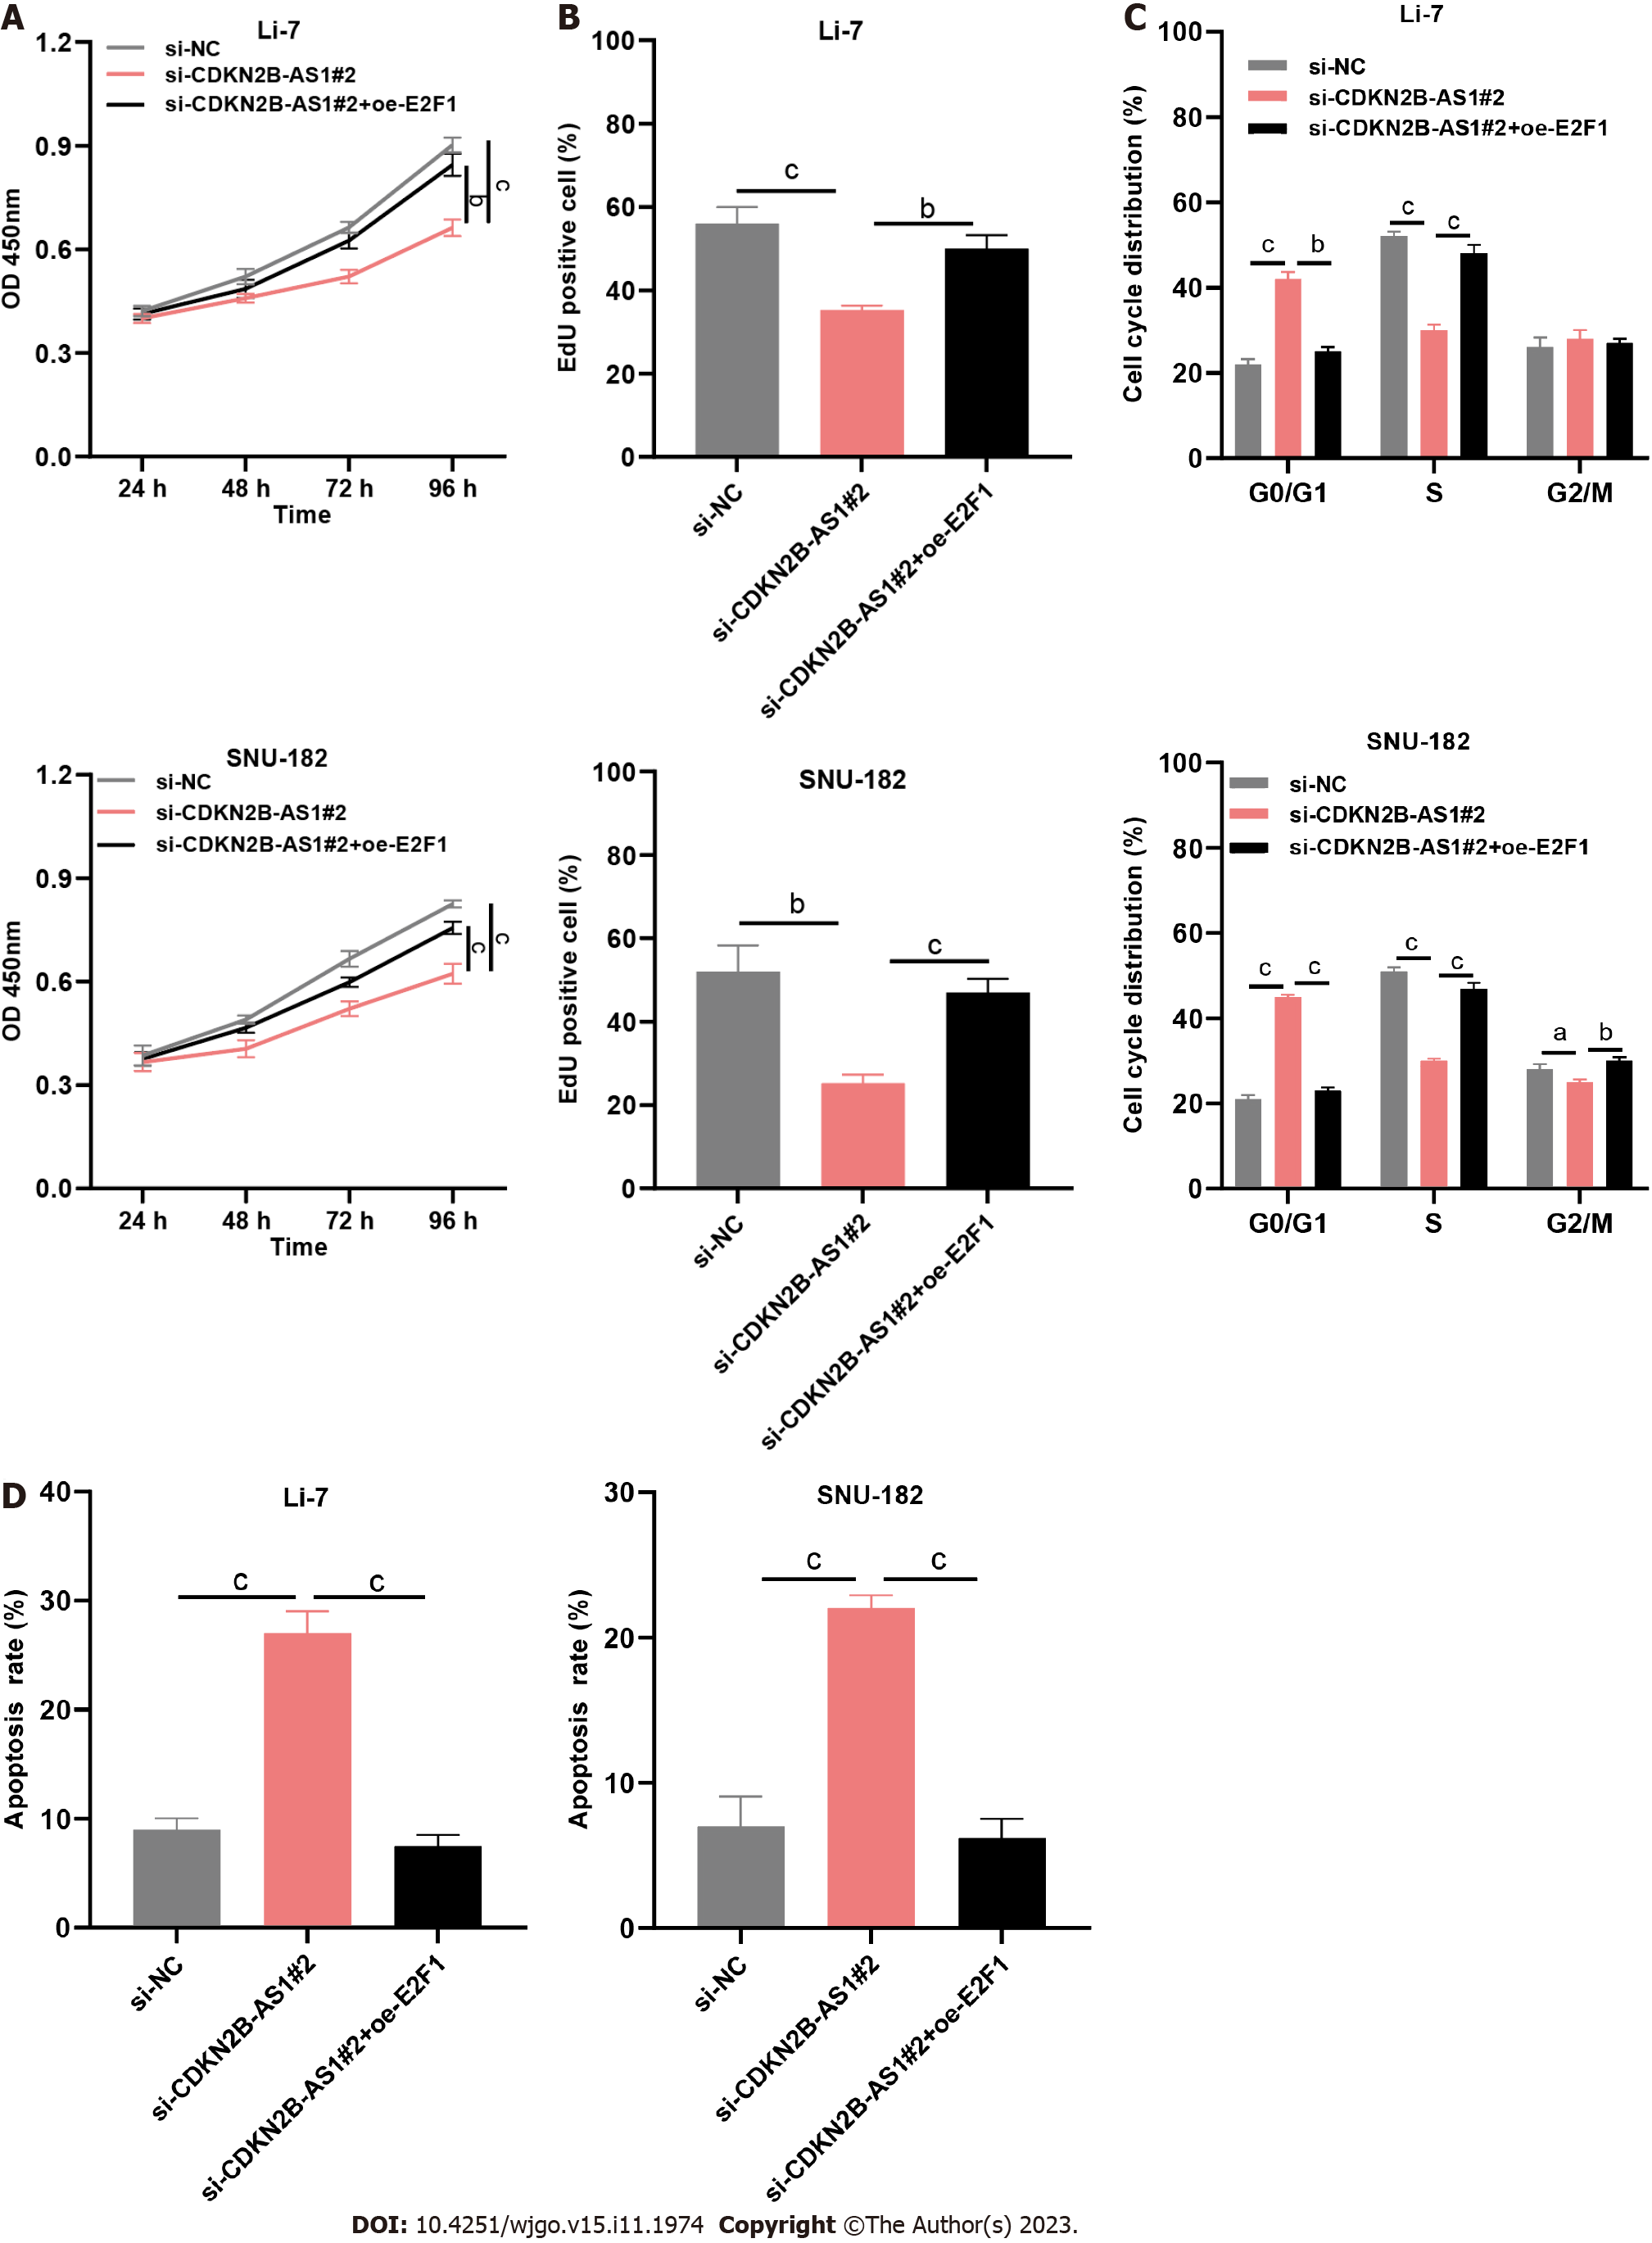
Figure 5 CDKN2B-AS1 regulates the malignancy of hepatocellular carcinoma cells through the E2F transcription factor 1/G protein subunit alpha Z axis.
A: Line graphs showing proliferation changes in Li-7 (left) and SNU-182 (right) cells with si-CDKN2B-AS1, or si-CDKN2B-AS1 + oe-E2F transcription factor 1 (E2F1), at different time points (24 h, 48 h, 72 h, 96 h); B: Bar charts summarize the quantitative results of EdU positive cells% showing changes in DNA synthesis in Li-7 and SNU-182 cells with si-CDKN2B-AS1, or si-CDKN2B-AS1 + oe-E2F1; C and D: Bar charts summarizing cell cycle distribution% (C) and apoptosis rate% (D) that reveal the effect of si-CDKN2B-AS1, or si-CDKN2B-AS1 + oe-E2F1 on Li-7 and SNU-182 cell cycle and apoptosis, respectively. aP < 0.05, bP < 0.01, cP < 0.001. E2F1: E2F transcription factor 1.
- Citation: Tao ZG, Yuan YX, Wang GW. Long non-coding RNA CDKN2B-AS1 promotes hepatocellular carcinoma progression via E2F transcription factor 1/G protein subunit alpha Z axis. World J Gastrointest Oncol 2023; 15(11): 1974-1987
- URL: https://www.wjgnet.com/1948-5204/full/v15/i11/1974.htm
- DOI: https://dx.doi.org/10.4251/wjgo.v15.i11.1974


