Copyright
©The Author(s) 2023.
World J Gastrointest Oncol. Jan 15, 2023; 15(1): 195-204
Published online Jan 15, 2023. doi: 10.4251/wjgo.v15.i1.195
Published online Jan 15, 2023. doi: 10.4251/wjgo.v15.i1.195
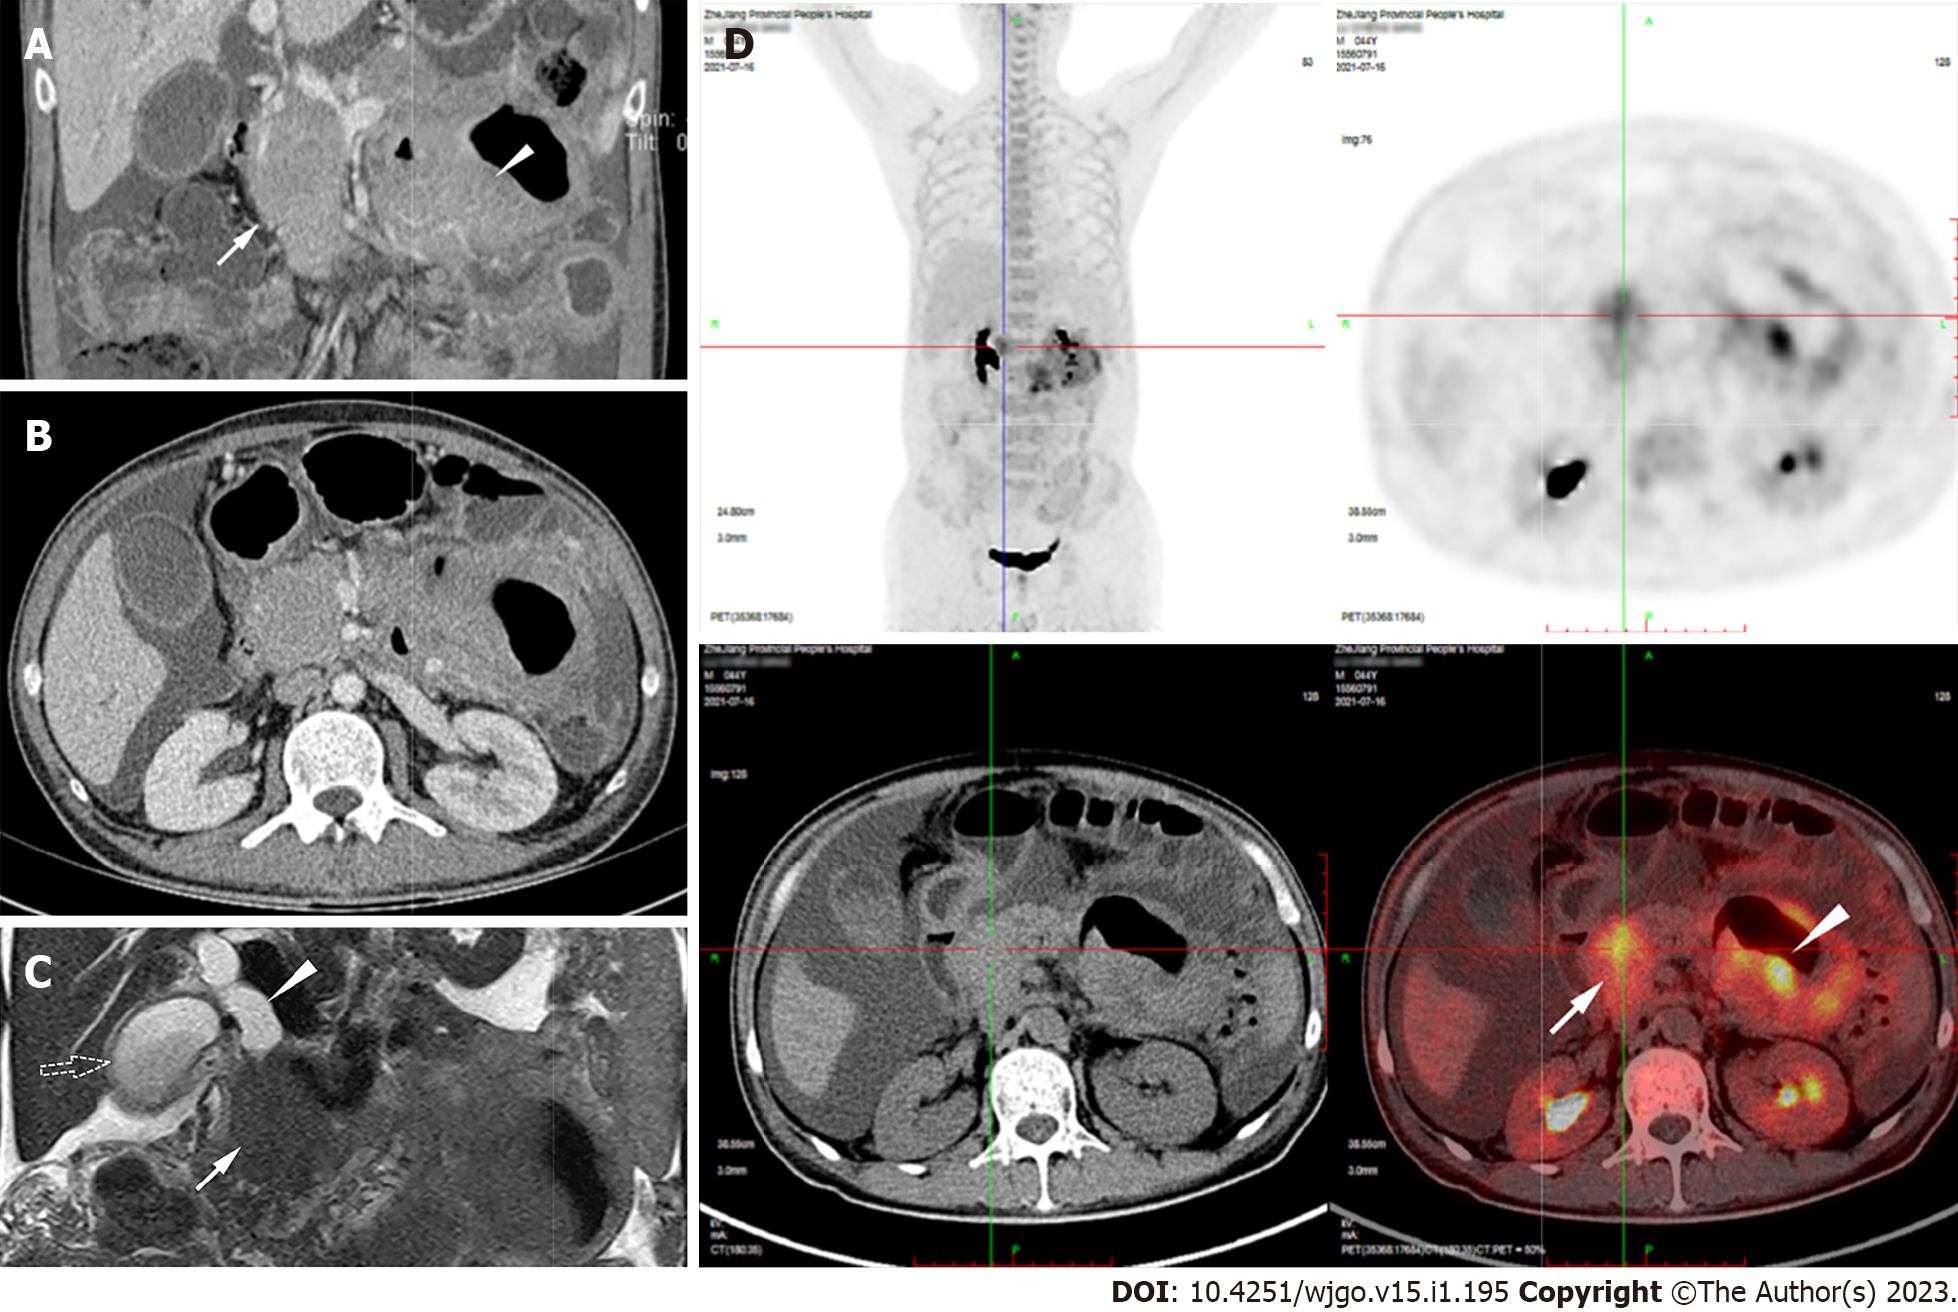
Figure 1 Radiology findings of the lesions.
A: There was circular solid occupying lesion in pancreatic head with 88 mm × 47 mm × 52 mm in size (white arrow). Jejunal wall thickened to 34 mm (white arrow head), without intestinal stenosis and obstructive signs; B: These two lesions were both in uniform computed tomography (CT) density and moderate enhancement; C: Magnetic resonance cholangiopancreatography revealed the head pancreatic mass (white arrow) with dilated biliary duct (white arrow head) and enlarged gallbladder (dotted arrow); D: 18F-Fluorodeoxyglucose(18-F FDG) positron emission tomography/CT detected intensive FDG uptake within the pancreatic head lesion (white arrow) and the jejunal wall thickening (white arrow head).
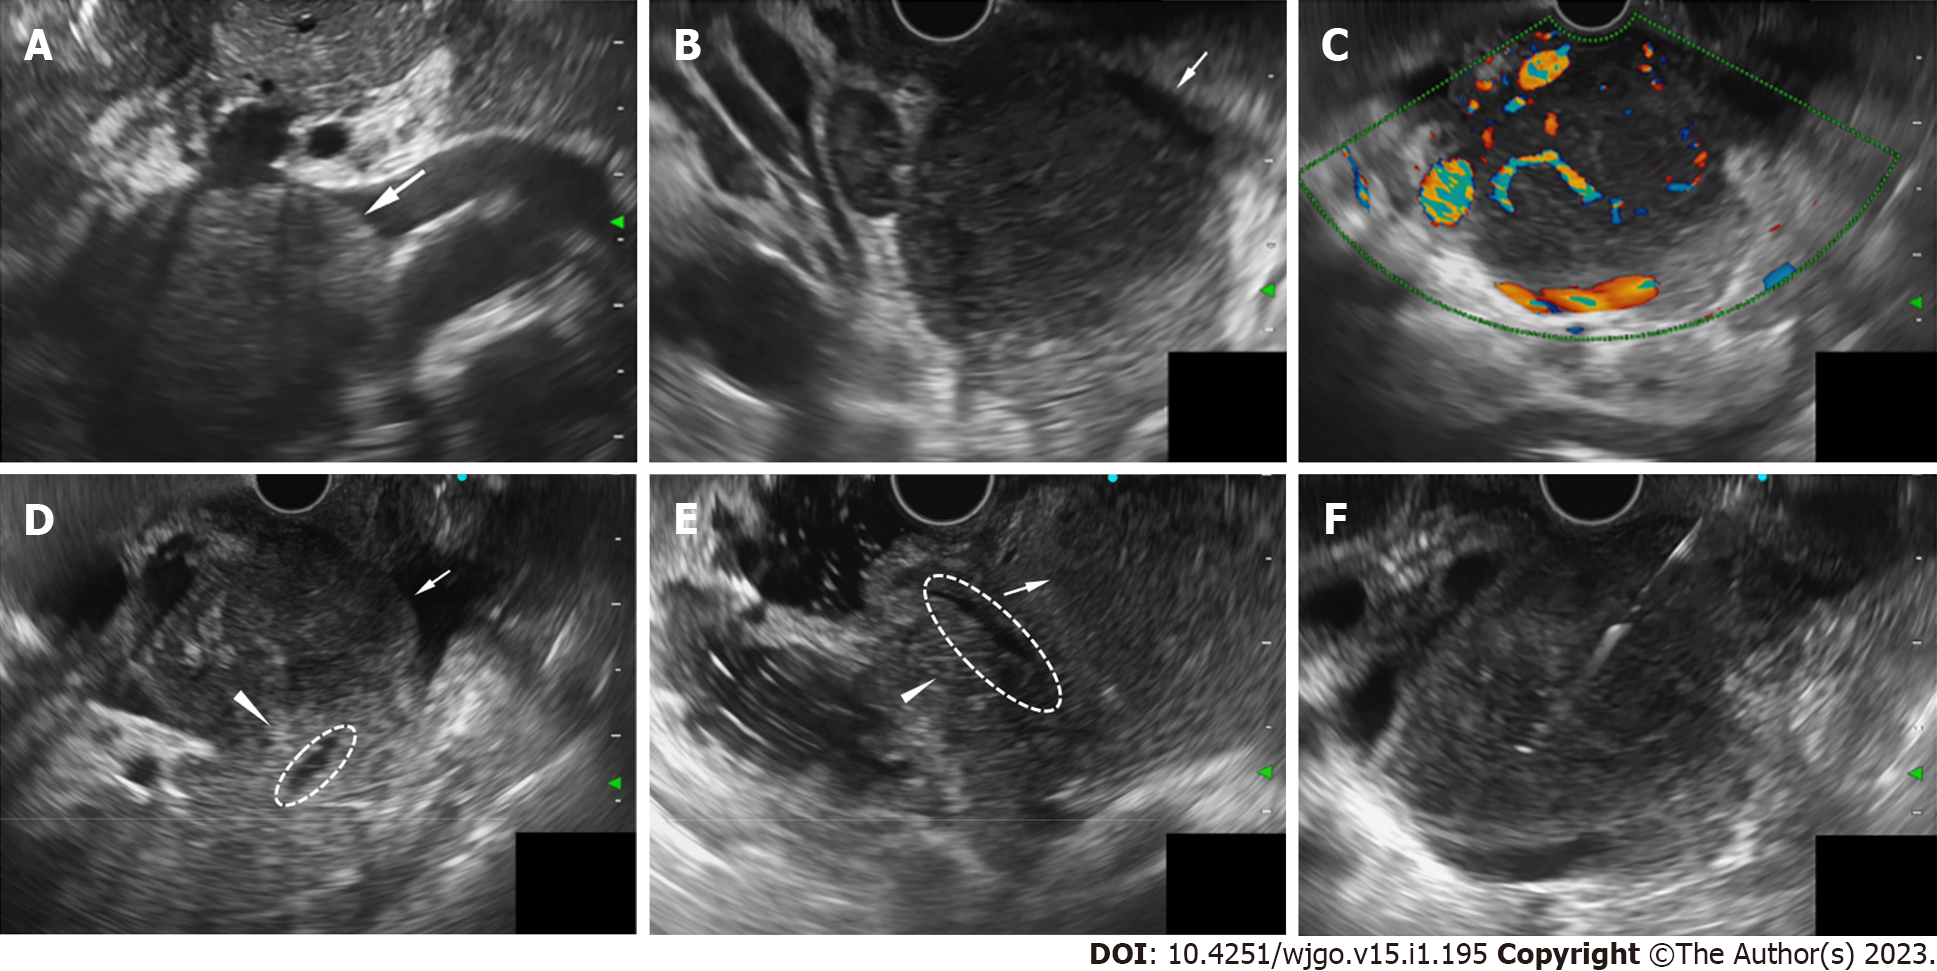
Figure 2 Endoscopic ultrasound characteristic of the lesion located in pancreatic head region.
A and B: A 51.0 mm × 45.8 mm well-defined homogenously hypoechoic lesion located in the pancreatic head region (A: Transgastric observation, white arrow; B: Transduodenal observation, white arrow); C: The lesion is hypervascularity in color and power Doppler ultrasound; D and E: Observing in the duodenal bulb (D) and descending part of duodenum (E), the lesion (white arrow) is adjacent to the pancreatic head parenchyma (white arrow head), but boundaries were still preserved. The main pancreatic duct (dotted circle) ran alongside the lesion naturally, without any signs of infiltration or dilatation; F: Endoscopic ultrasound-Fine needle biopsy using a 22 gauge needle was performed.
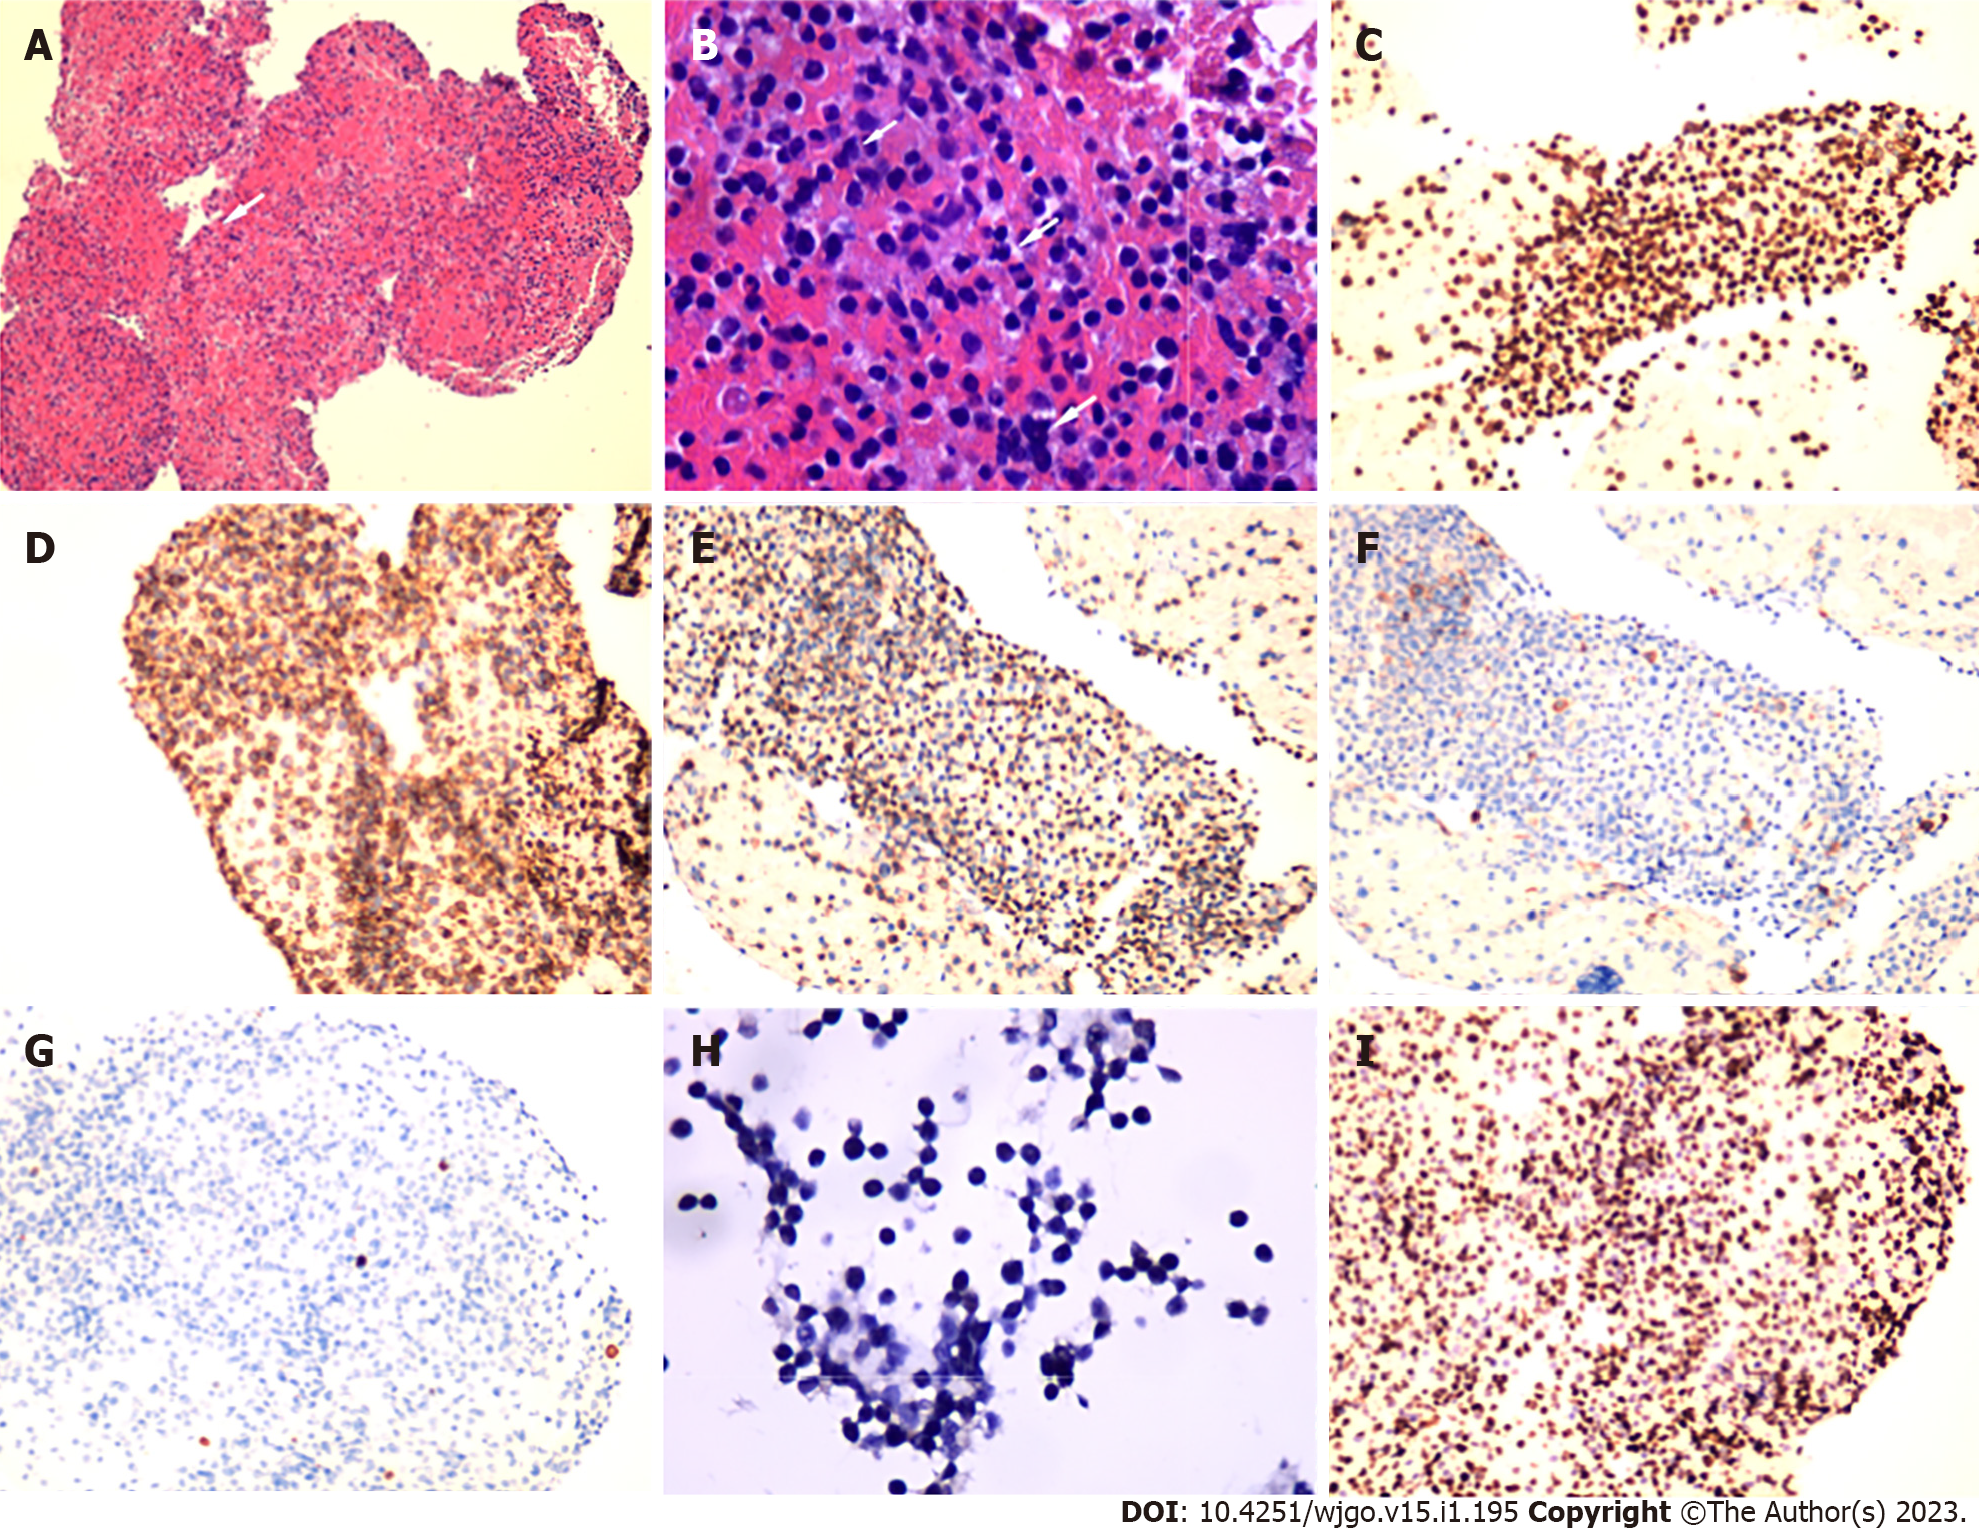
Figure 3 Pathological findings in Hematoxylin and Eosin staining and Immunohistochemical results.
A and B: Microscopic examination revealed small round cells (A: 100 ×, white arrow) arranged in diffuse sheets, with nuclear membrane irregularity (B: 600 ×, white arrow); C-I: Immunohistochemical results revealed that the expression of cluster of differentiation (CD) 3, CD8 and CD56 was positive. The expression of CD20, CD4 and EBER was negative, and Ki-67 was approximately 80%.
Figure 4 Multicolor flow cytometry immunophenotype of the lesion.
A: Doublets were excluded by side-scatter height (SSC-H) / side-scatter area (SSC-A) scatter. Debris were excluded by side-Forward-scatter area (FSC-A)/SSC-A and FSC-A/CD45. Abnormal natural kill (NK) cells (red) were gated by SSC-A/CD45 and CD38/CD19. These cells were CD45++, CD16 partial positive, CD7++, CD38+, HLA-DR-, CD34-, CD117-, CD19-, CD33-, CD13-. Neutrophils (blue) were shown as internal control; B-D: The abnormal NK cells (red) were targeting T cell receptor beta-chain constant region 1(TRBC1)-, CD5-, TCR gammadelta (TCRγδ)-, CD2++, CD3++, CD4-, CD8+, CD56++, CD25-, CD5-, CD99++, TCRalphabeta (TCRαβ)-, CD335-, CD28-, CD57-. CD158a, h expression of these cells was 40.123%. Normal T cells (green) were shown as internal control.
- Citation: Wang YN, Zhu YM, Lei XJ, Chen Y, Ni WM, Fu ZW, Pan WS. Intestinal natural killer/T-cell lymphoma presenting as a pancreatic head space-occupying lesion: A case report. World J Gastrointest Oncol 2023; 15(1): 195-204
- URL: https://www.wjgnet.com/1948-5204/full/v15/i1/195.htm
- DOI: https://dx.doi.org/10.4251/wjgo.v15.i1.195


