Copyright
©The Author(s) 2023.
World J Gastrointest Oncol. Jan 15, 2023; 15(1): 128-142
Published online Jan 15, 2023. doi: 10.4251/wjgo.v15.i1.128
Published online Jan 15, 2023. doi: 10.4251/wjgo.v15.i1.128
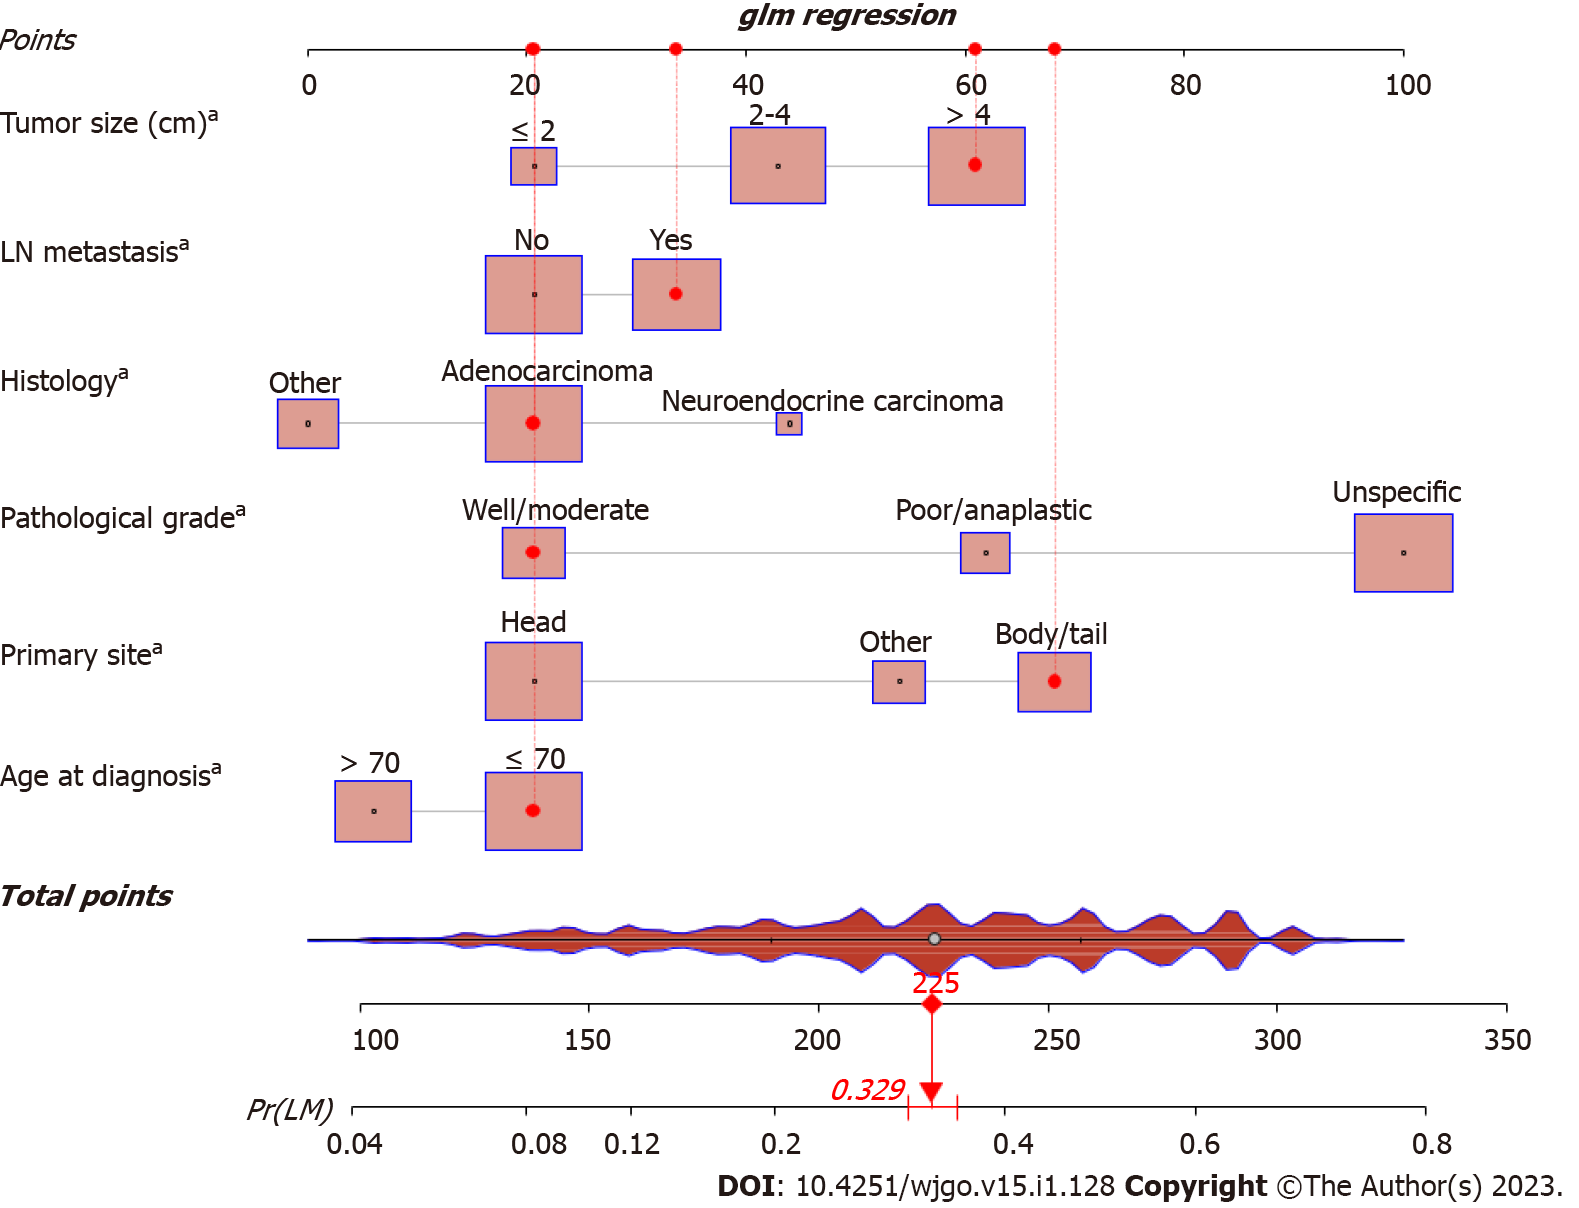
Figure 1 Nomogram for predicting liver metastasis from pancreatic cancer patients.
aP < 0.001. LN: Lymph node; LM: Liver metastasis.
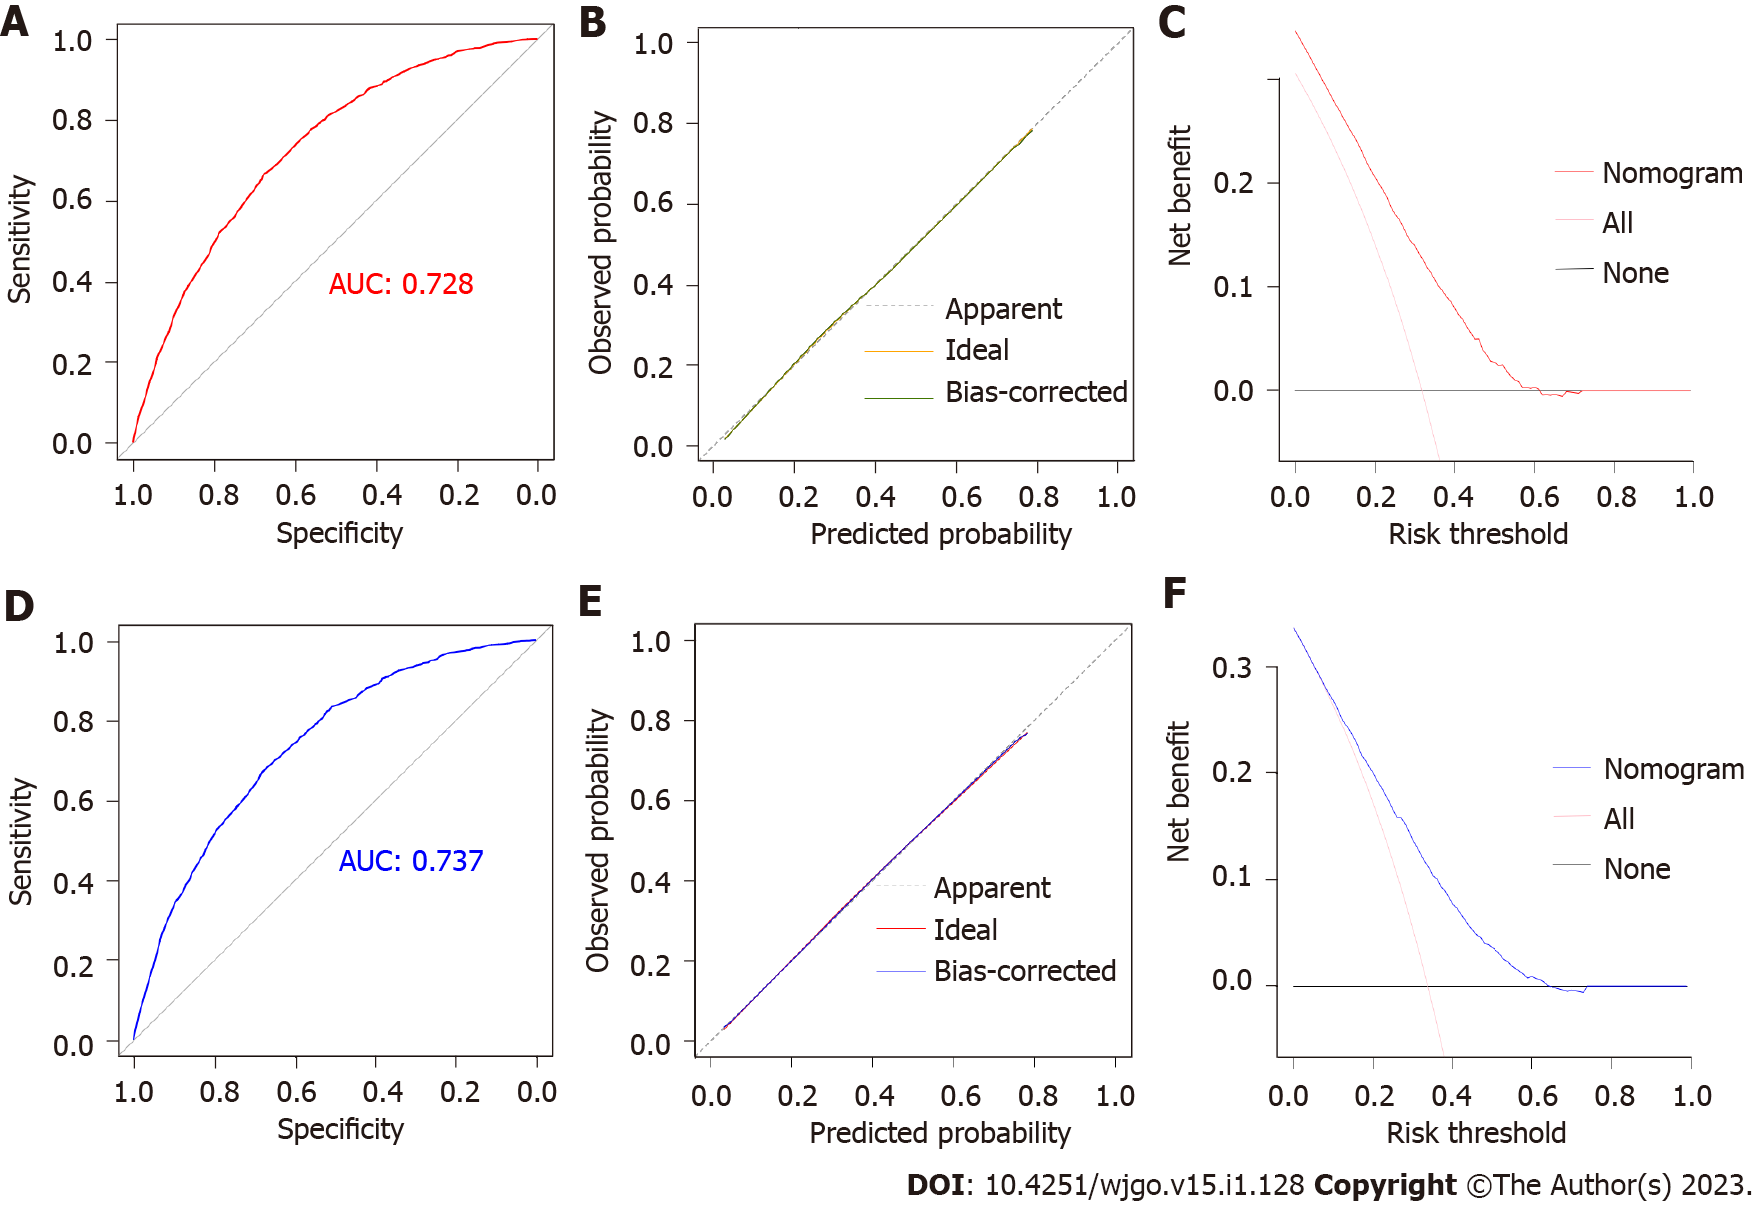
Figure 2 Validation of the diagnostic nomogram in the training and validation sets.
A: The receiver operating characteristic curve of the training set; B: The calibration curve of the training set; C: The decision curve analysis of the training set; D: The receiver operating characteristic curve of the validation set; E: The calibration curve of the validation set; F: The decision curve analysis of the validation set. AUC: Area under curve.
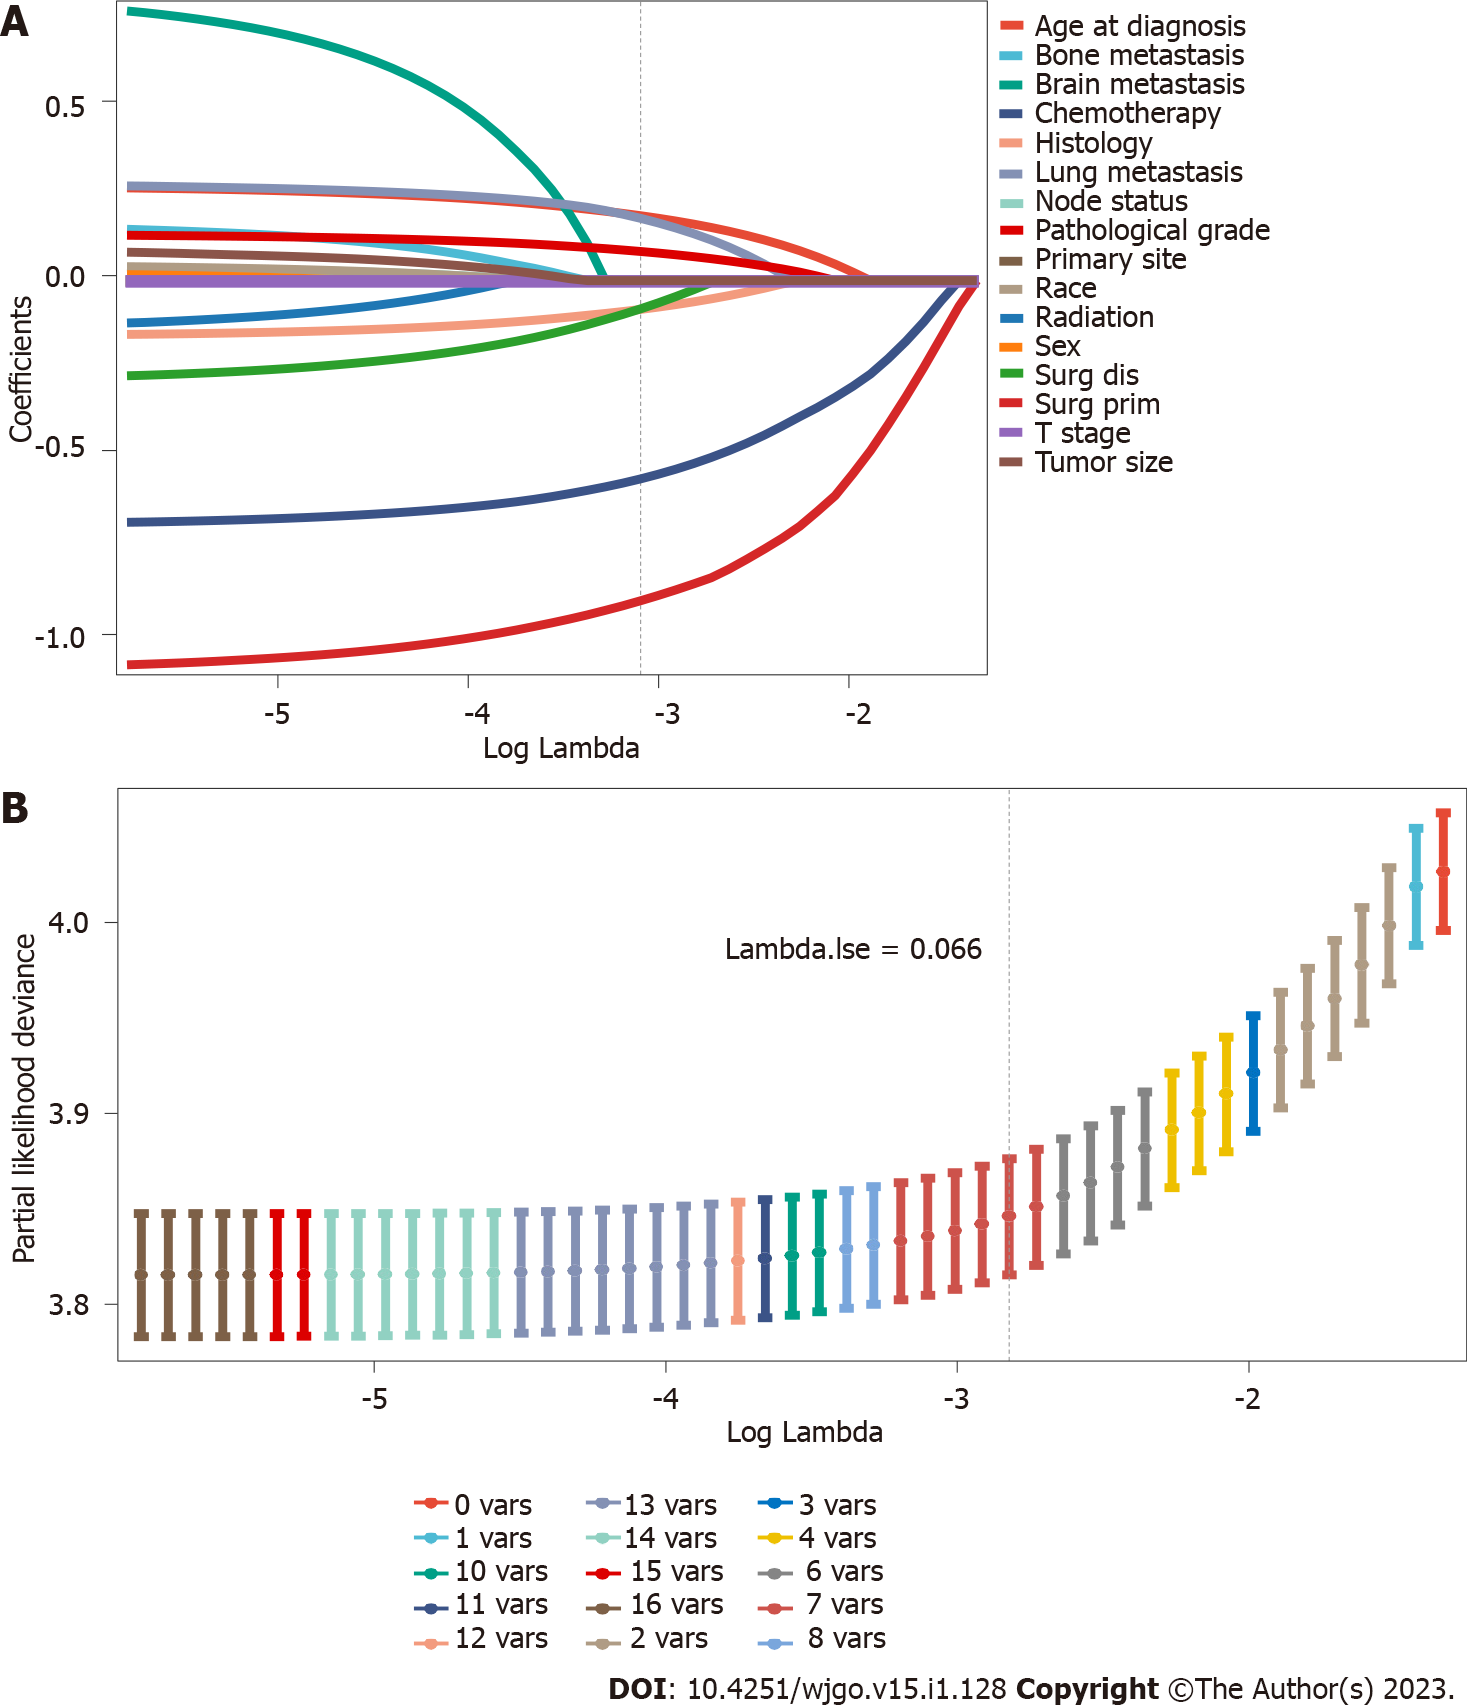
Figure 3 The least absolute shrinkage and selection operator regression used to select prognostic factors for overall survival.
A: Least absolute shrinkage and selection operator (LASSO) coefficient profiles of 16 variables for overall survival (OS); B: LASSO Cox analysis identified 7 variables for OS. The LASSO regression analysis run in R runs 10 times K cross-validation for centralization and normalization of included variables and then selects the most appropriate lambda value depending on the type measure of -2 Log-likelihood and binomial family. “Lambda.lse” gives a model with good performance but the least number of independent variables.
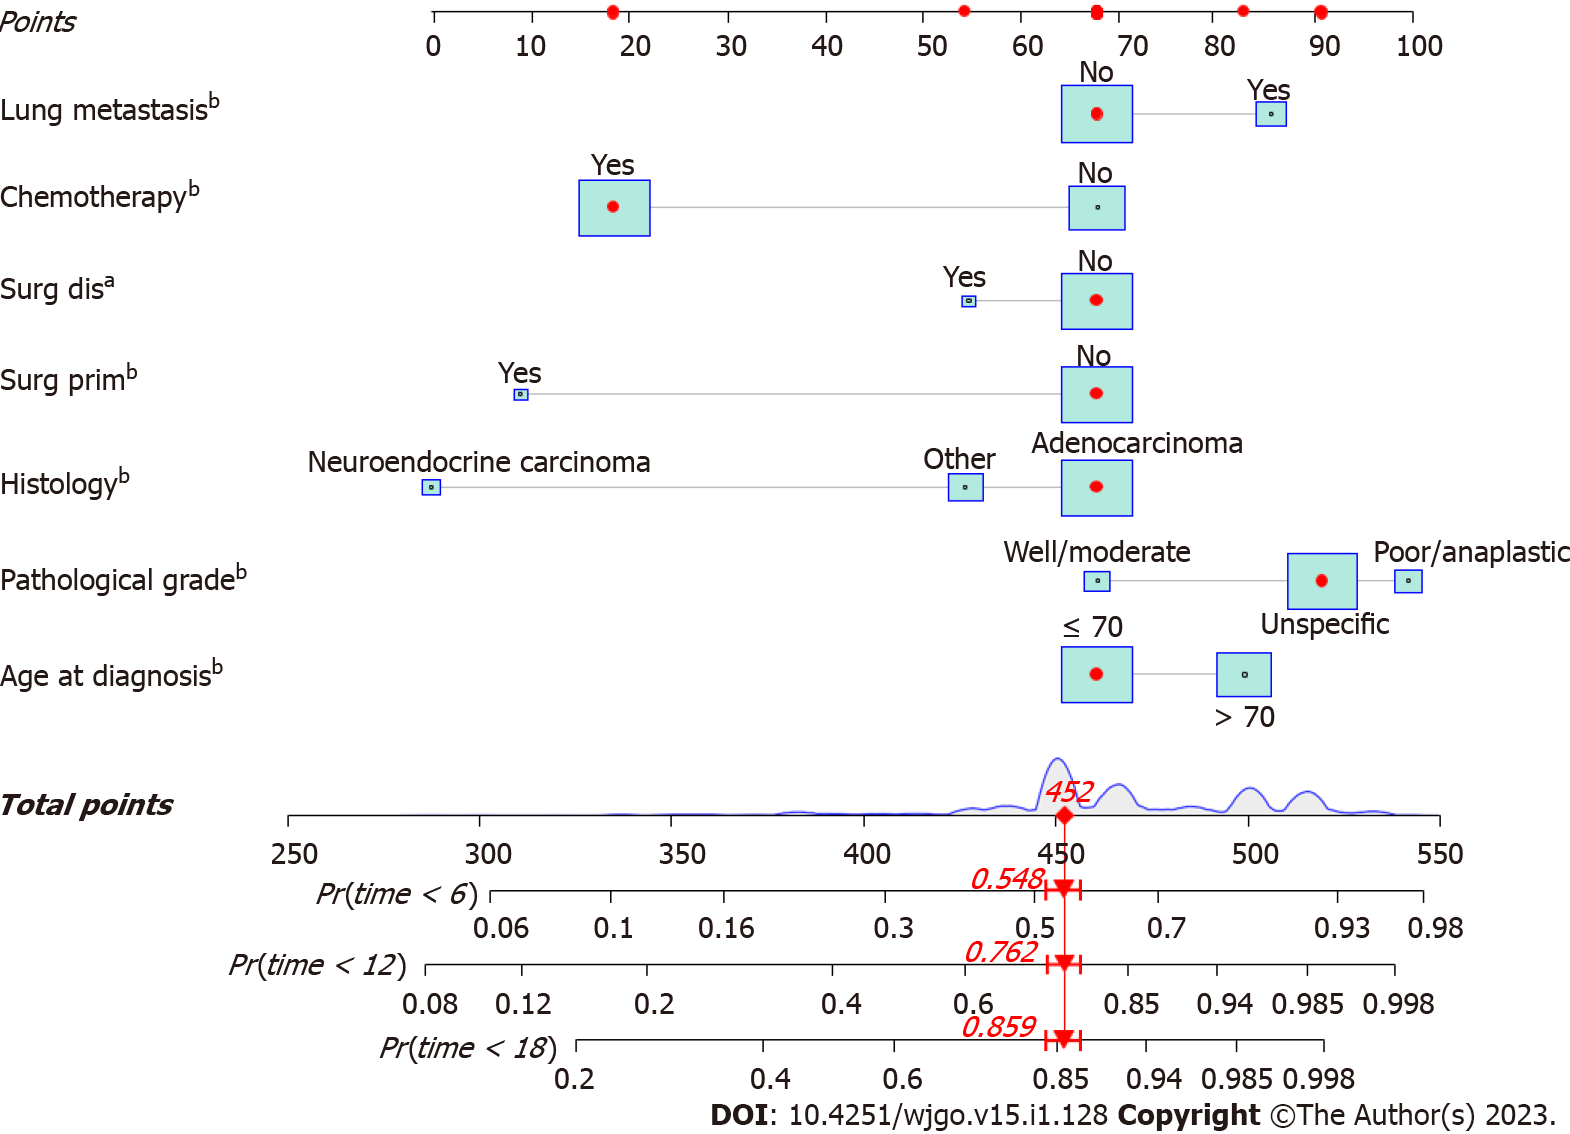
Figure 4 A prognostic nomogram for pancreatic cancer patients with liver metastasis.
aP < 0.01; bP < 0.001. Surg prim: Surgical treatments of the primary site; Surg dis: Surgical treatments of the distant site.
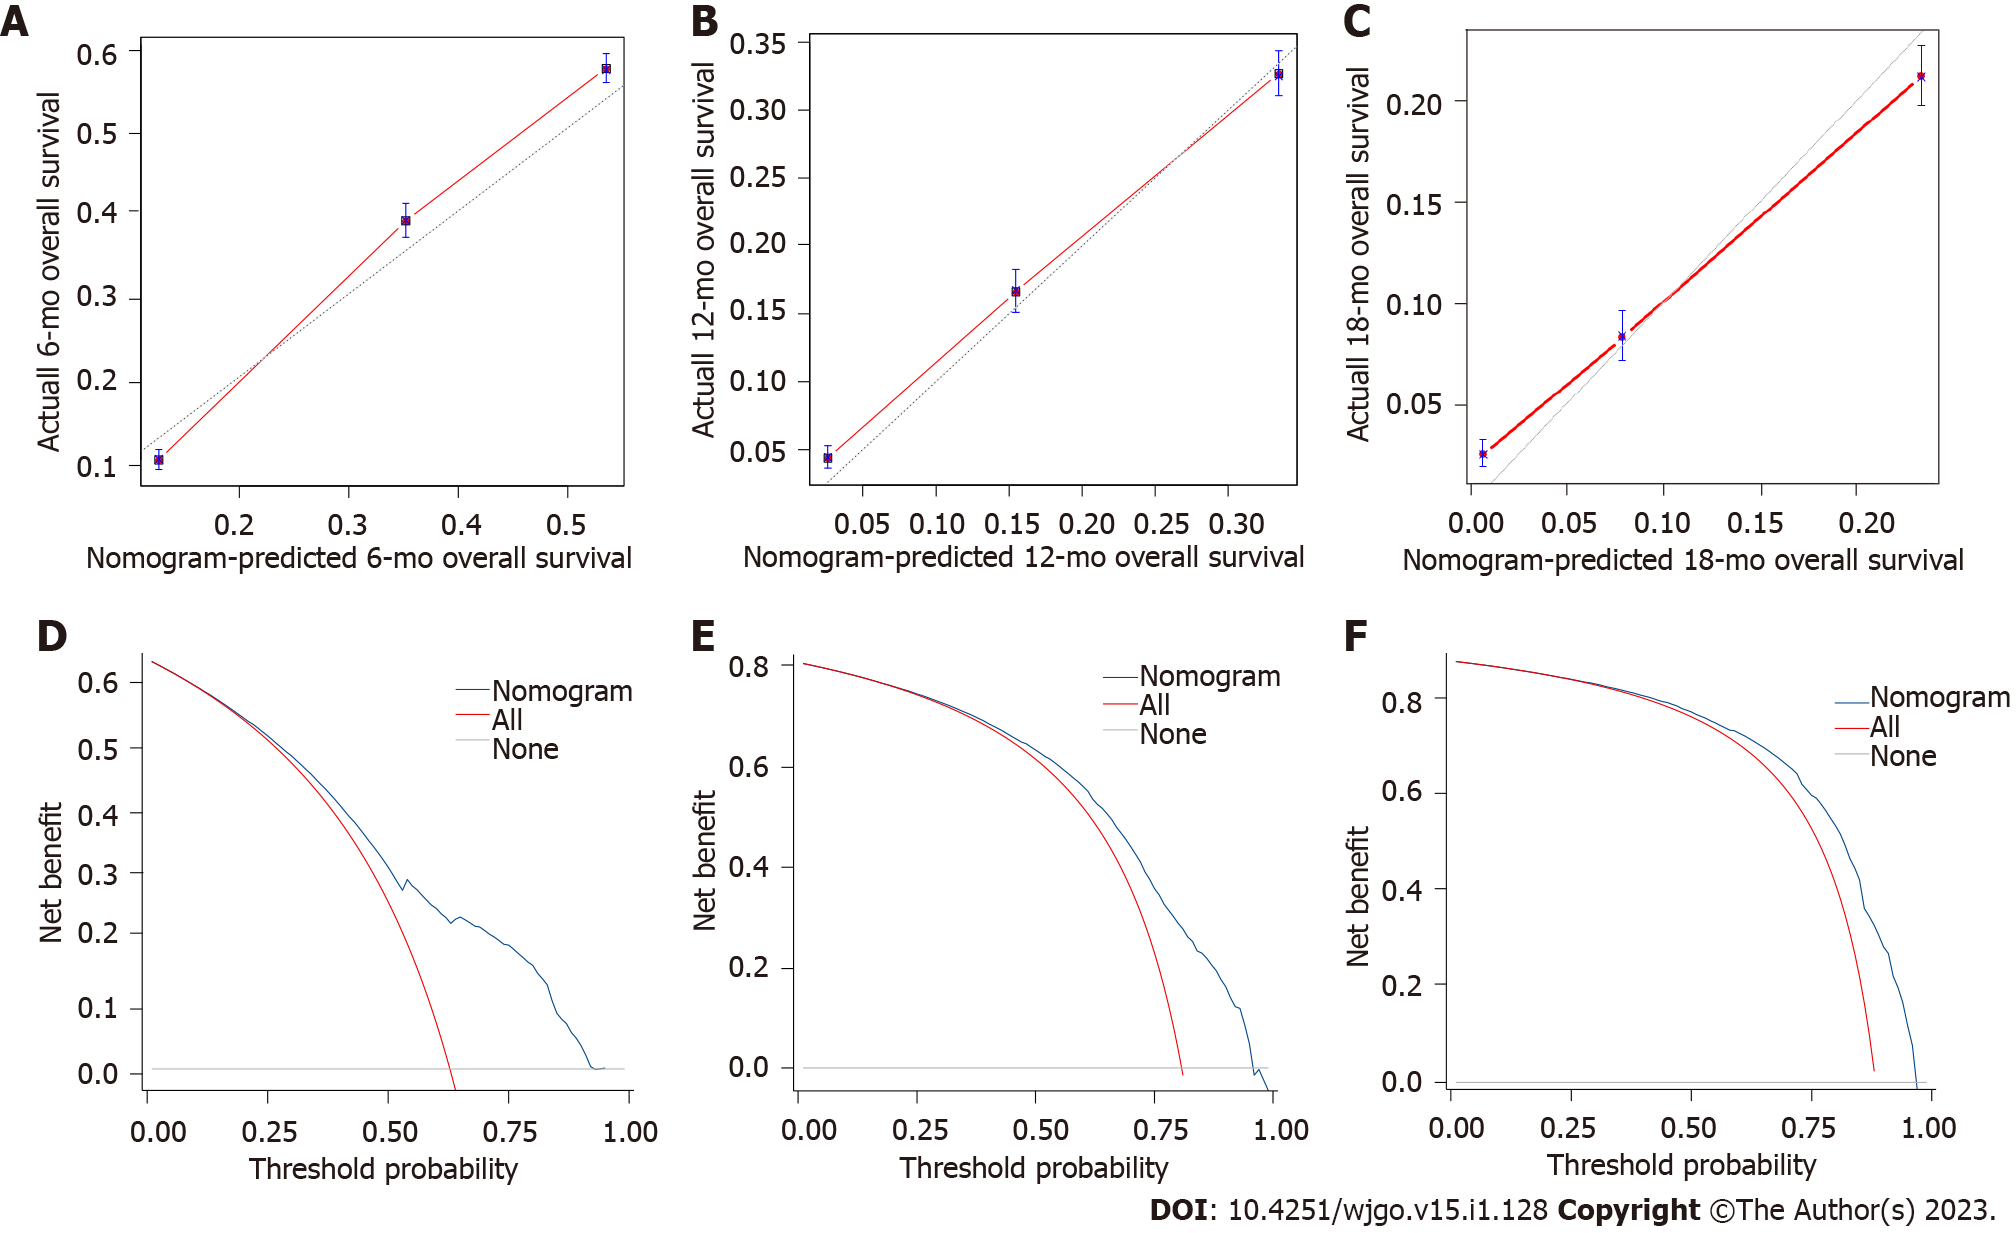
Figure 5 The calibration curves and decision curve analysis of the prognostic nomogram in the training set.
A: The calibration curve of the nomogram for 6 mo in the training set; B: The calibration curve of the nomogram for 12 mo in the training set; C: The calibration curve of the nomogram for 18 mo in the training set; D: The decision curve analysis of the nomogram for 6 mo in the training set; E: The decision curve analysis of the nomogram for 12 mo in the training set; F: The decision curve analysis of the nomogram for 18 mo in the training set.
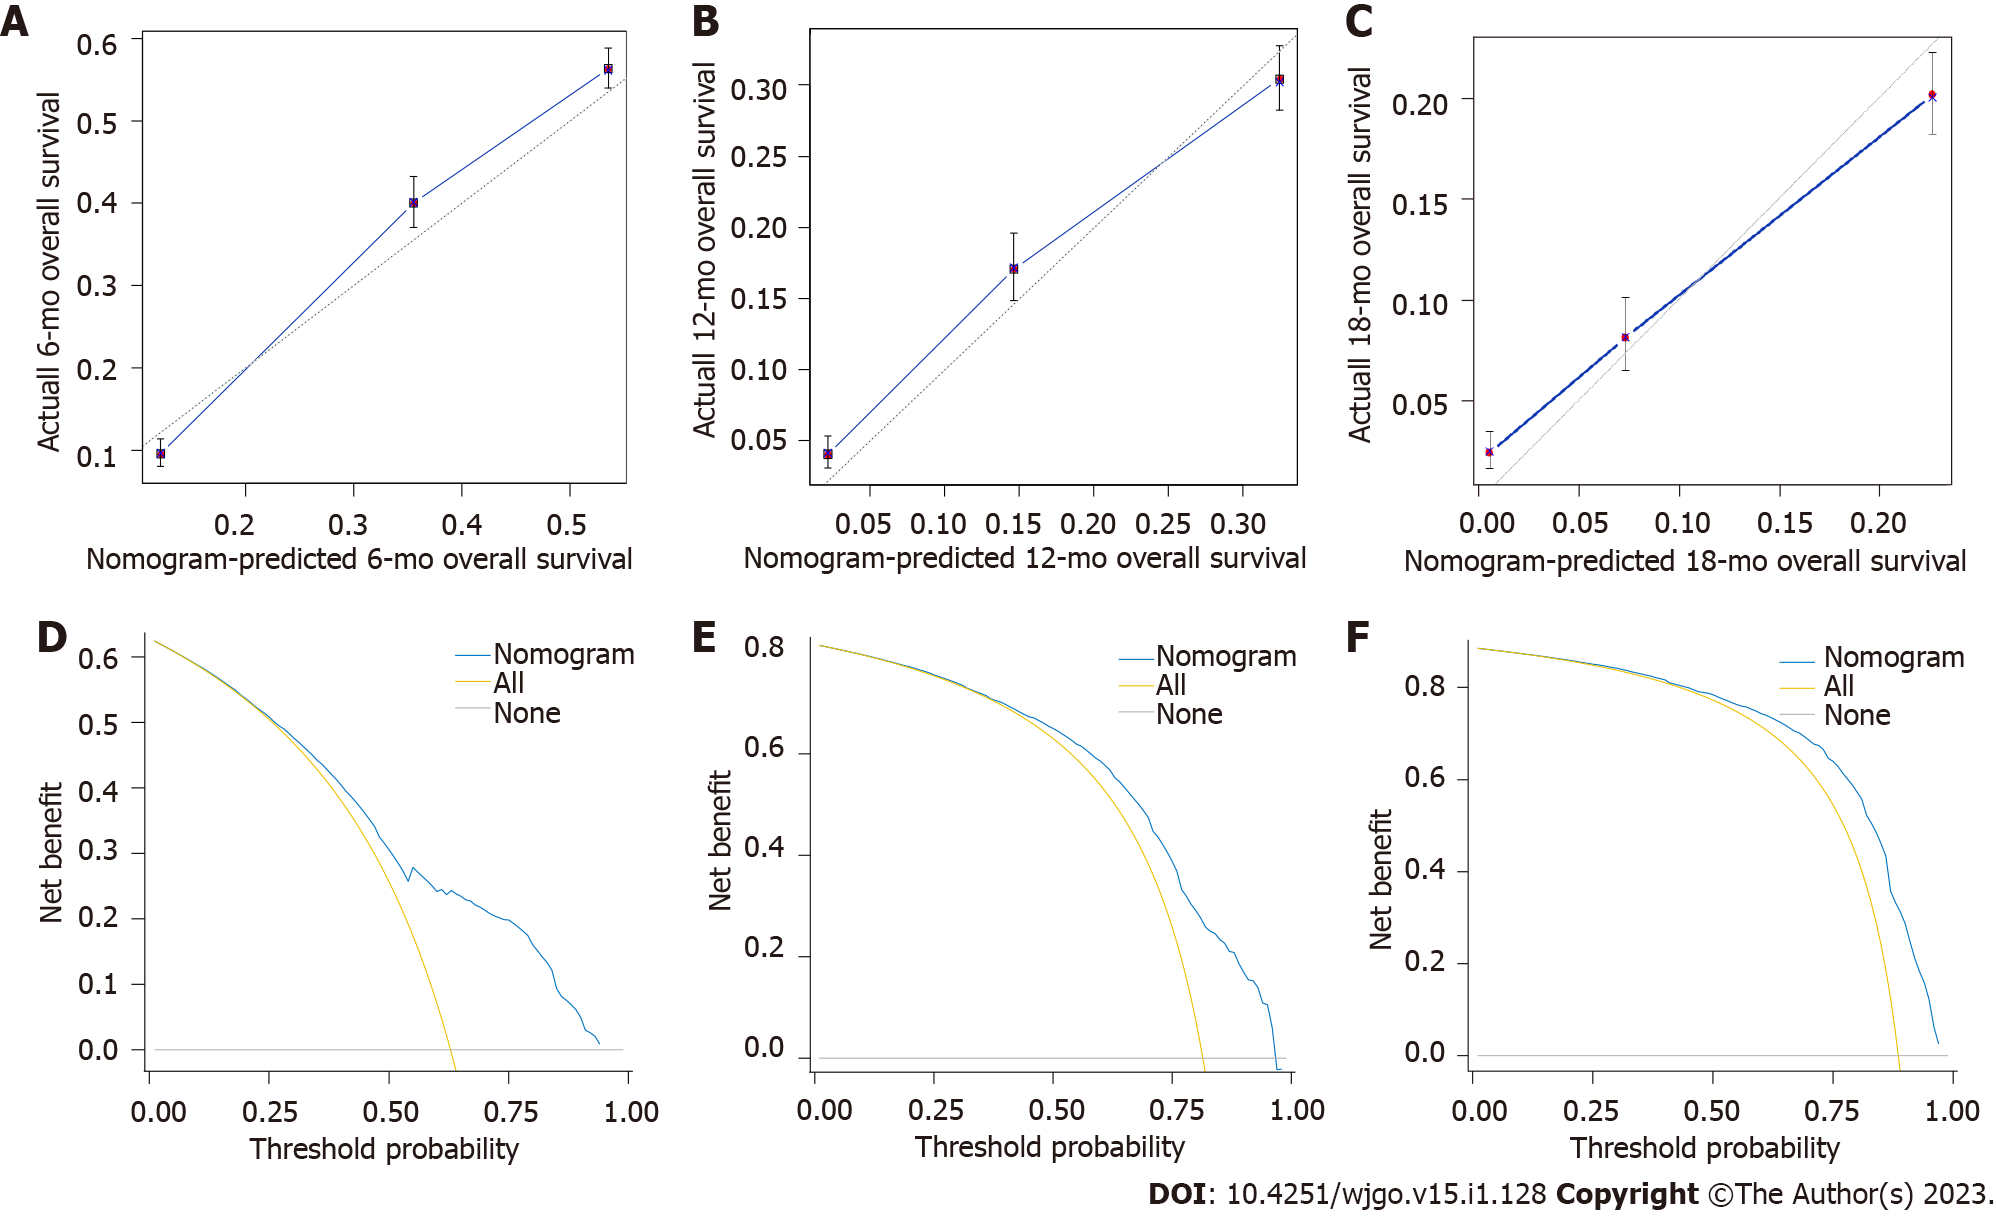
Figure 6 The calibration curves and decision curve analysis of the prognostic nomogram in the validation set.
A: The calibration curve of the nomogram for 6 mo in the validation set; B: The calibration curve of the nomogram for 12 mo in the validation set; C: The calibration curve of the nomogram for 18 mo in the validation set; D: The decision curve analysis of the nomogram for 6 mo in the validation set; E: The decision curve analysis of the nomogram for 12 mo in the validation set; F: The decision curve analysis of the nomogram for 18 mo in the validation set.
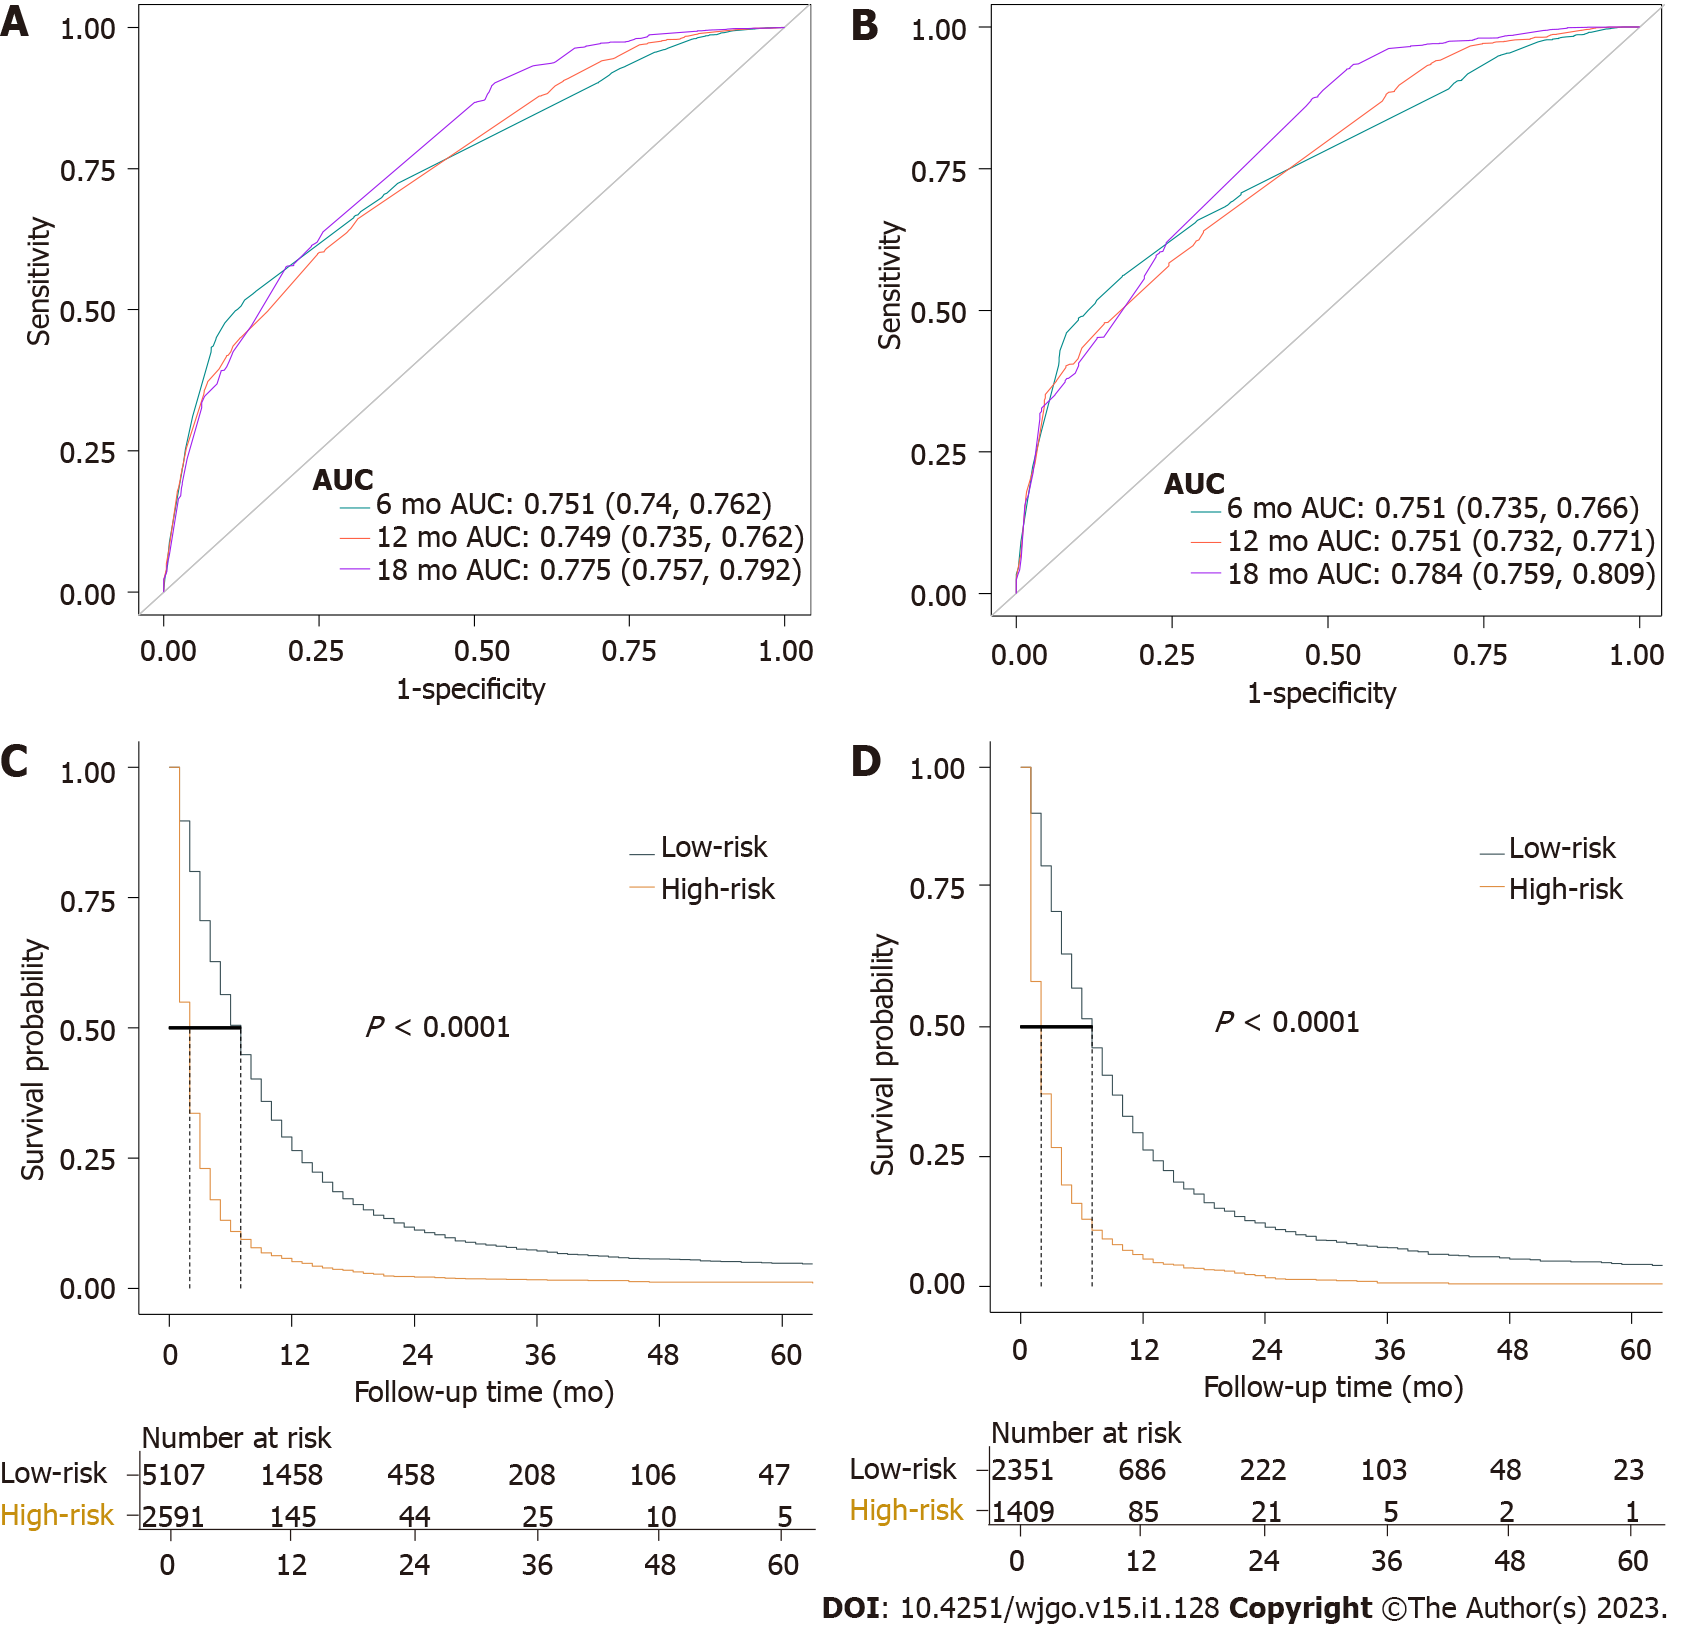
Figure 7 Time-dependent receiver operating characteristic curve analysis and Kaplan-Meier survival curves of prognostic nomogram.
A: Time-dependent receiver operating characteristic curve of the prognostic nomogram for 6, 12, and 18 mo in the training set; B: Time-dependent receiver operating characteristic curve of the prognostic nomogram for 6, 12, and 18 mo in the validation set; C: The Kaplan-Meier survival curves of the patients in the training set; D: The Kaplan-Meier survival curves of the patients in the validation set. AUC: Area under curve.
- Citation: Cao BY, Tong F, Zhang LT, Kang YX, Wu CC, Wang QQ, Yang W, Wang J. Risk factors, prognostic predictors, and nomograms for pancreatic cancer patients with initially diagnosed synchronous liver metastasis. World J Gastrointest Oncol 2023; 15(1): 128-142
- URL: https://www.wjgnet.com/1948-5204/full/v15/i1/128.htm
- DOI: https://dx.doi.org/10.4251/wjgo.v15.i1.128


