Copyright
©The Author(s) 2022.
World J Gastrointest Oncol. Sep 15, 2022; 14(9): 1844-1855
Published online Sep 15, 2022. doi: 10.4251/wjgo.v14.i9.1844
Published online Sep 15, 2022. doi: 10.4251/wjgo.v14.i9.1844
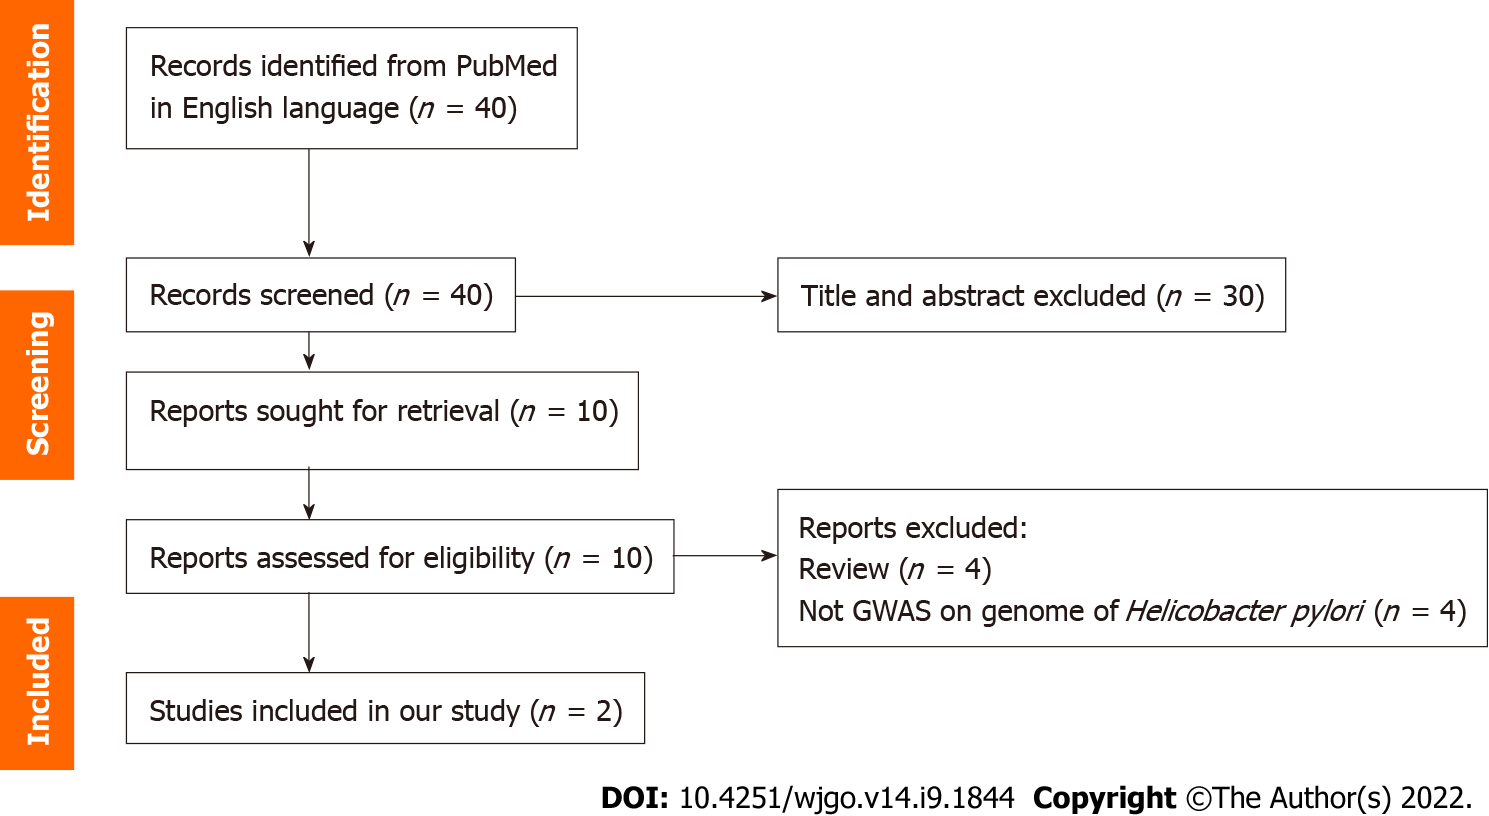
Figure 1 PRISMA flow diagram.
GWAS: Genome-wide association studies.
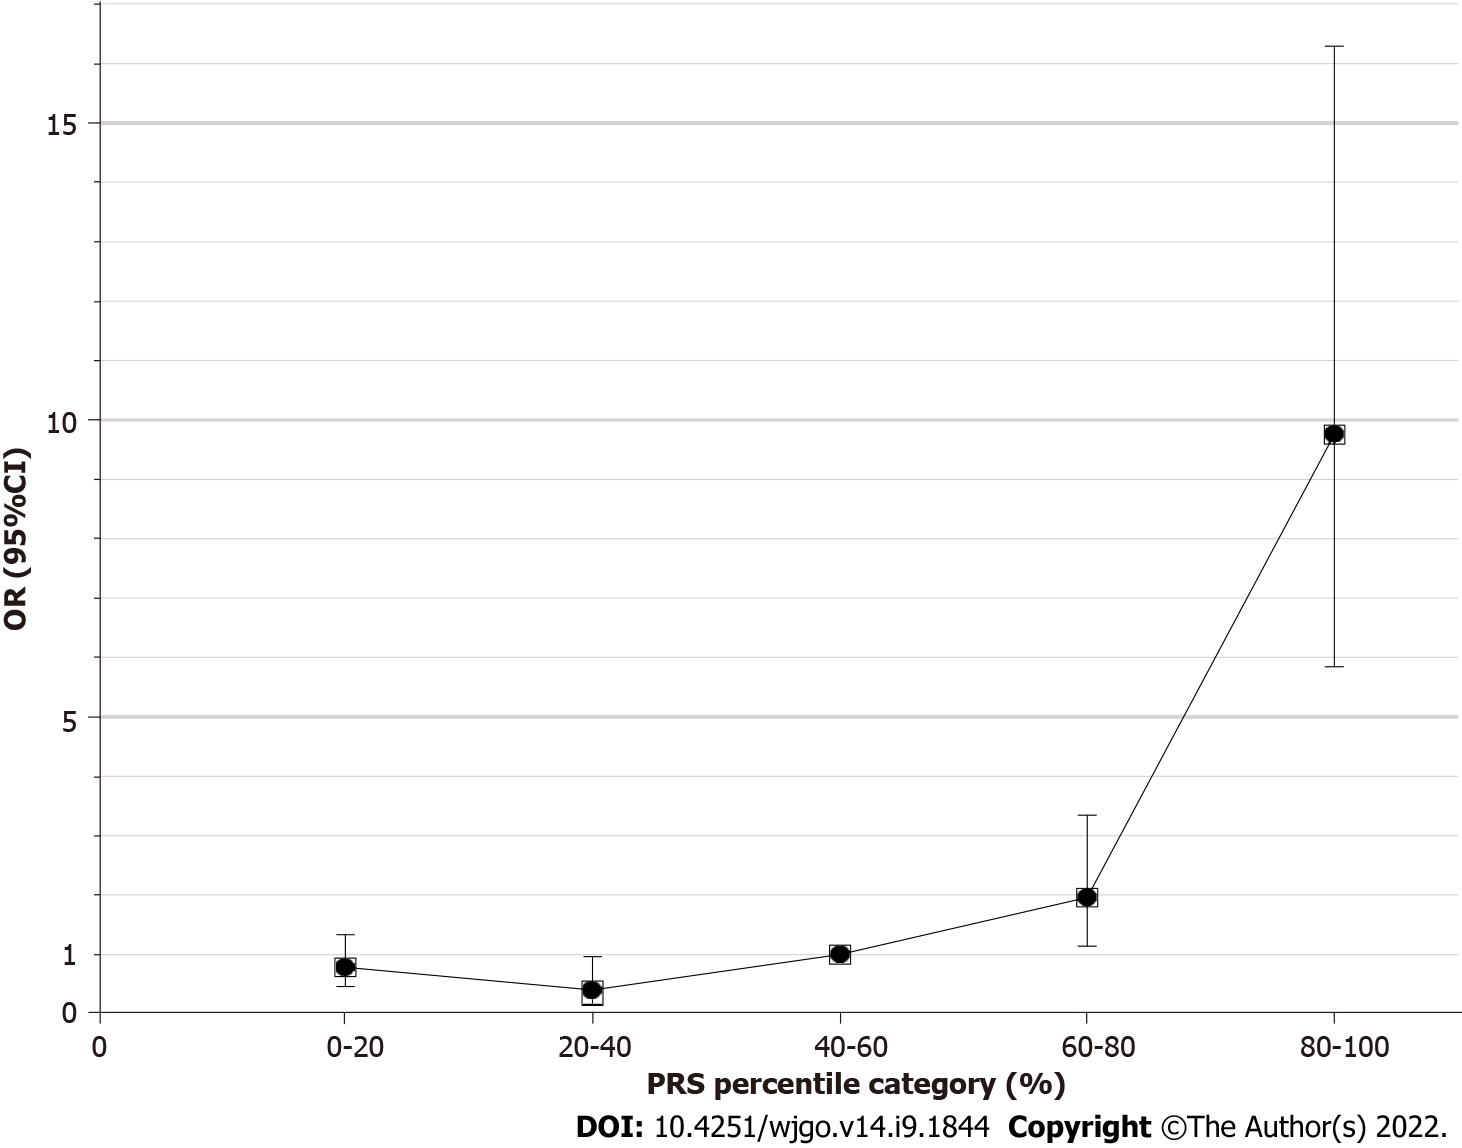
Figure 2 Odds ratio and 95% confidence intervals (error bars) for percentiles of polygenic risk relative to the middle quintile.
OR: Odds ratio; CI: Confidence interval; PRS: Polygenic risk score.
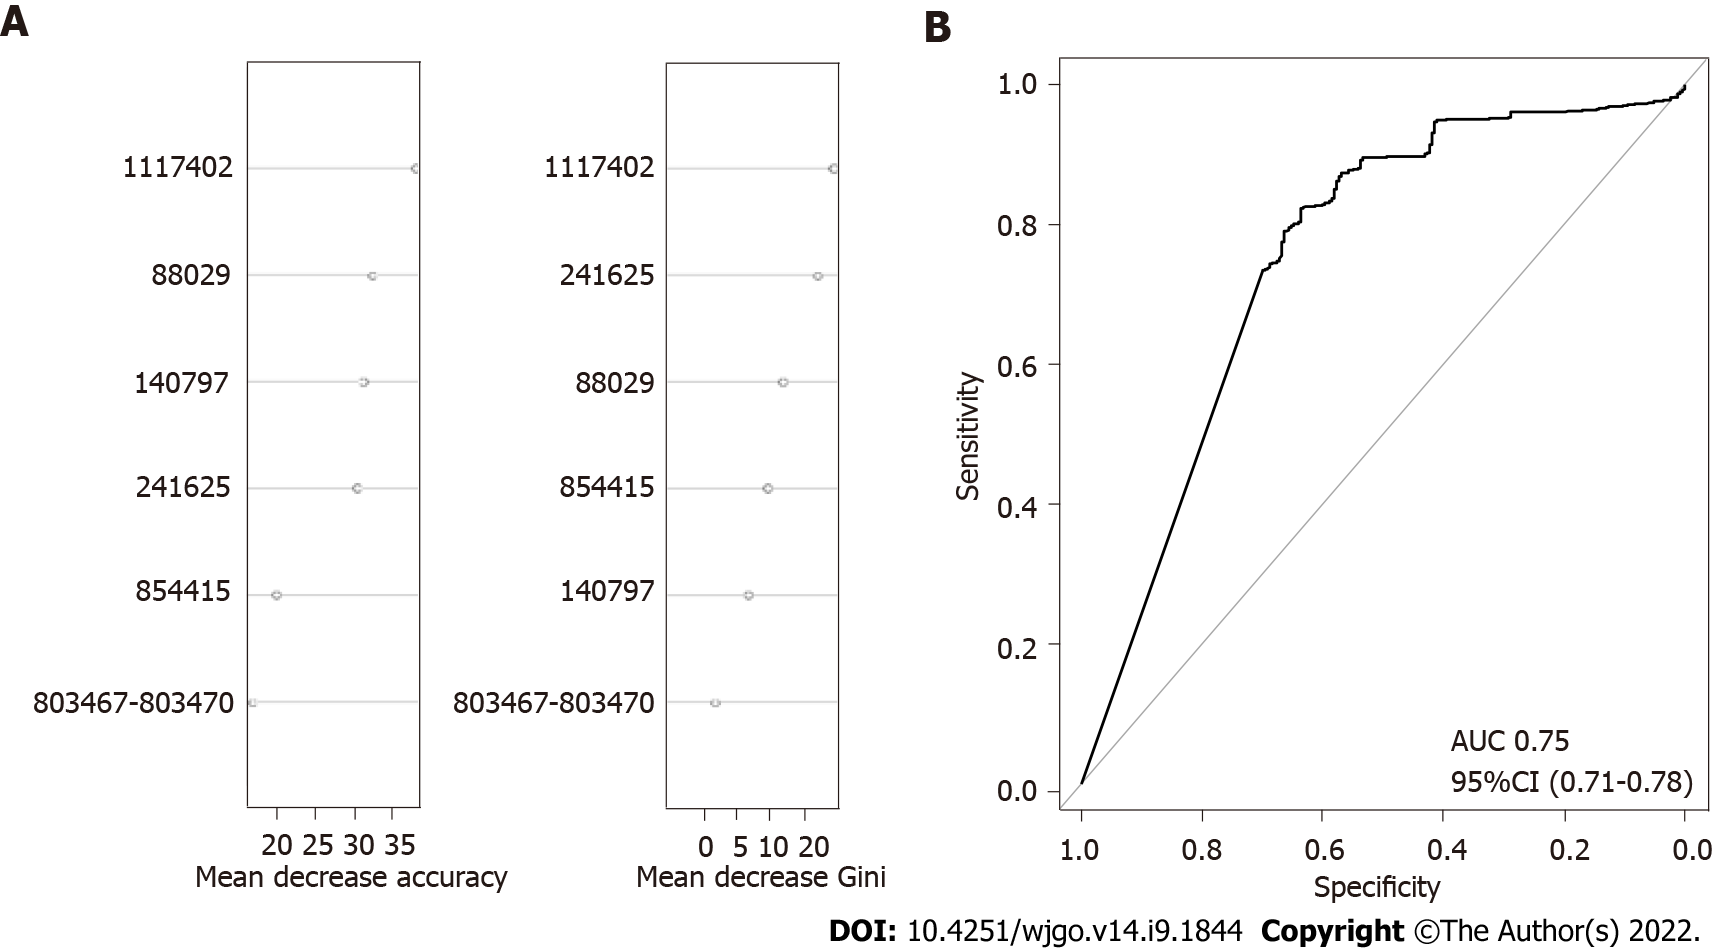
Figure 3 The importance of each validated single nucleotide polymorphisms and receiver operating characteristic curve for the polygenic risk score model on global strains.
A: The median decrease in accuracy and median decrease in Gini coefficient of validated single nucleotide polymorphisms; B: Receiver operating characteristic curve of global strains. AUC: Area under the curve; CI: Confidence interval.
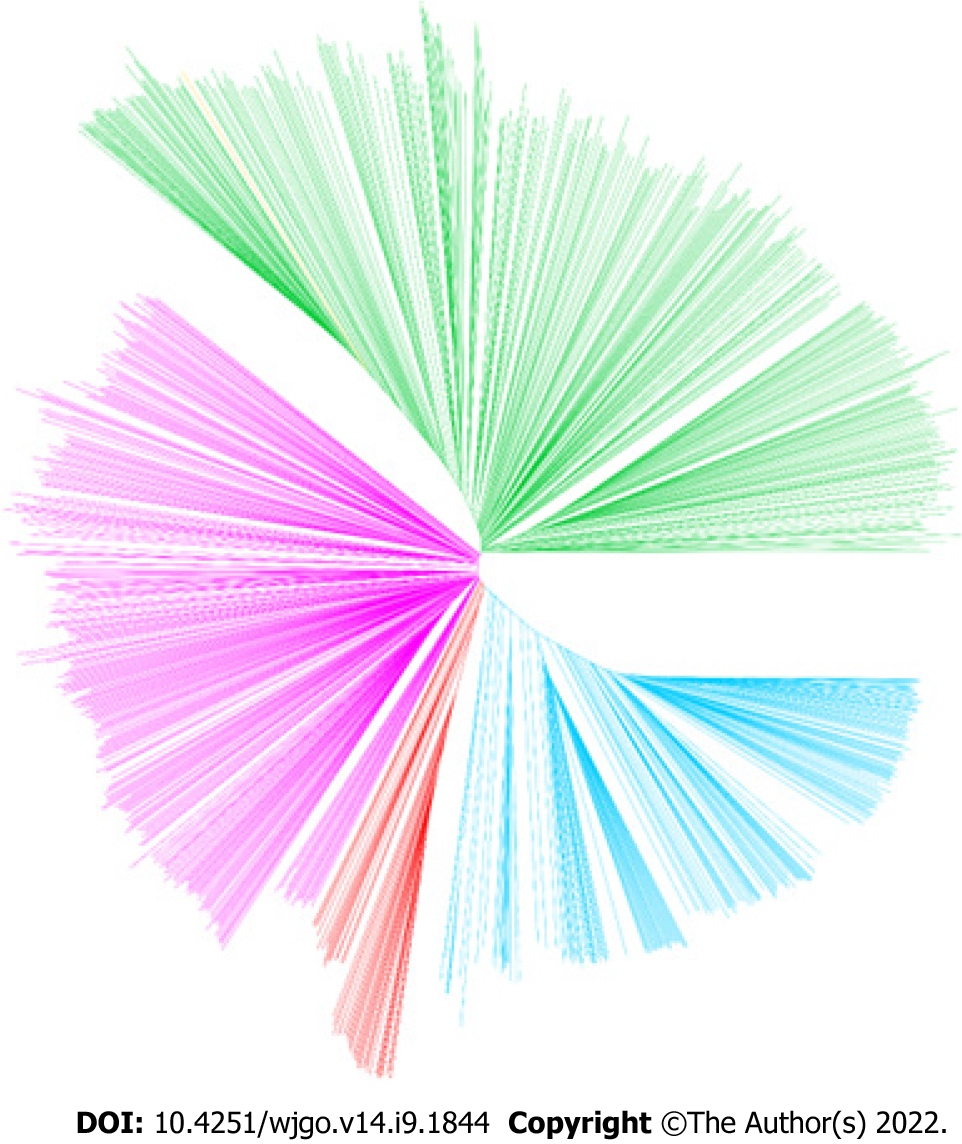
Figure 4 Neighbour-joining tree constructed from concatenated single nucleotide polymorphism sequences.
Blue: hpEastAsia; Red: hpAsia2; Pink: hpEurope; Green: America-related populations; Yellow: Africa-related populations (strain hp_151, which was isolated in Morocco, was excluded from further analyses).
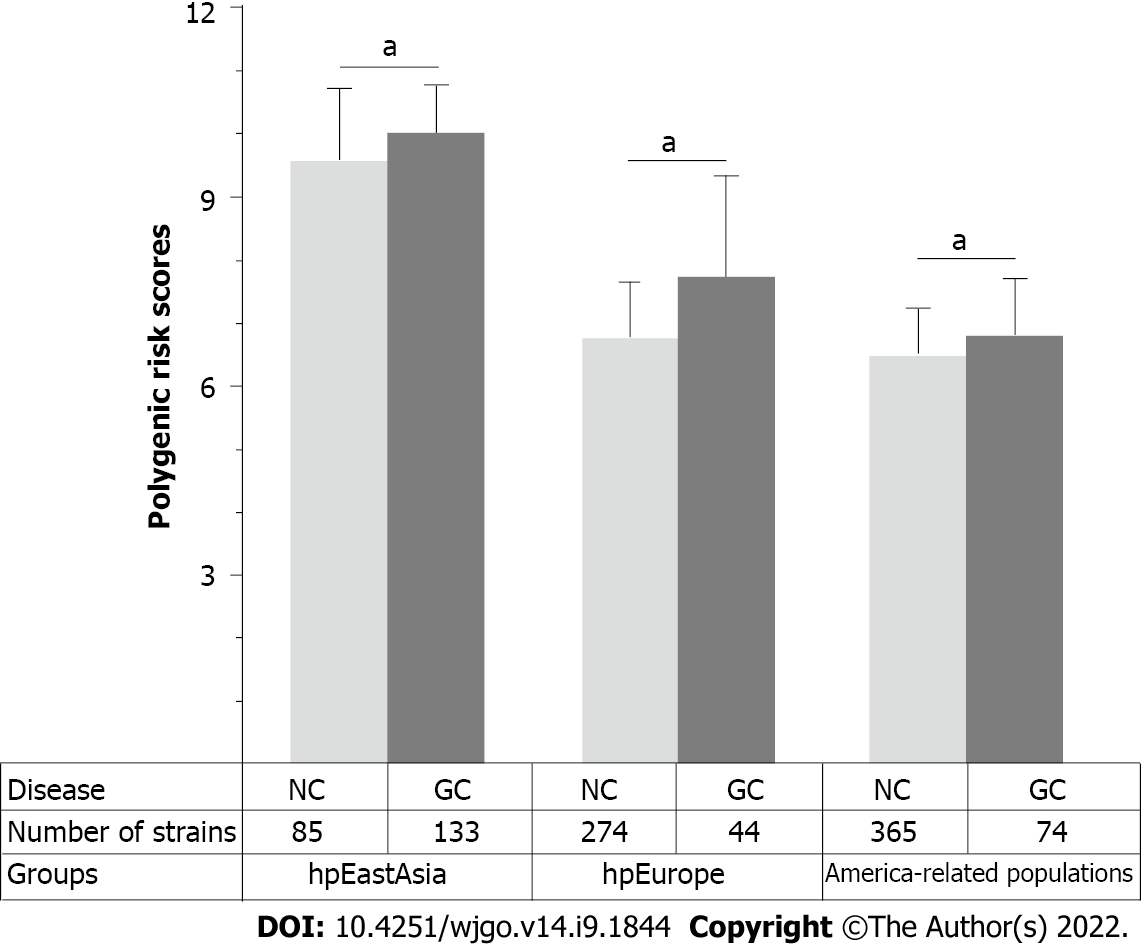
Figure 5 Distribution of polygenic risk score for various groups.
NC: Non-gastric cancer; GC: Gastric cancer. aP < 0.05.
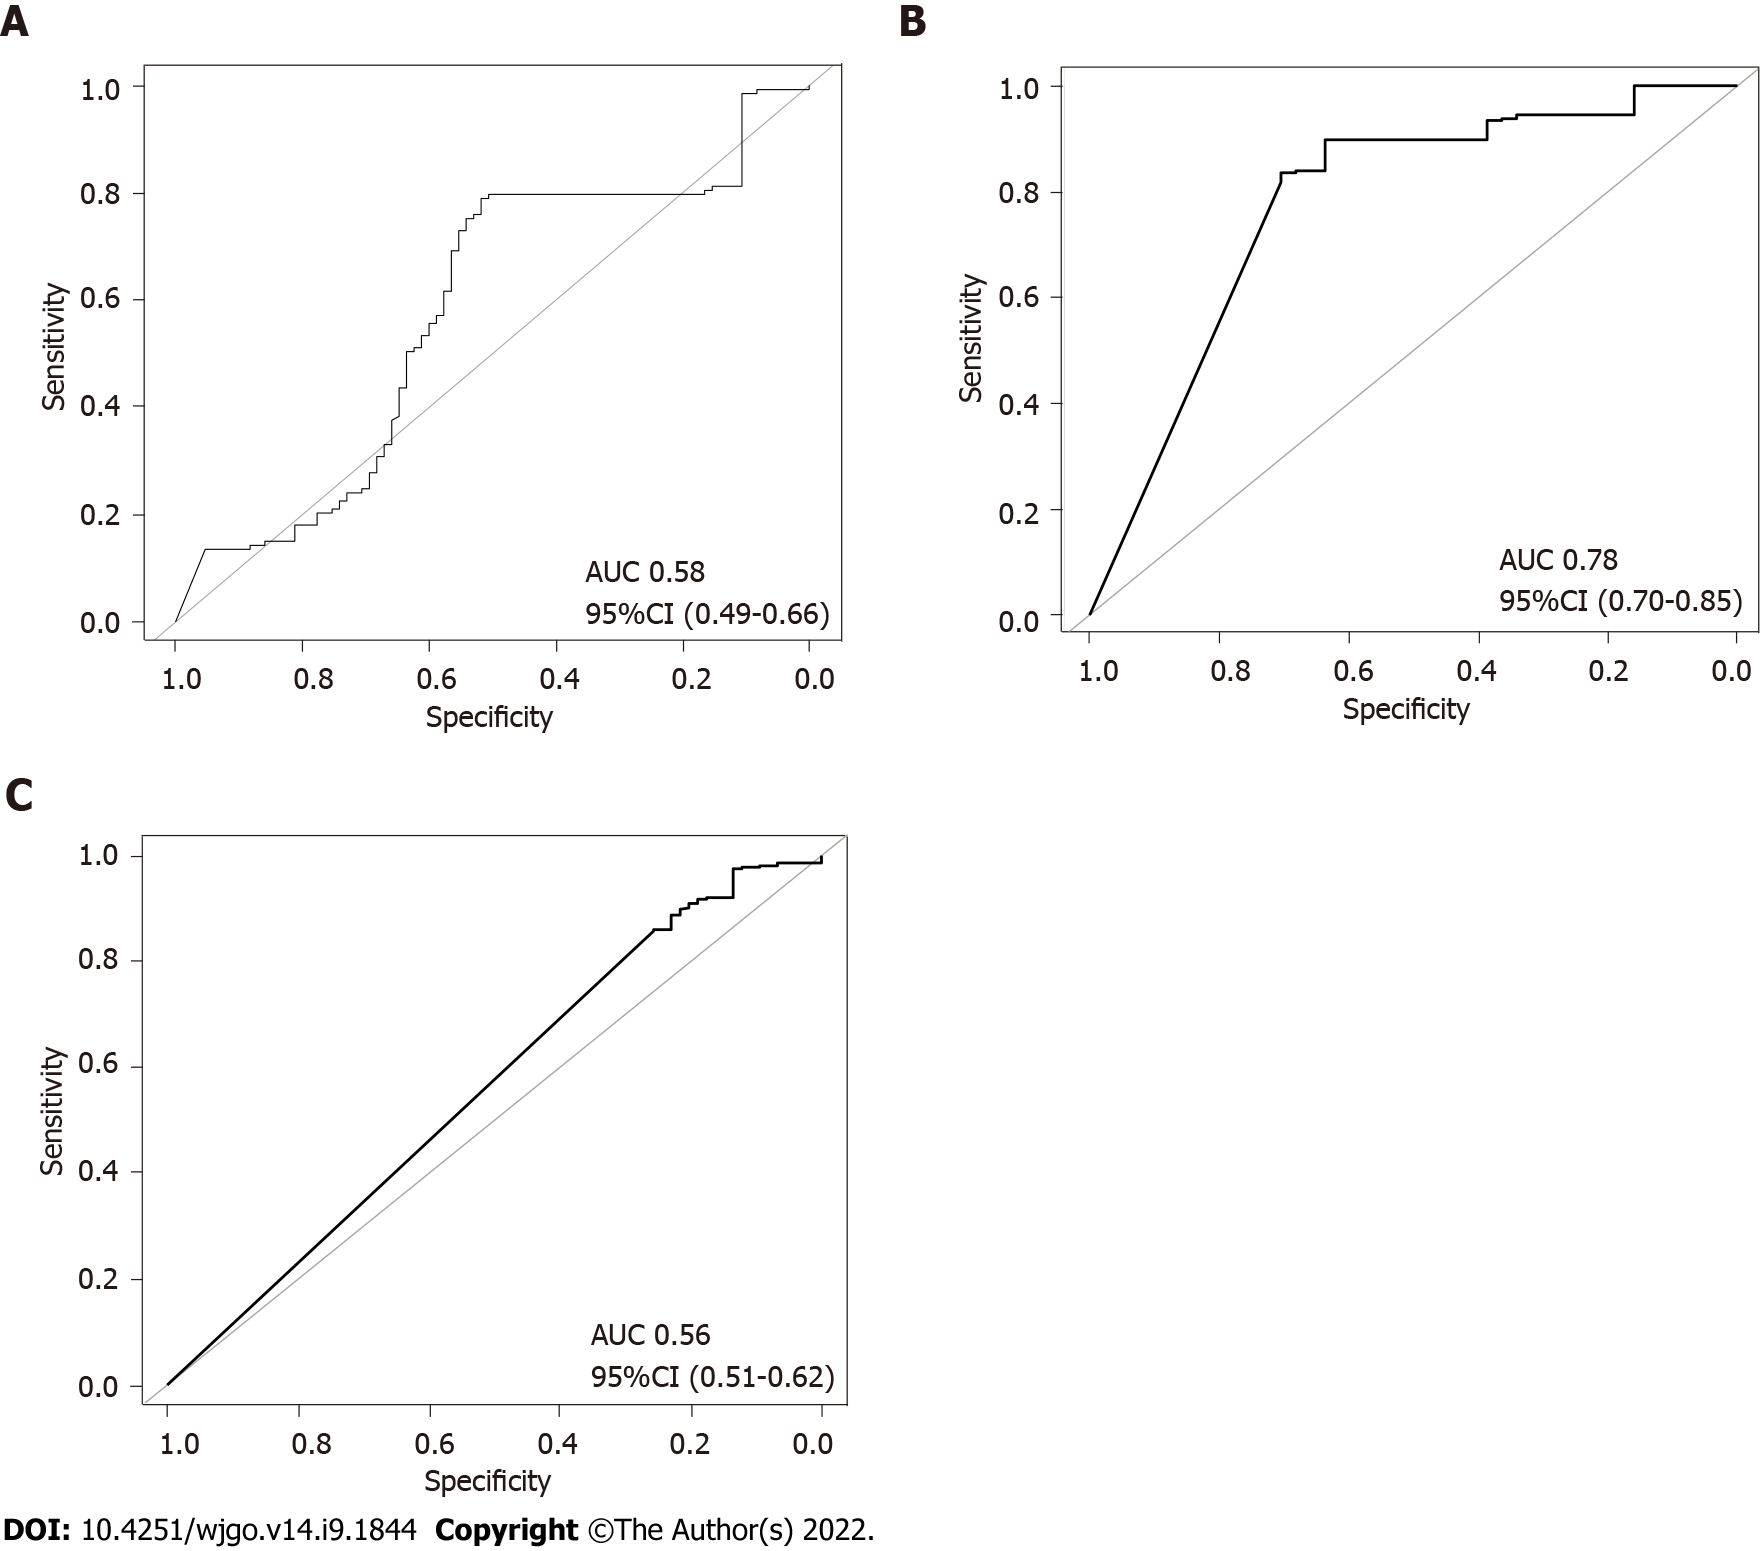
Figure 6 Receiver operating characteristic curve of the polygenic risk score model for various groups.
A: Receiver operating characteristic curve (ROC) of hpEastAsia; B: ROC curve of hpEurope; C: ROC curve of America-related populations. AUC: Area under the curve; CI: Confidence interval.
- Citation: Wang XY, Wang LL, Liang SZ, Yang C, Xu L, Yu MC, Wang YX, Dong QJ. Prediction of gastric cancer risk by a polygenic risk score of Helicobacter pylori. World J Gastrointest Oncol 2022; 14(9): 1844-1855
- URL: https://www.wjgnet.com/1948-5204/full/v14/i9/1844.htm
- DOI: https://dx.doi.org/10.4251/wjgo.v14.i9.1844


