Copyright
©The Author(s) 2022.
World J Gastrointest Oncol. Sep 15, 2022; 14(9): 1711-1726
Published online Sep 15, 2022. doi: 10.4251/wjgo.v14.i9.1711
Published online Sep 15, 2022. doi: 10.4251/wjgo.v14.i9.1711
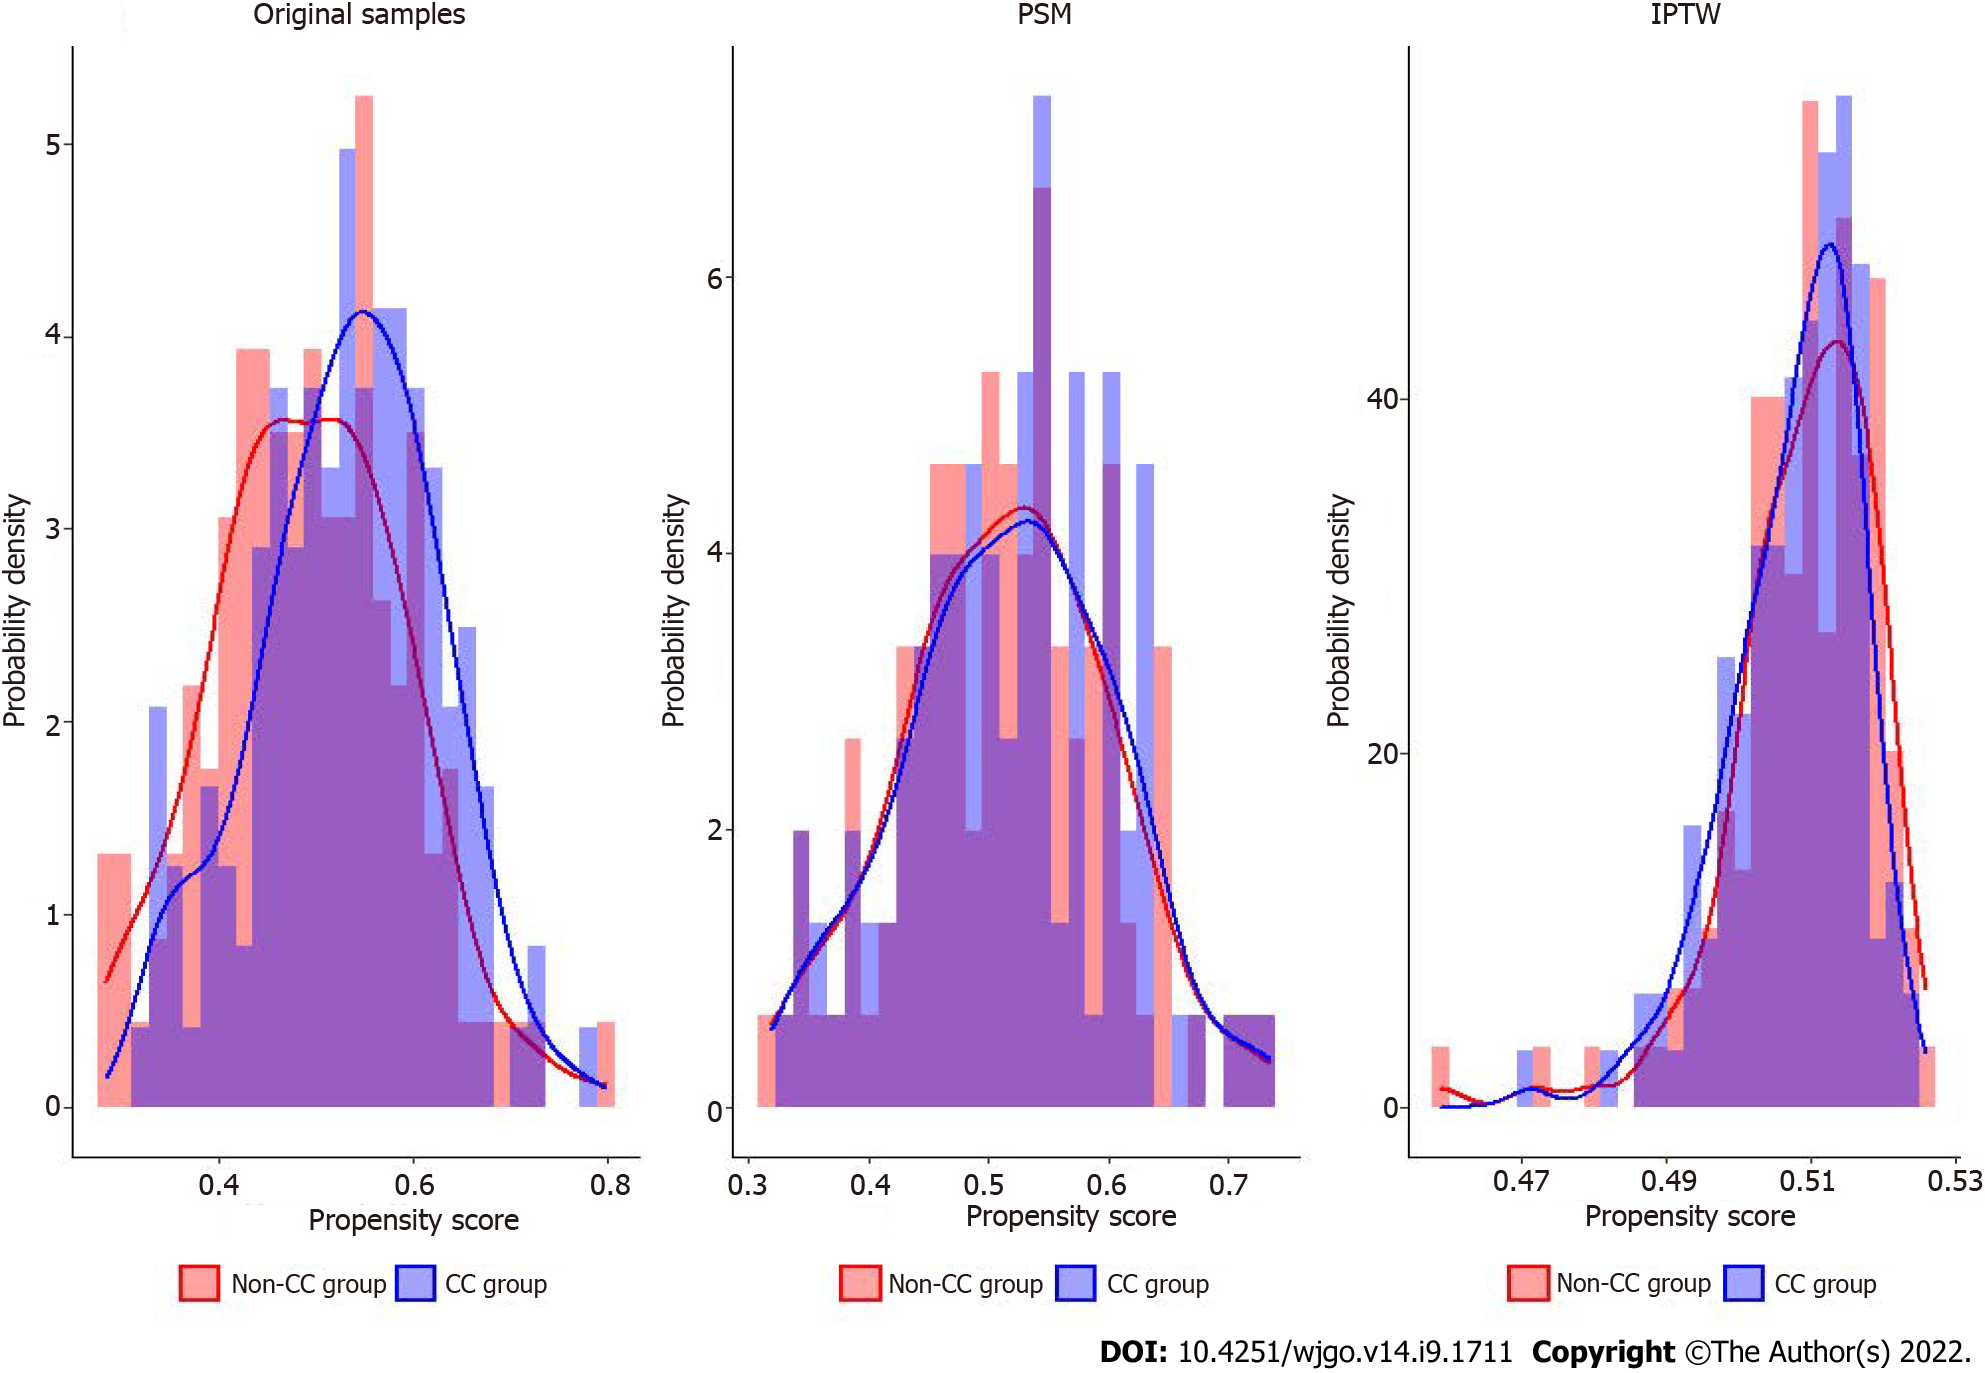
Figure 1 Histograms and density graphs description comparisons of the original, propensity score match and inverse probability of treatment weighting distributions in the consolidation chemotherapy and non-consolidation chemotherapy groups.
PSM: Propensity score match; IPTW: Inverse probability of treatment weighting; CC: Consolidation chemotherapy.
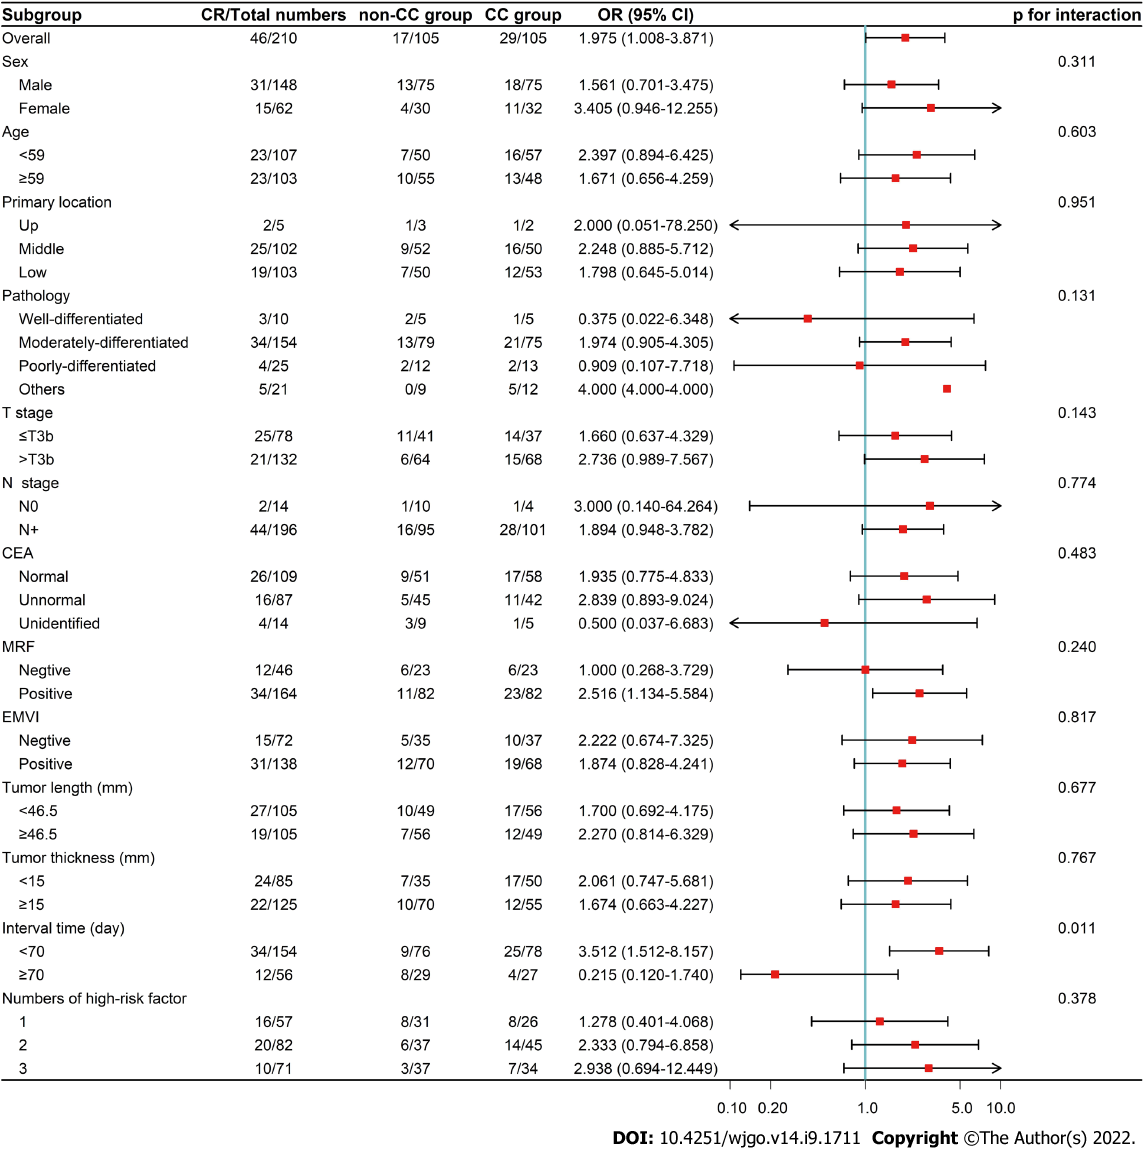
Figure 2 Forest plot of the subgroup analysis for complete response rate in the propensity score match cohort.
Odds rate (OR) > 1 favors consolidation chemotherapy (CC) group, and OR < 1 favors non-CC group. CR: complete response; PSM: Propensity score match; CC: Consolidation chemotherapy; OR: Odds rate; CI: Confident interval; CEA: Carcinoma embryonic antigen; MRF: Mesorectal fascia; EMVI: Extralmural venous invasion.
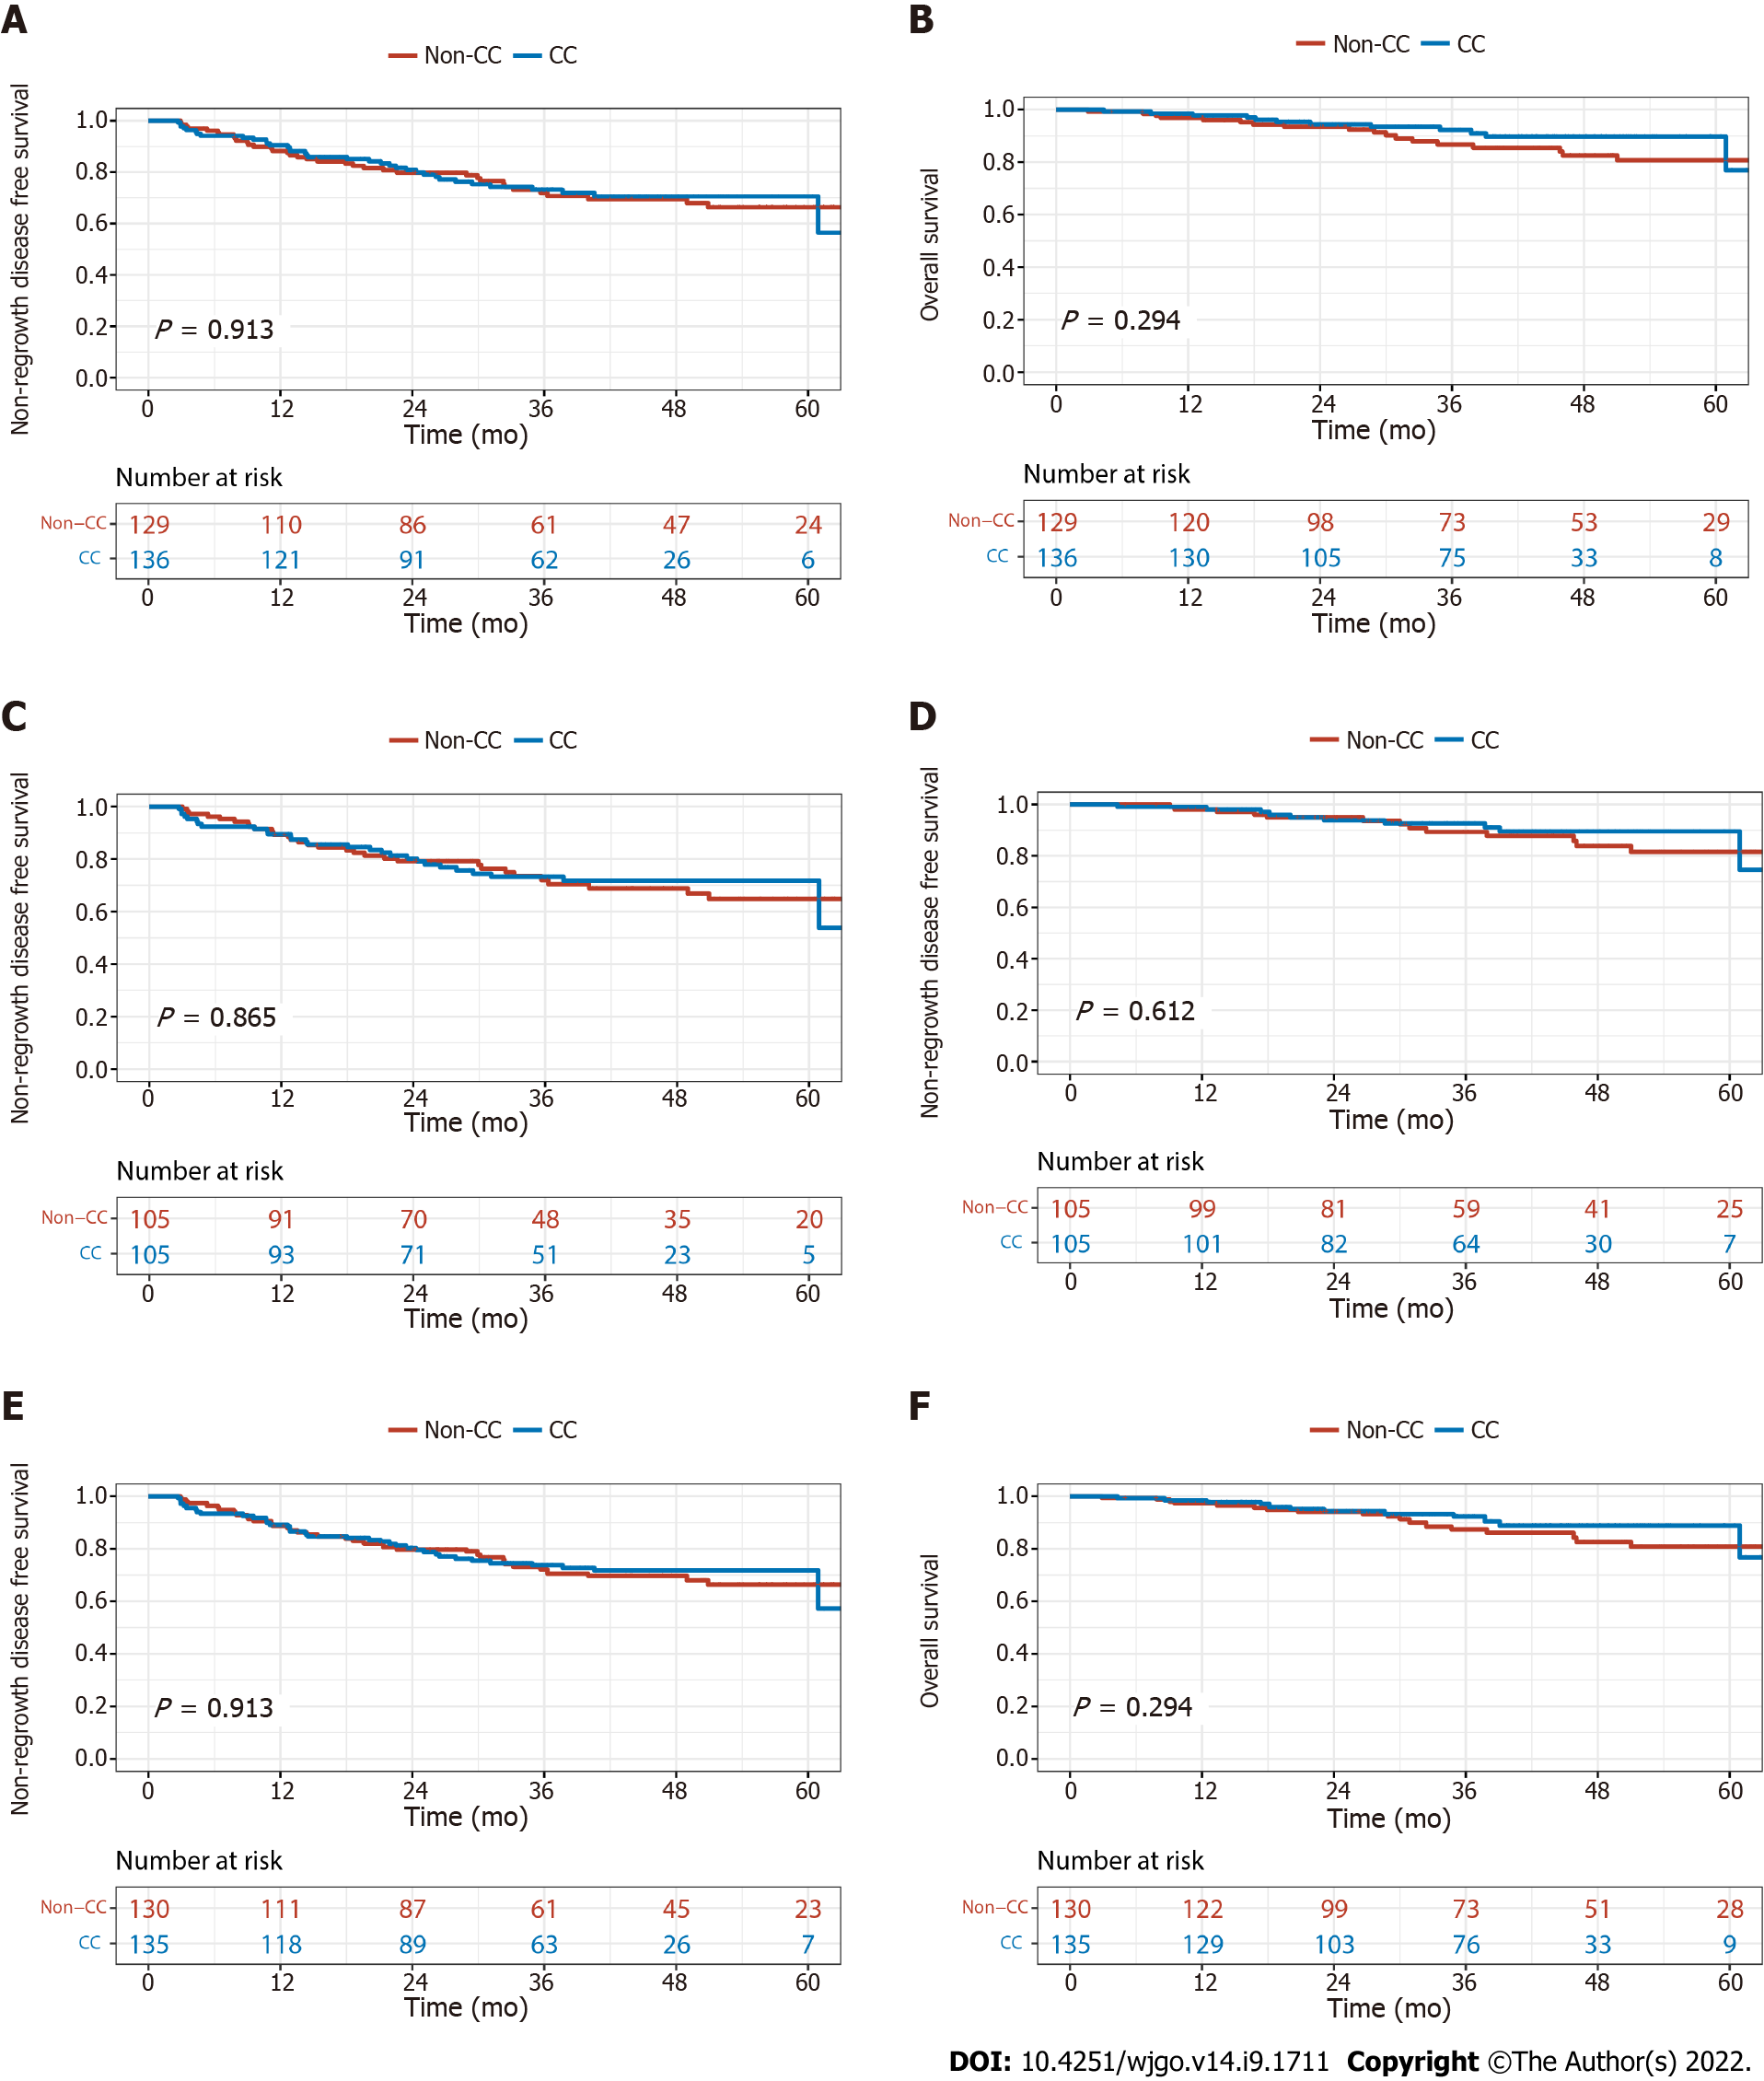
Figure 3 Non-regrowth disease free survival and overall survival of consolidation chemotherapy and non-consolidation chemotherapy groups.
A: Non-regrowth disease free survival (NR-DFS) before matching; B: Overall survival (OS) before matching; C: NR-DFS after propensity score match (PSM); D: OS after PSM; E: NR-DFS after inverse probability of treatment weighting (IPTW); F: OS after IPTW. CC: Consolidation chemotherapy.
- Citation: Sheng XQ, Wang HZ, Li S, Zhang YZ, Geng JH, Zhu XG, Quan JZ, Li YH, Cai Y, Wang WH. Consolidation chemotherapy with capecitabine after neoadjuvant chemoradiotherapy in high-risk patients with locally advanced rectal cancer: Propensity score study. World J Gastrointest Oncol 2022; 14(9): 1711-1726
- URL: https://www.wjgnet.com/1948-5204/full/v14/i9/1711.htm
- DOI: https://dx.doi.org/10.4251/wjgo.v14.i9.1711


