Copyright
©The Author(s) 2022.
World J Gastrointest Oncol. Aug 15, 2022; 14(8): 1540-1551
Published online Aug 15, 2022. doi: 10.4251/wjgo.v14.i8.1540
Published online Aug 15, 2022. doi: 10.4251/wjgo.v14.i8.1540
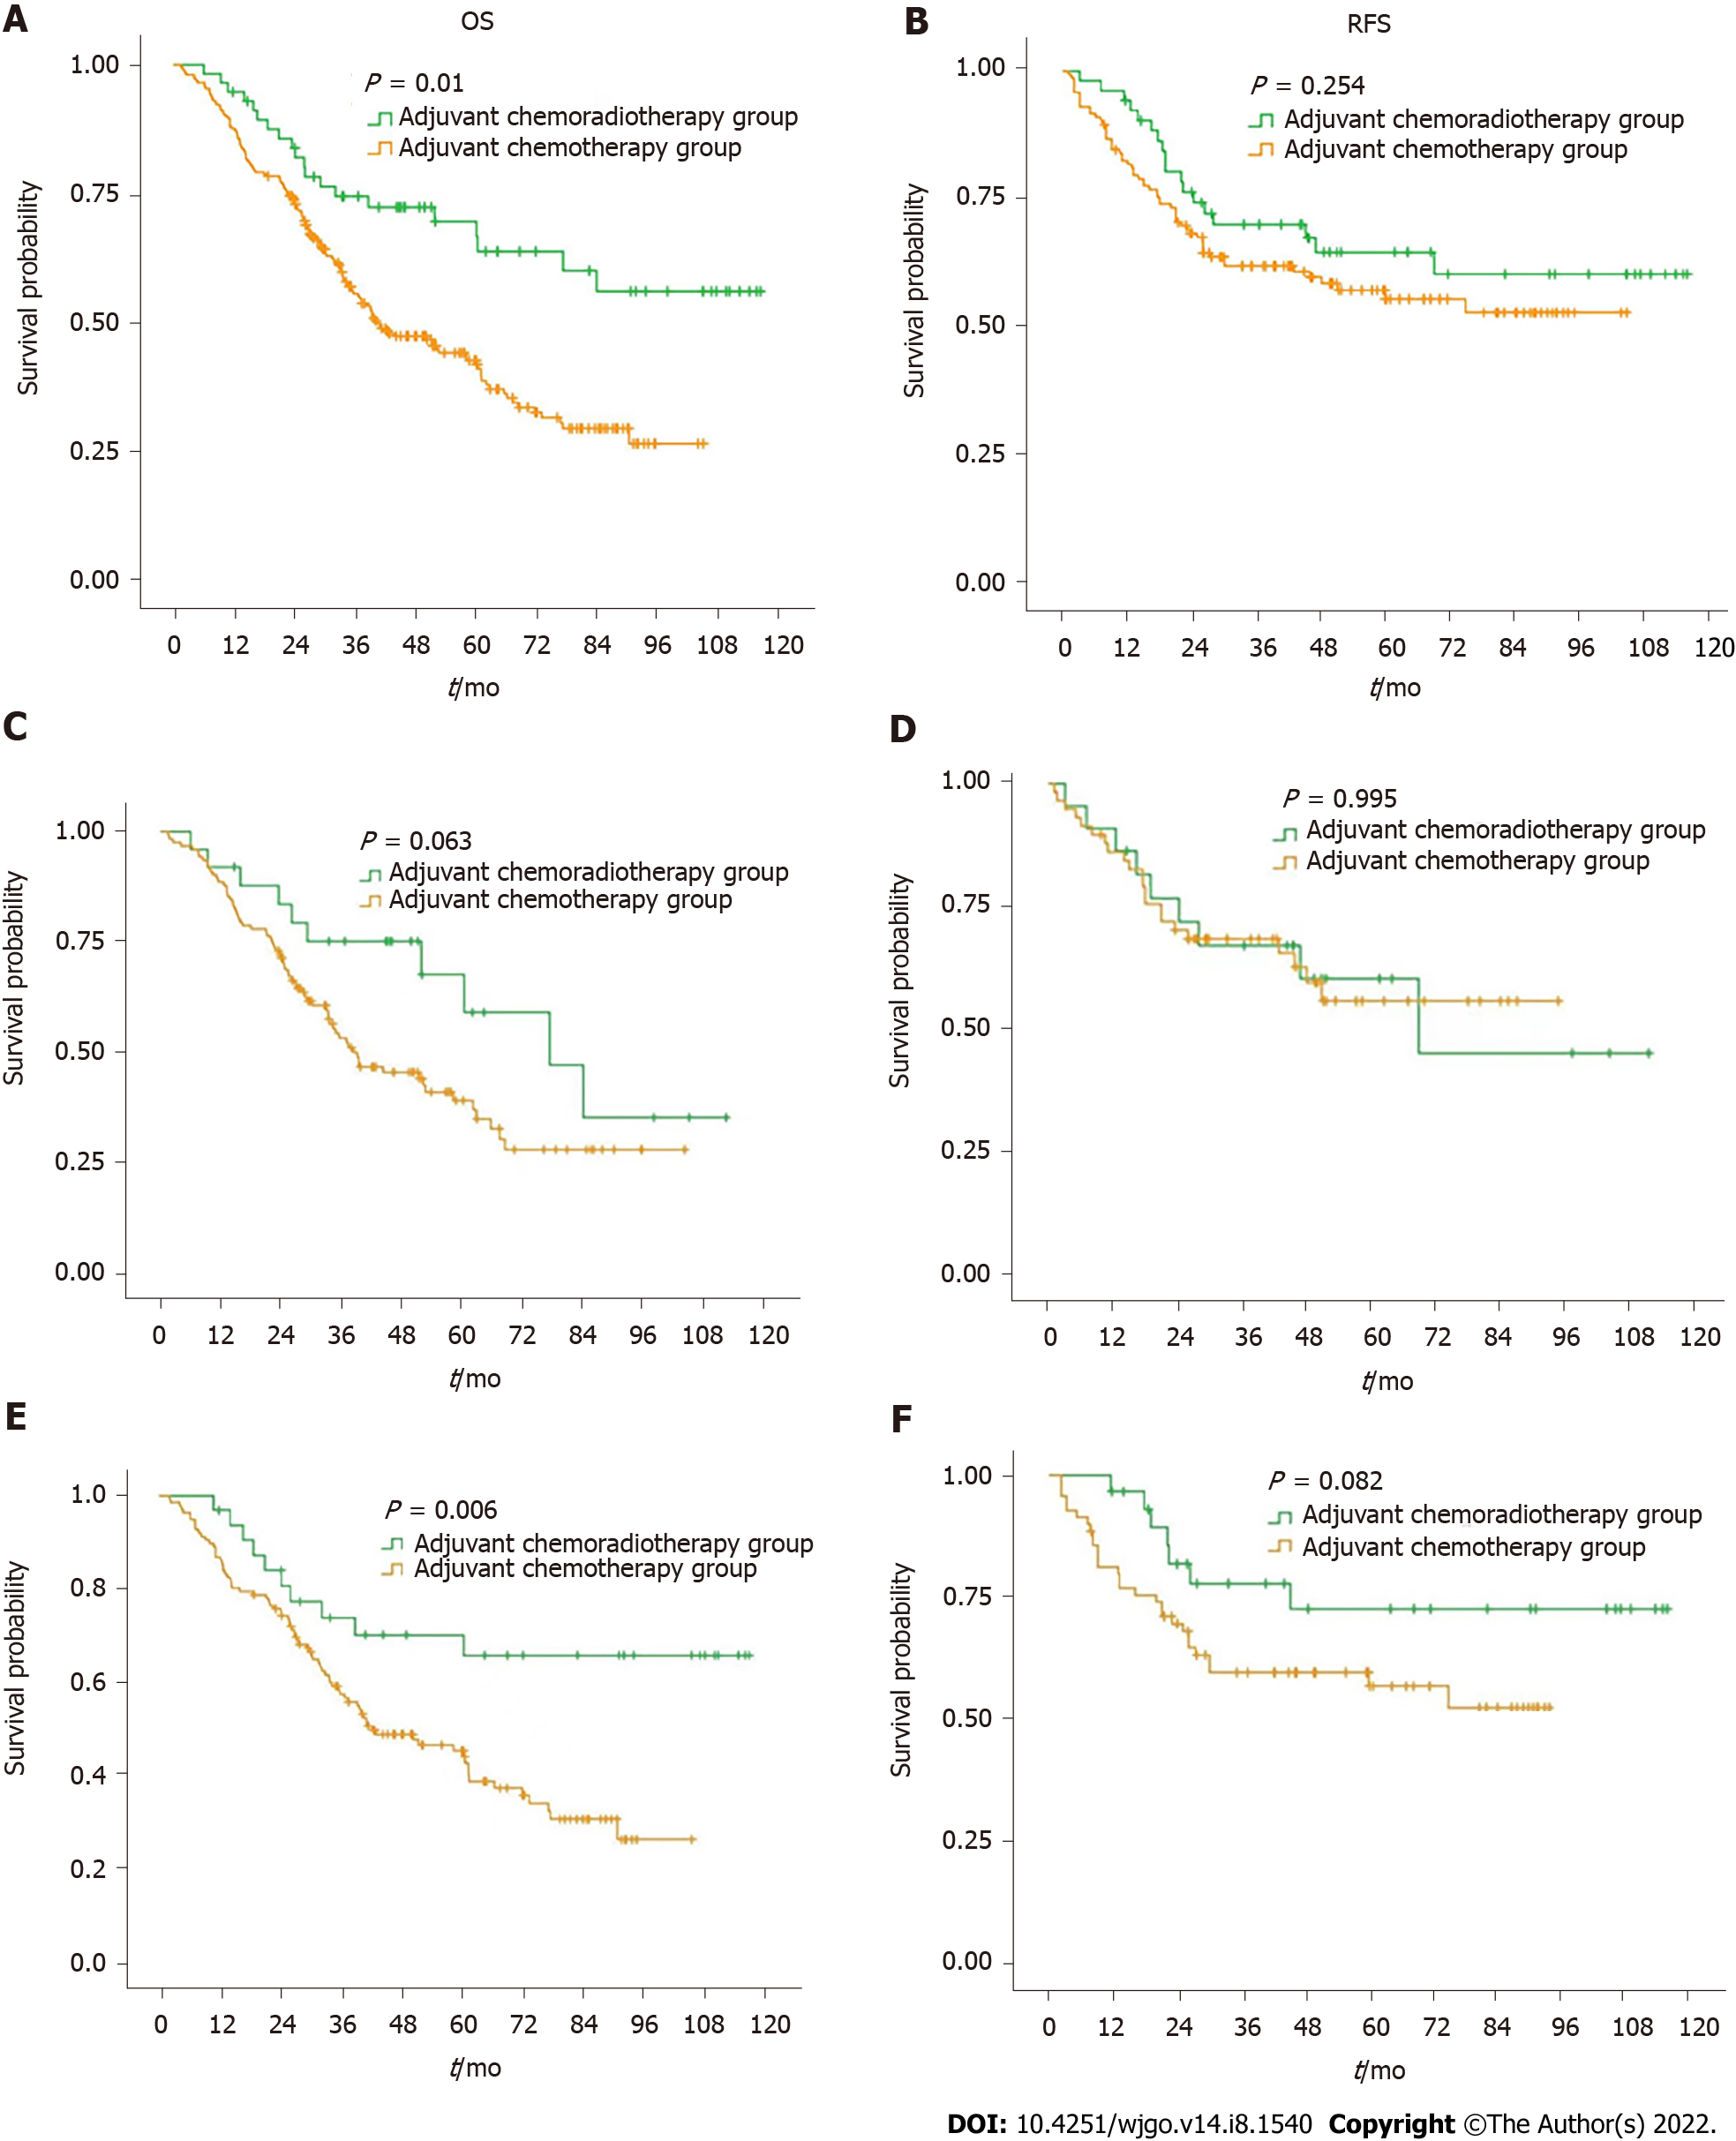
Figure 1 Kaplan-Meier curve for overall survival and relapse-free survival between patients in chemoradiotherapy group and chemo
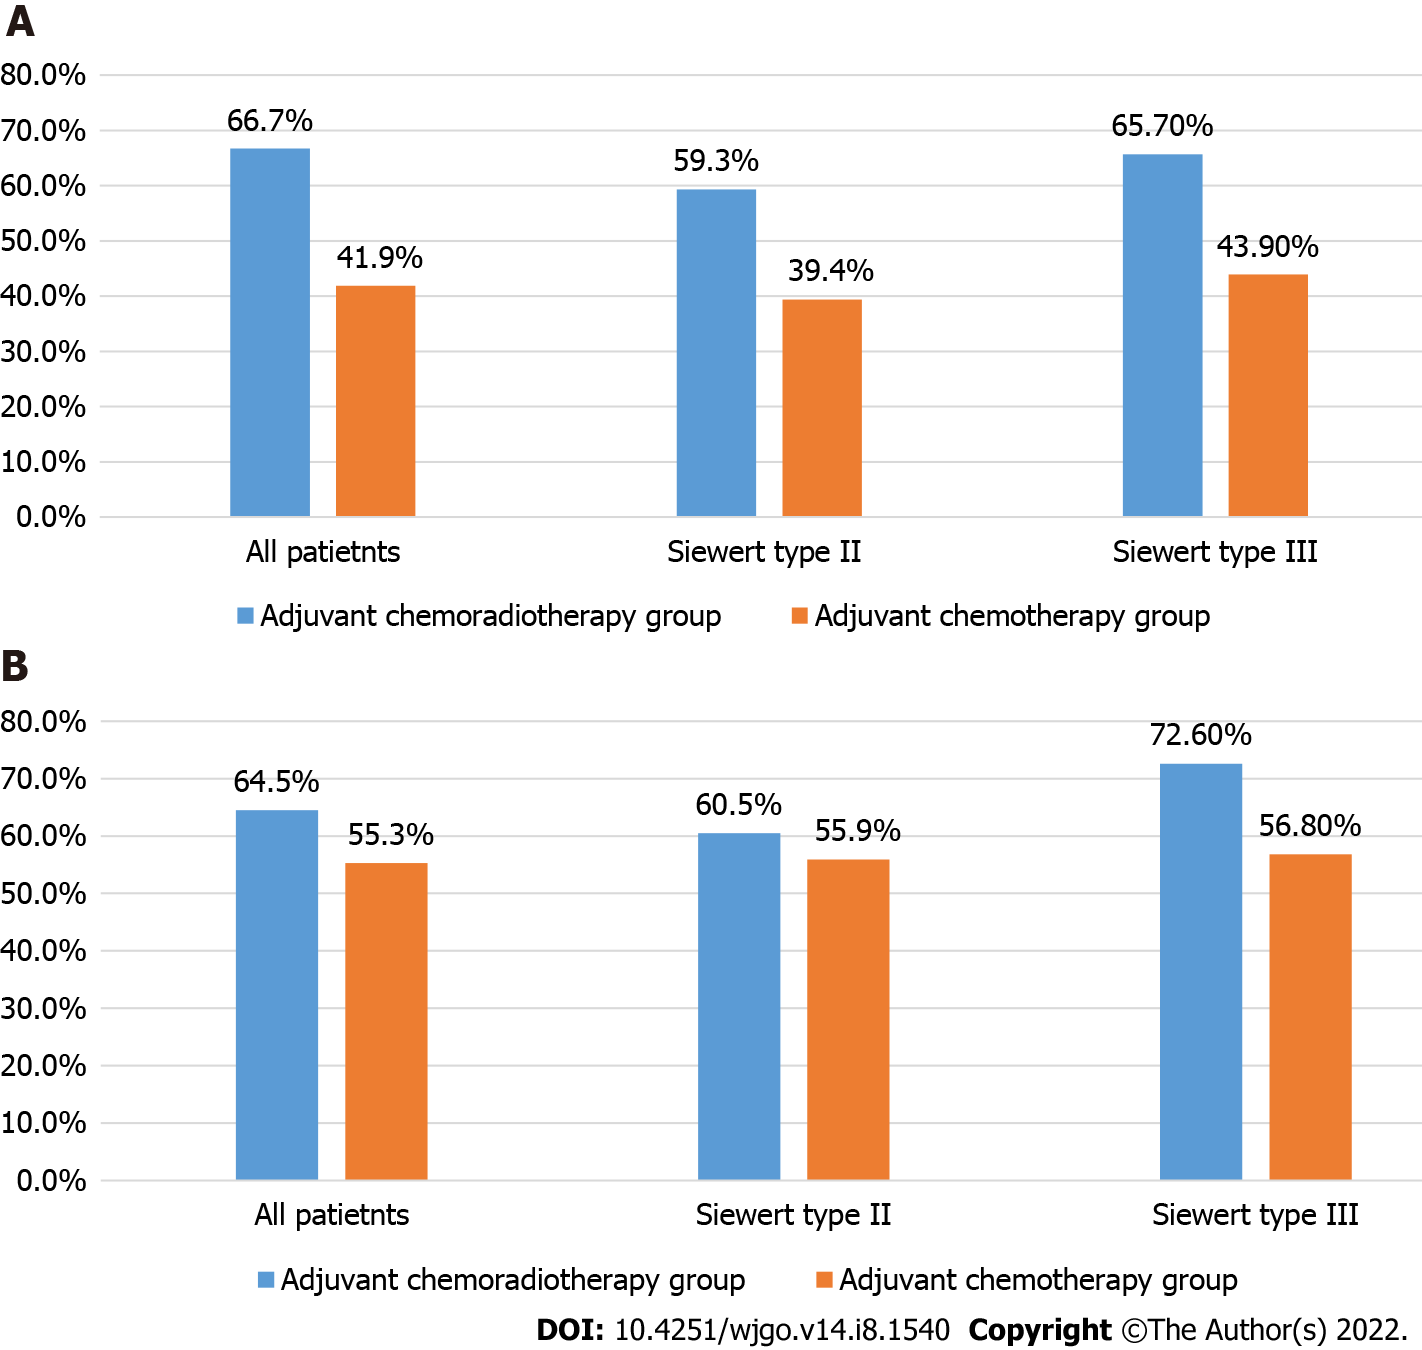
Figure 2 Five-year overall survival rate and recurrence free survival rate of all patients, Siewert type II gastroesophageal junction patients, and Siewert type III gastroesophageal junction patients in chemoradiotherapy group and chemotherapy group.
A: Five-year overall survival rate in chemoradiotherapy (CRT) group and chemotherapy (CT) group; B: Five-year recurrence free survival rate in CRT group and CT group.
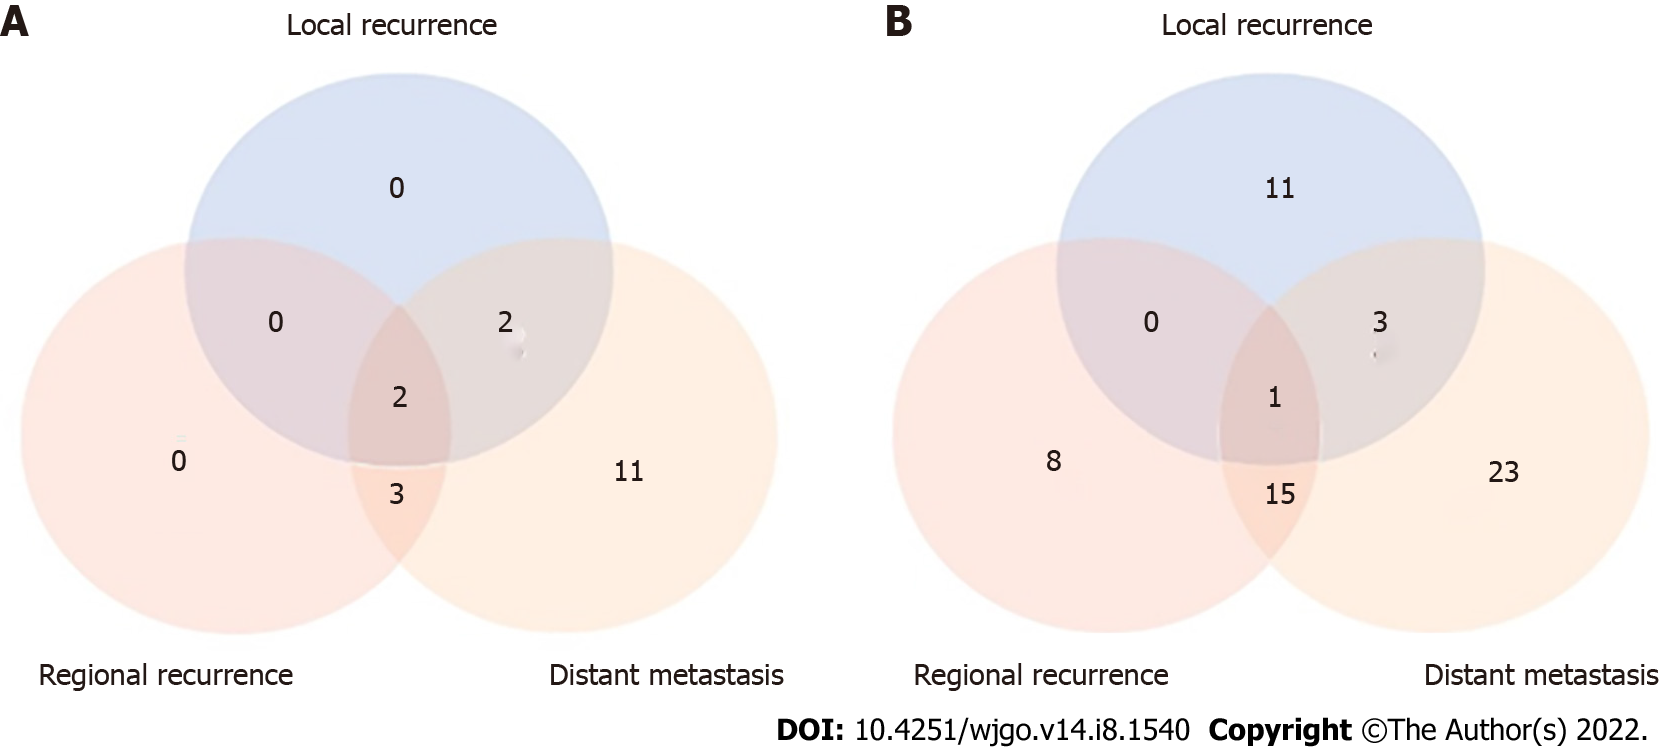
Figure 3 Distributions of recurrence in chemoradiotherapy group and chemotherapy group.
A: Chemoradiotherapy group; B: Chemotherapy group.
- Citation: Kang WZ, Shi JM, Wang BZ, Xiong JP, Shao XX, Hu HT, Jin J, Tian YT. Adjuvant chemoradiotherapy vs adjuvant chemotherapy in locally advanced Siewert type II/III adenocarcinoma of gastroesophageal junction after D2/R0 resection. World J Gastrointest Oncol 2022; 14(8): 1540-1551
- URL: https://www.wjgnet.com/1948-5204/full/v14/i8/1540.htm
- DOI: https://dx.doi.org/10.4251/wjgo.v14.i8.1540


