Copyright
©The Author(s) 2022.
World J Gastrointest Oncol. Aug 15, 2022; 14(8): 1528-1539
Published online Aug 15, 2022. doi: 10.4251/wjgo.v14.i8.1528
Published online Aug 15, 2022. doi: 10.4251/wjgo.v14.i8.1528
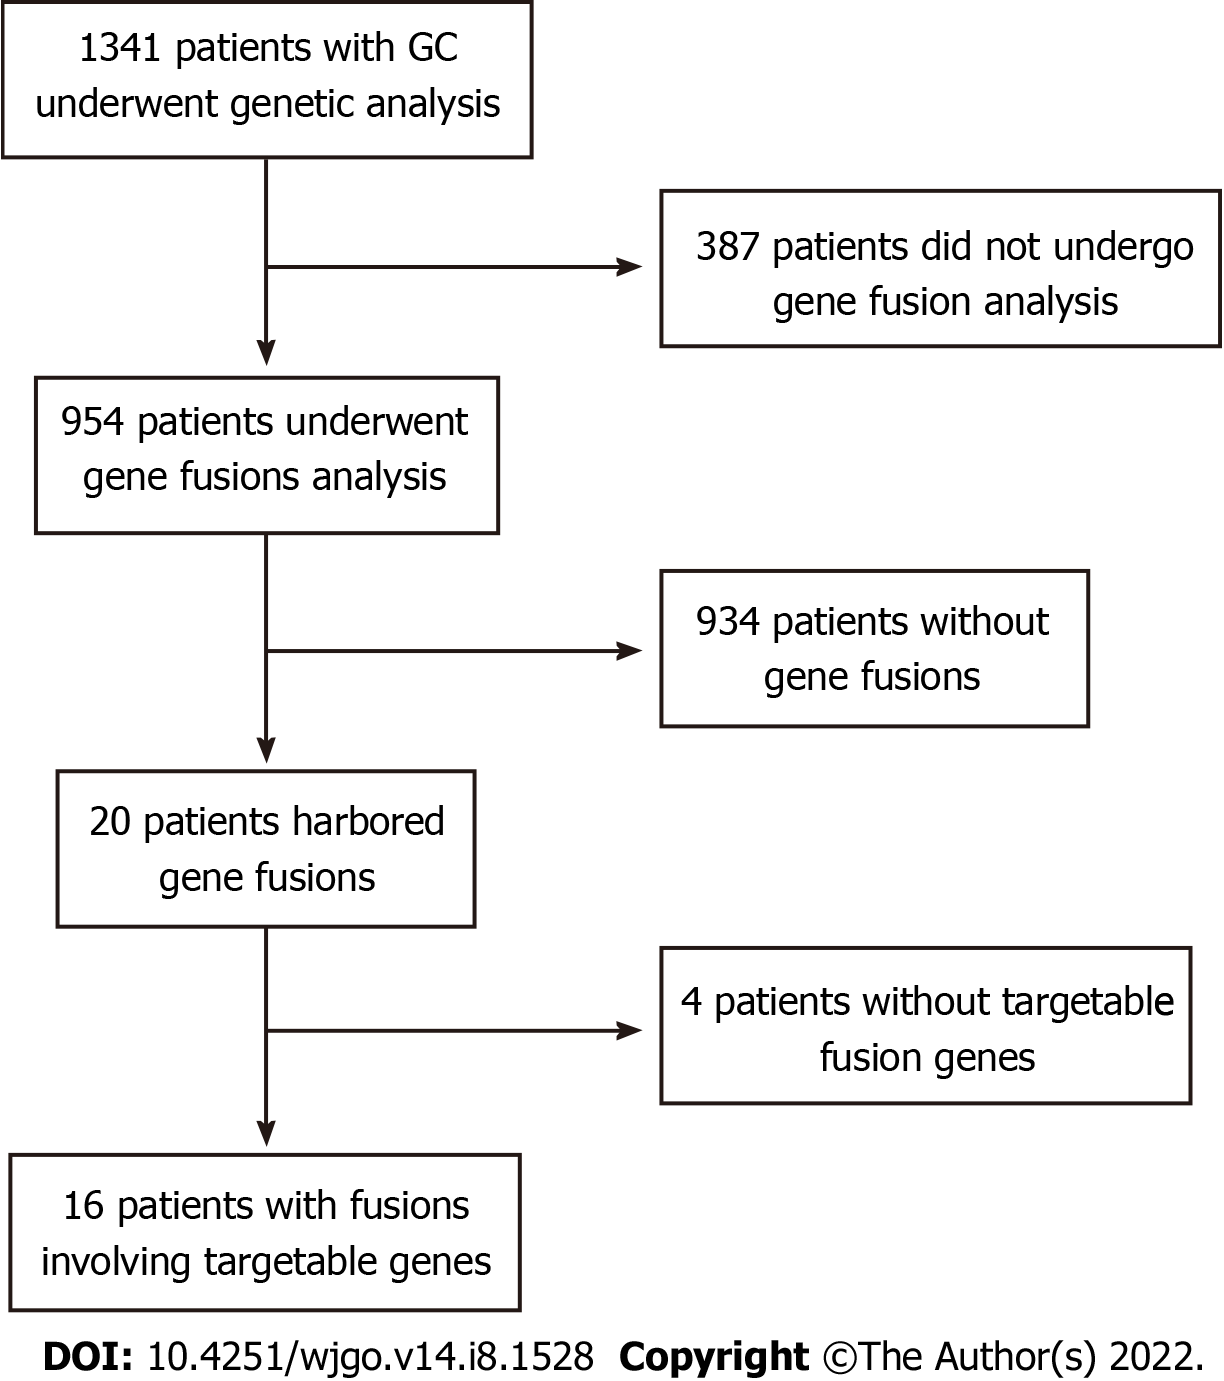
Figure 1 Flowchart of patient selection.
GC: Gastric cancer.
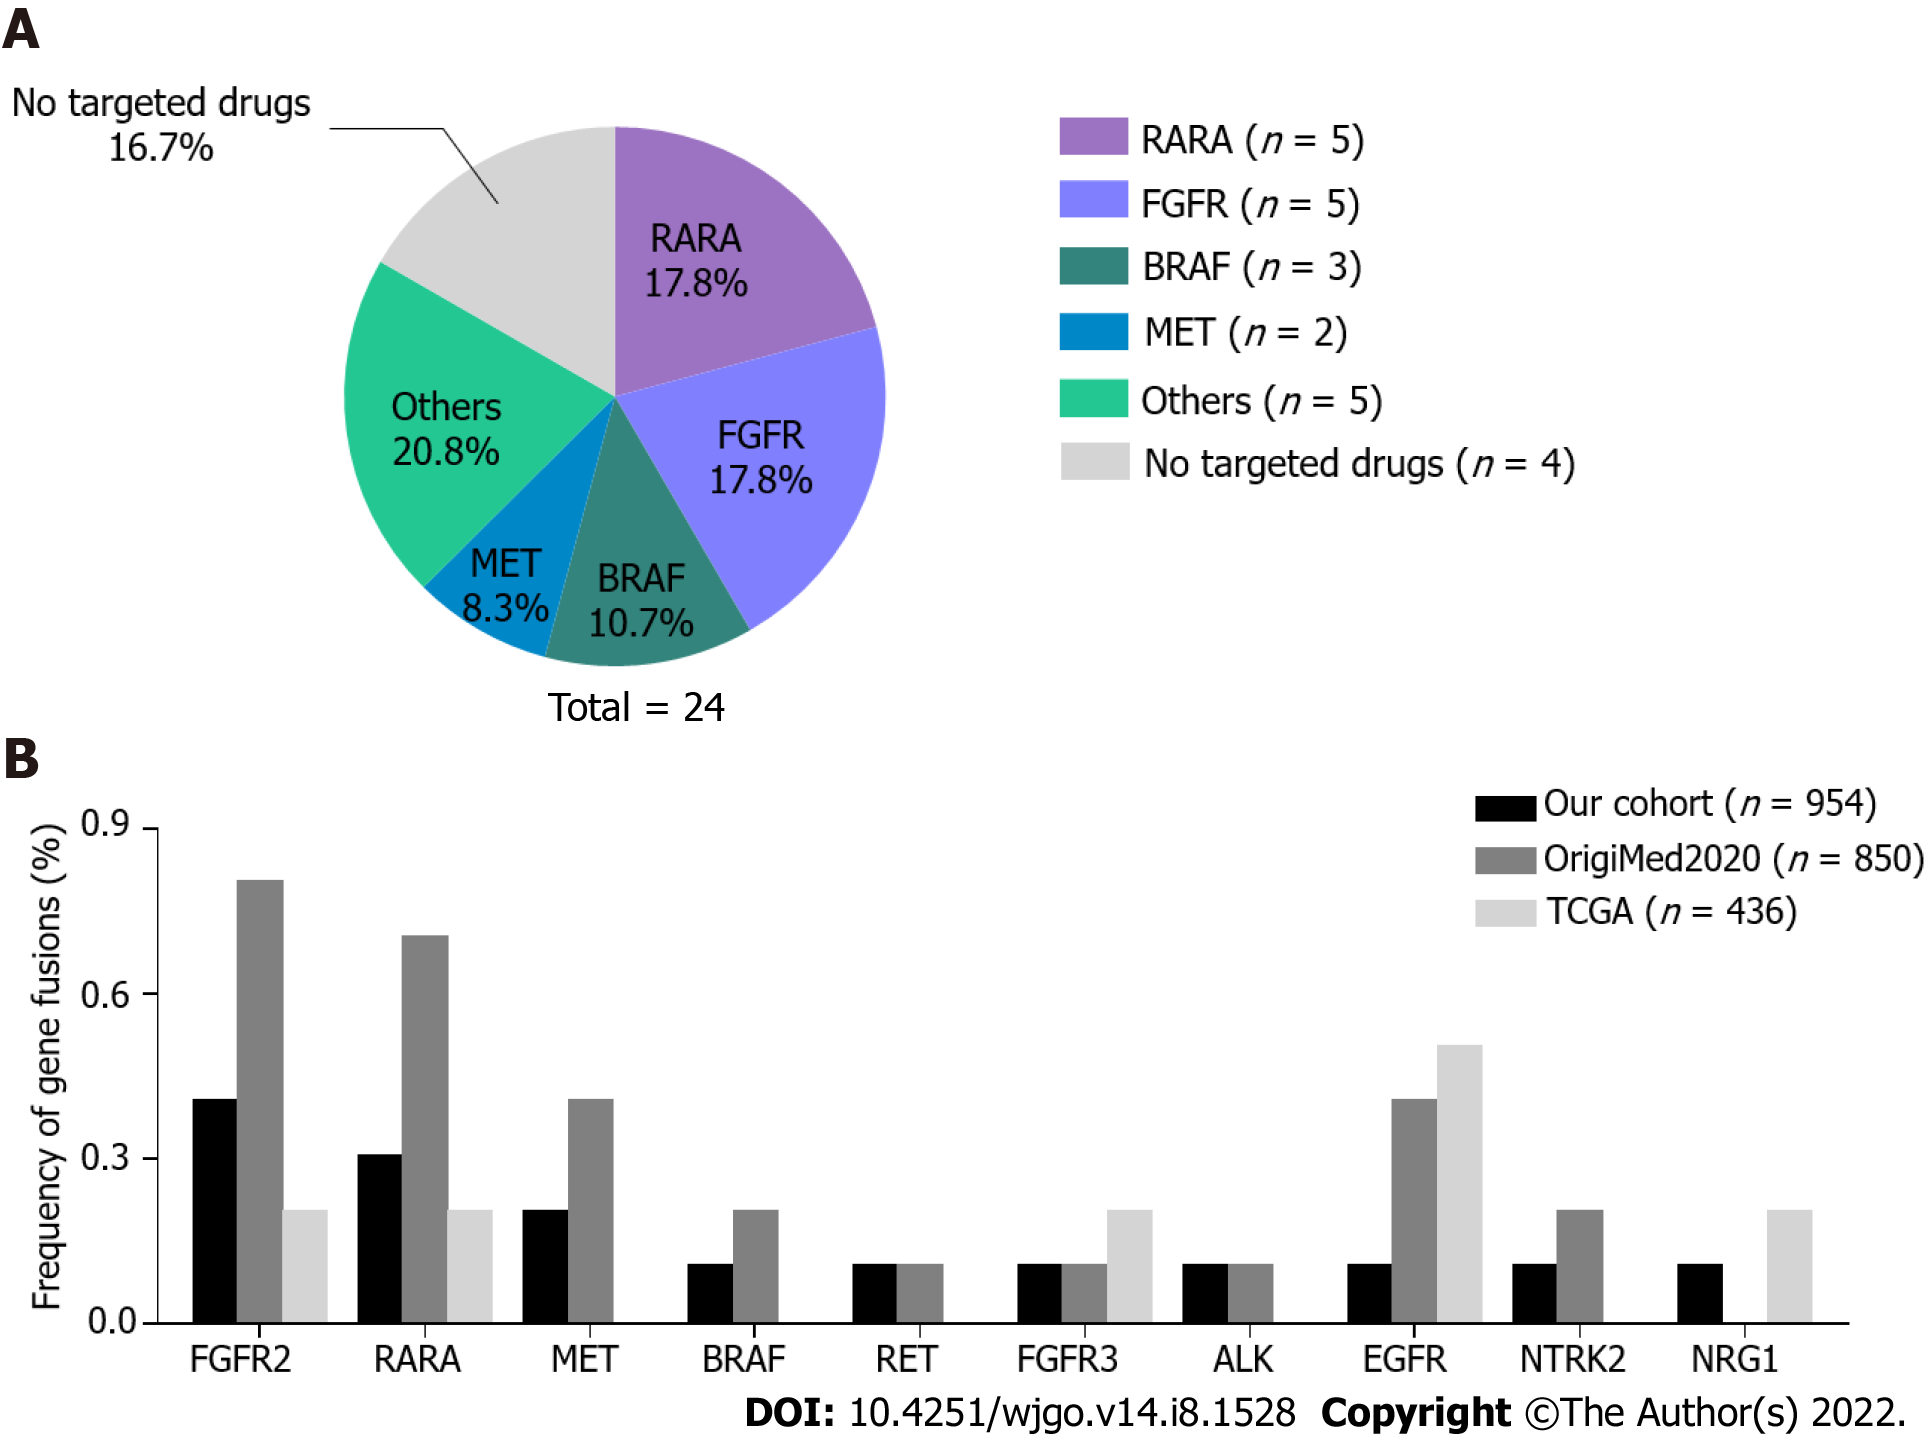
Figure 2 Profile of targetable gene fusions in gastric cancer.
A: The types and proportion of 24 gene fusions. Others included targetable ALK, RET, NTRK2, NRG1, and EGFR fusions. Four fusions without targetable genes were excluded from the analysis; B: Comparison of gene fusion frequencies in our cohort and the OrigiMed2020 and The Cancer Genome Atlas (TCGA) cohorts. No statistical differences were found among the cohorts.
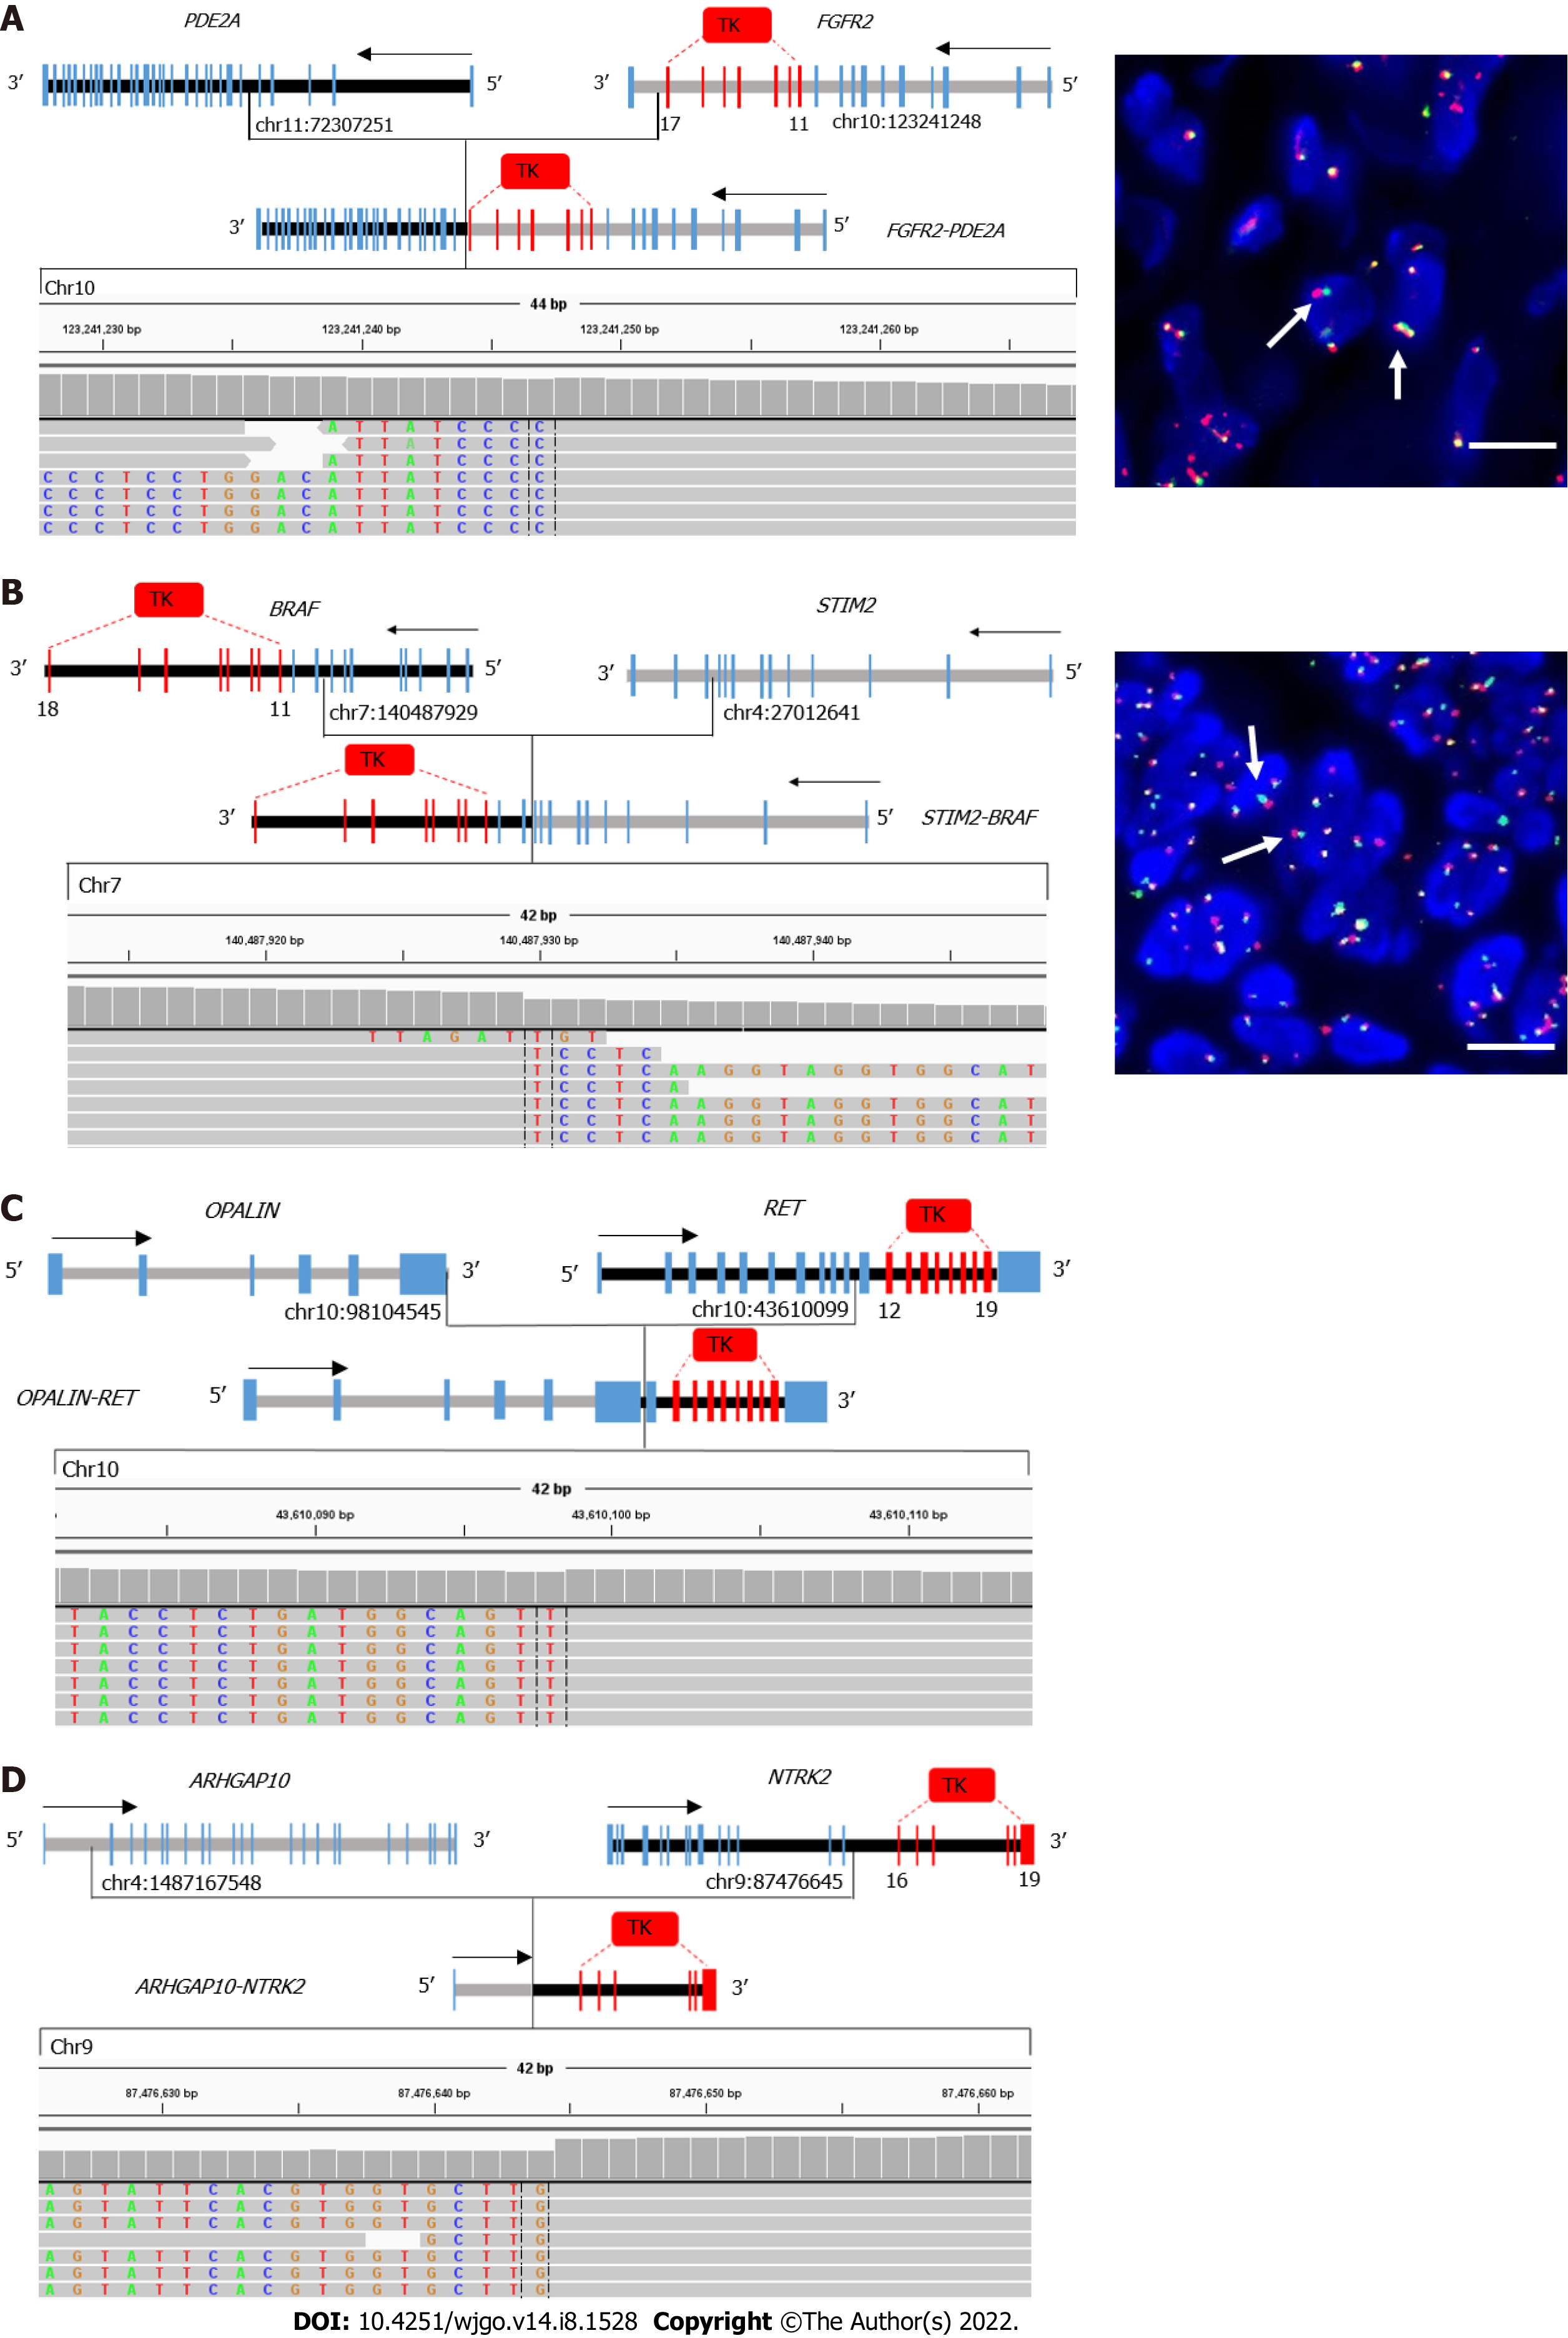
Figure 3 Examples of novel gene fusions involving targetable genes in gastric cancer.
A-D: Schematic representation and Integrative Genomics Viewer screenshot of FGFR2-PED2A (A), STIM-BRAF (B), OPALIN-RET (C), and NTRK2-ARHGAP10 (D) are shown; A and B: FGFR2 and BRAF fusions were confirmed by fluorescence in situ hybridization using FGFR2 (10q26) or BRAF (7q34) break-apart probes. Red spot: 5′ Probe signal; Green spot: 3′ probe signal; Yellow spot: Target gene without rearrangement. Arrows indicate the cells with separate 5′ (red) and 3′ (green) signals. Bar: 100 μm. TK: Tyrosine kinase domain.
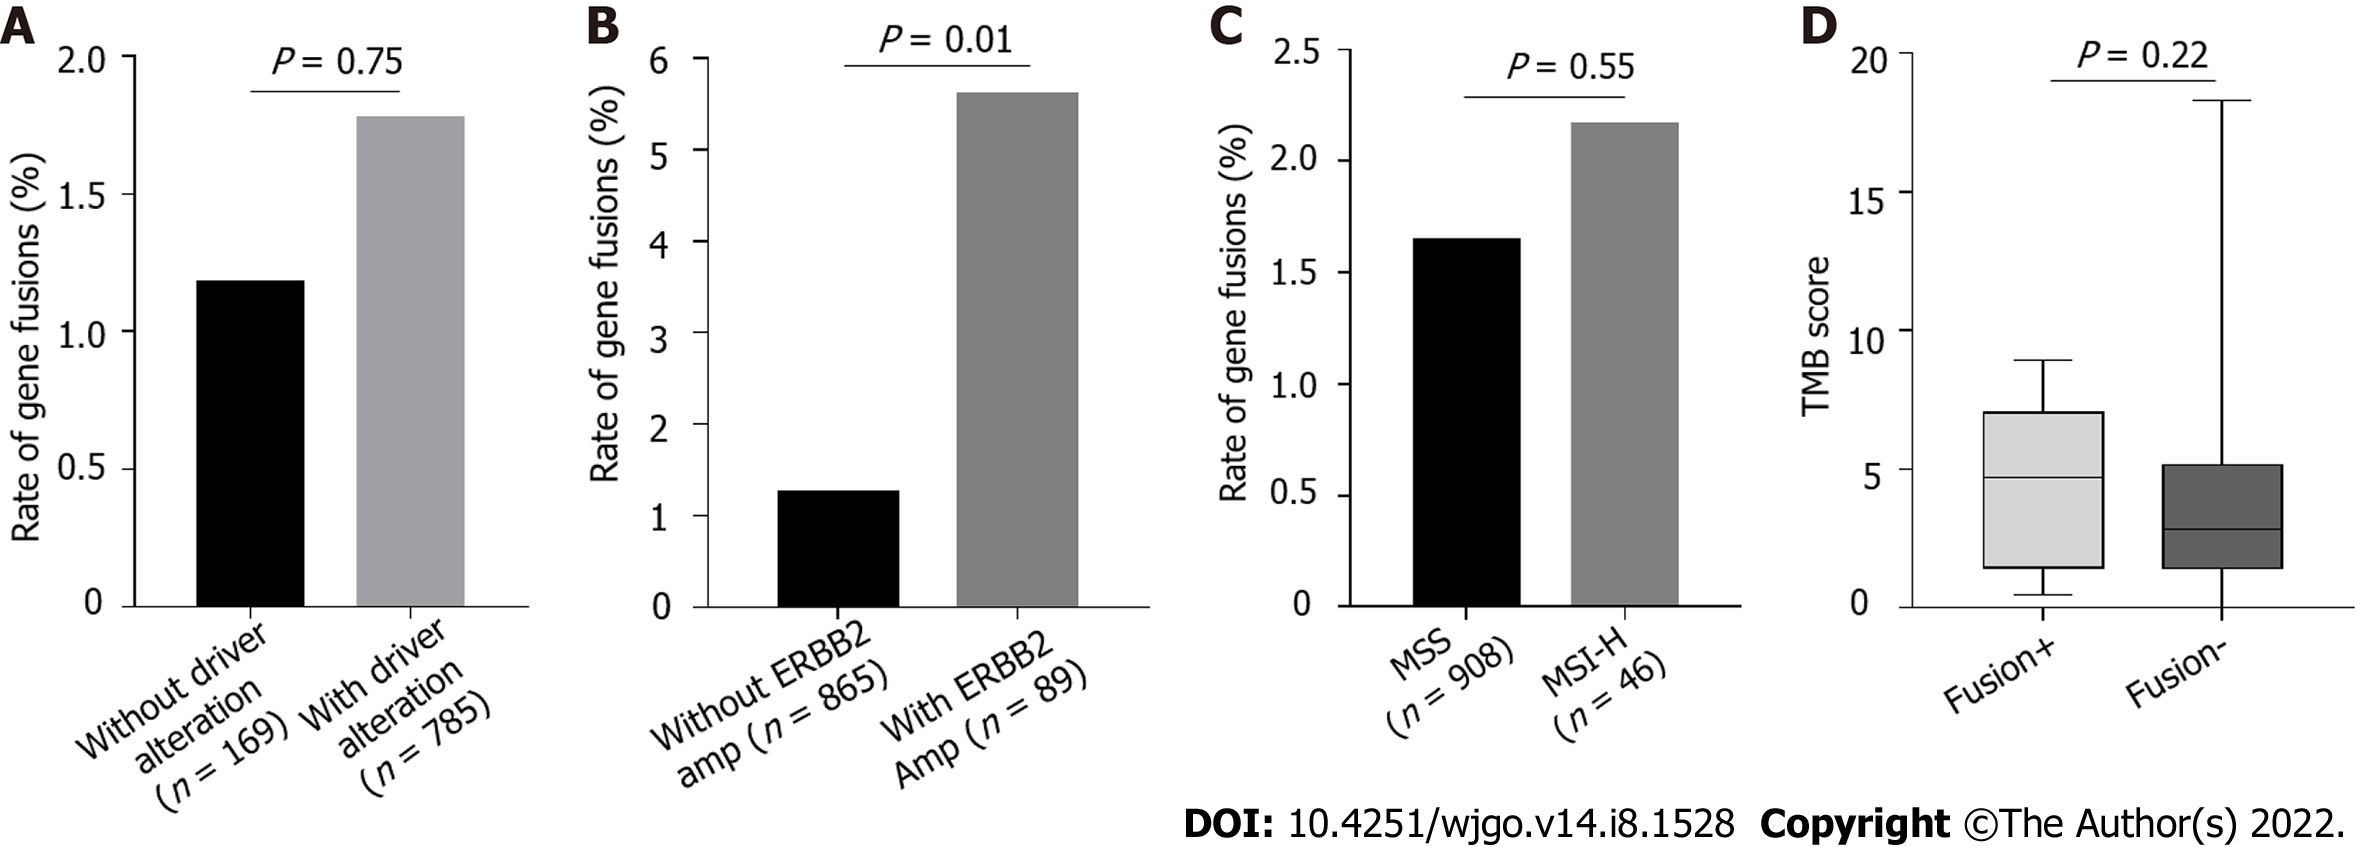
Figure 4 Enrichment of gene fusions in patients with gastric cancer with driver alterations.
A: The incidence of gene fusions in patients with and without driver alterations were analyzed, P > 0.05; B: The incidence of gene fusions in patients with and without ERBB2 amplifications were analyzed, P < 0.05; C: The incidence of gene fusions in patients with microsatellite instability-high and microsatellite stability were analyzed, P > 0.05; D: Tumor mutational burden in targetable gene fusion-positive and -negative patients was compared, P > 0.05.
- Citation: Liu ZH, Zhu BW, Shi M, Qu YR, He XJ, Yuan HL, Ma J, Li W, Zhao DD, Liu ZC, Wang BM, Wang CY, Tao HQ, Ma TH. Profiling of gene fusion involving targetable genes in Chinese gastric cancer. World J Gastrointest Oncol 2022; 14(8): 1528-1539
- URL: https://www.wjgnet.com/1948-5204/full/v14/i8/1528.htm
- DOI: https://dx.doi.org/10.4251/wjgo.v14.i8.1528


