Copyright
©The Author(s) 2022.
World J Gastrointest Oncol. Jul 15, 2022; 14(7): 1281-1294
Published online Jul 15, 2022. doi: 10.4251/wjgo.v14.i7.1281
Published online Jul 15, 2022. doi: 10.4251/wjgo.v14.i7.1281
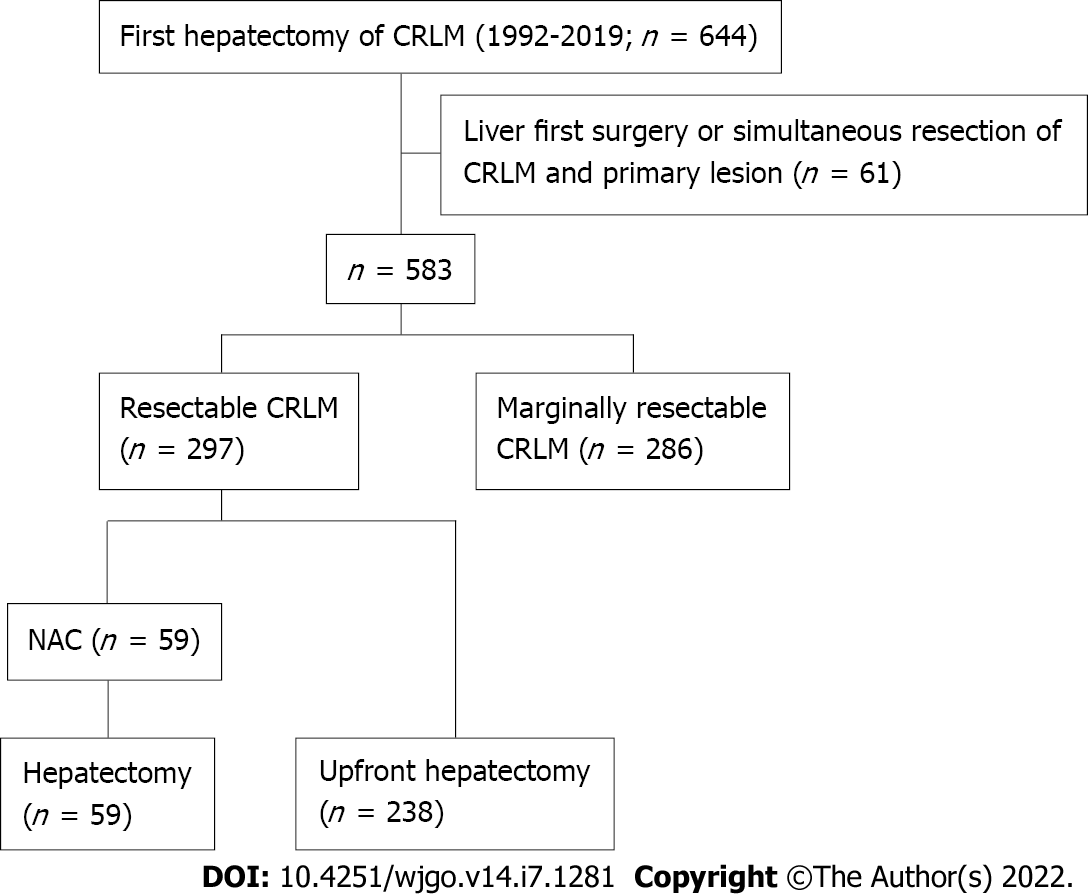
Figure 1 Study flow diagram.
NAC: Neoadjuvant chemotherapy; CRLM: Colorectal liver metastases.
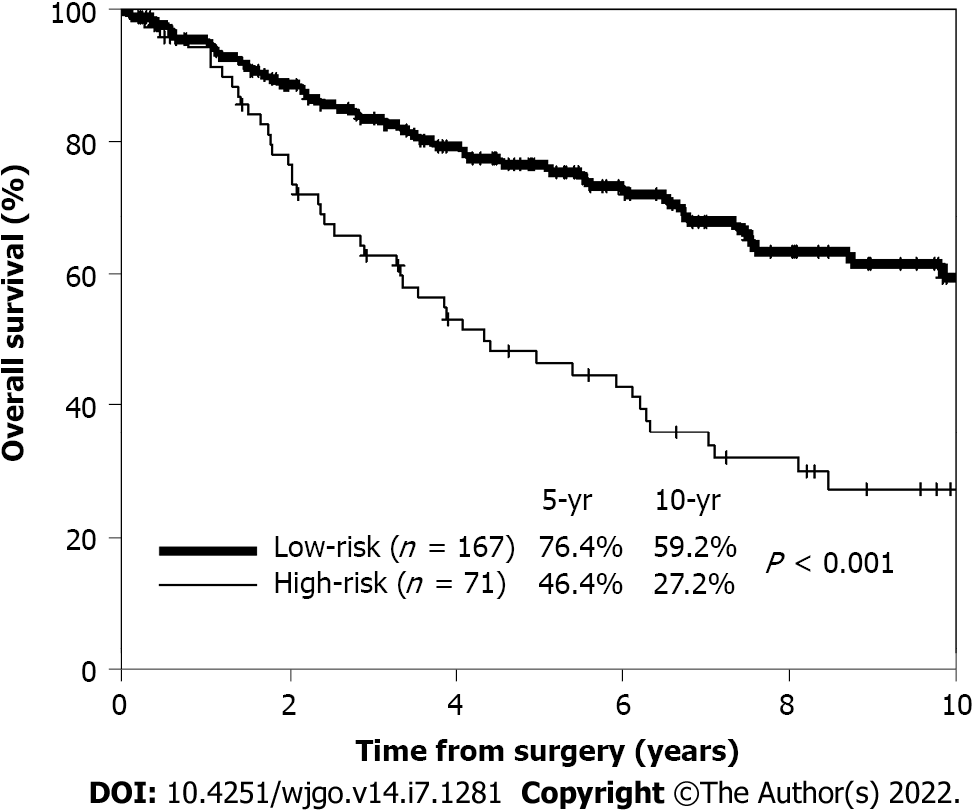
Figure 2 Kaplan–Meier curves of 5-yr overall survival stratified by risk.
Patients in the high-(71 patients) and low-(167 patients) risk groups are represented by the thin and thick lines, respectively.
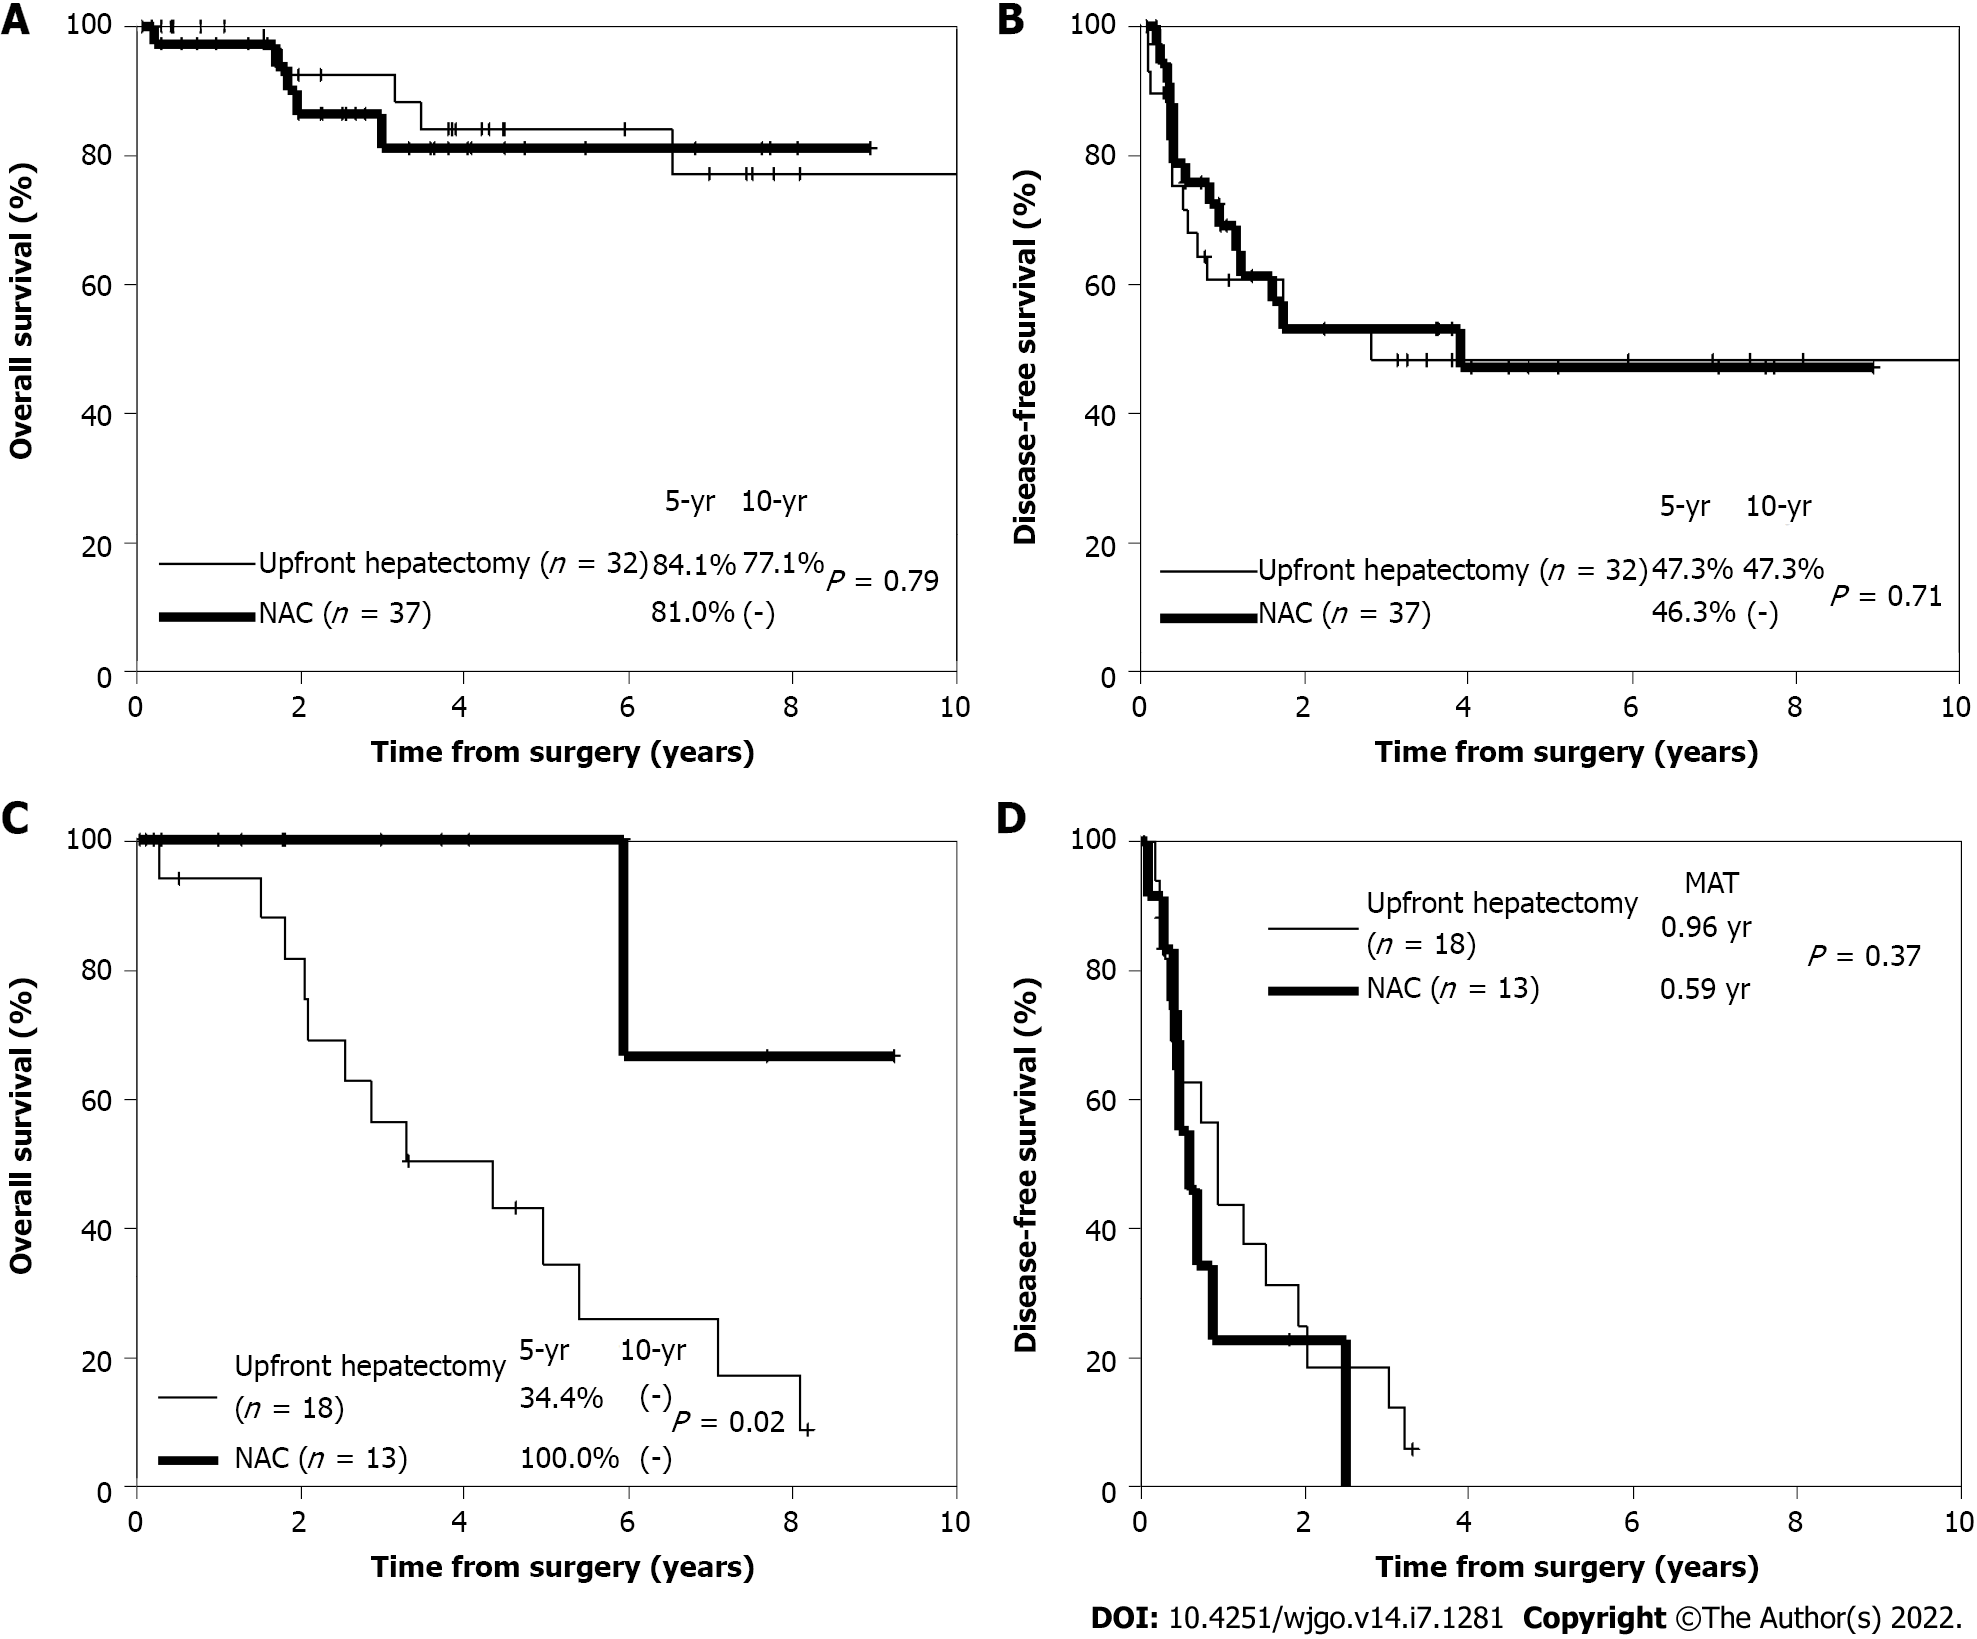
Figure 3 Kaplan–Meier curves.
A and C: 5-yr overall survival; B: 5-yr disease-free survival (DFS) in low-risk patients in the upfront hepatectomy (thin line) (32 patients) and neoadjuvant chemotherapy (NAC) (thick line) (37 patients) groups after propensity score matching; D: 5-yr DFS in high-risk patients in the upfront hepatectomy (thin line) (18 patients) and NAC (thick line) (13 patients) groups after propensity score matching. NAC: Neoadjuvant chemotherapy.
- Citation: Takeda K, Sawada Y, Yabushita Y, Honma Y, Kumamoto T, Watanabe J, Matsuyama R, Kunisaki C, Misumi T, Endo I. Efficacy of neoadjuvant chemotherapy for initially resectable colorectal liver metastases: A retrospective cohort study. World J Gastrointest Oncol 2022; 14(7): 1281-1294
- URL: https://www.wjgnet.com/1948-5204/full/v14/i7/1281.htm
- DOI: https://dx.doi.org/10.4251/wjgo.v14.i7.1281


