Copyright
©The Author(s) 2022.
World J Gastrointest Oncol. Jun 15, 2022; 14(6): 1124-1140
Published online Jun 15, 2022. doi: 10.4251/wjgo.v14.i6.1124
Published online Jun 15, 2022. doi: 10.4251/wjgo.v14.i6.1124
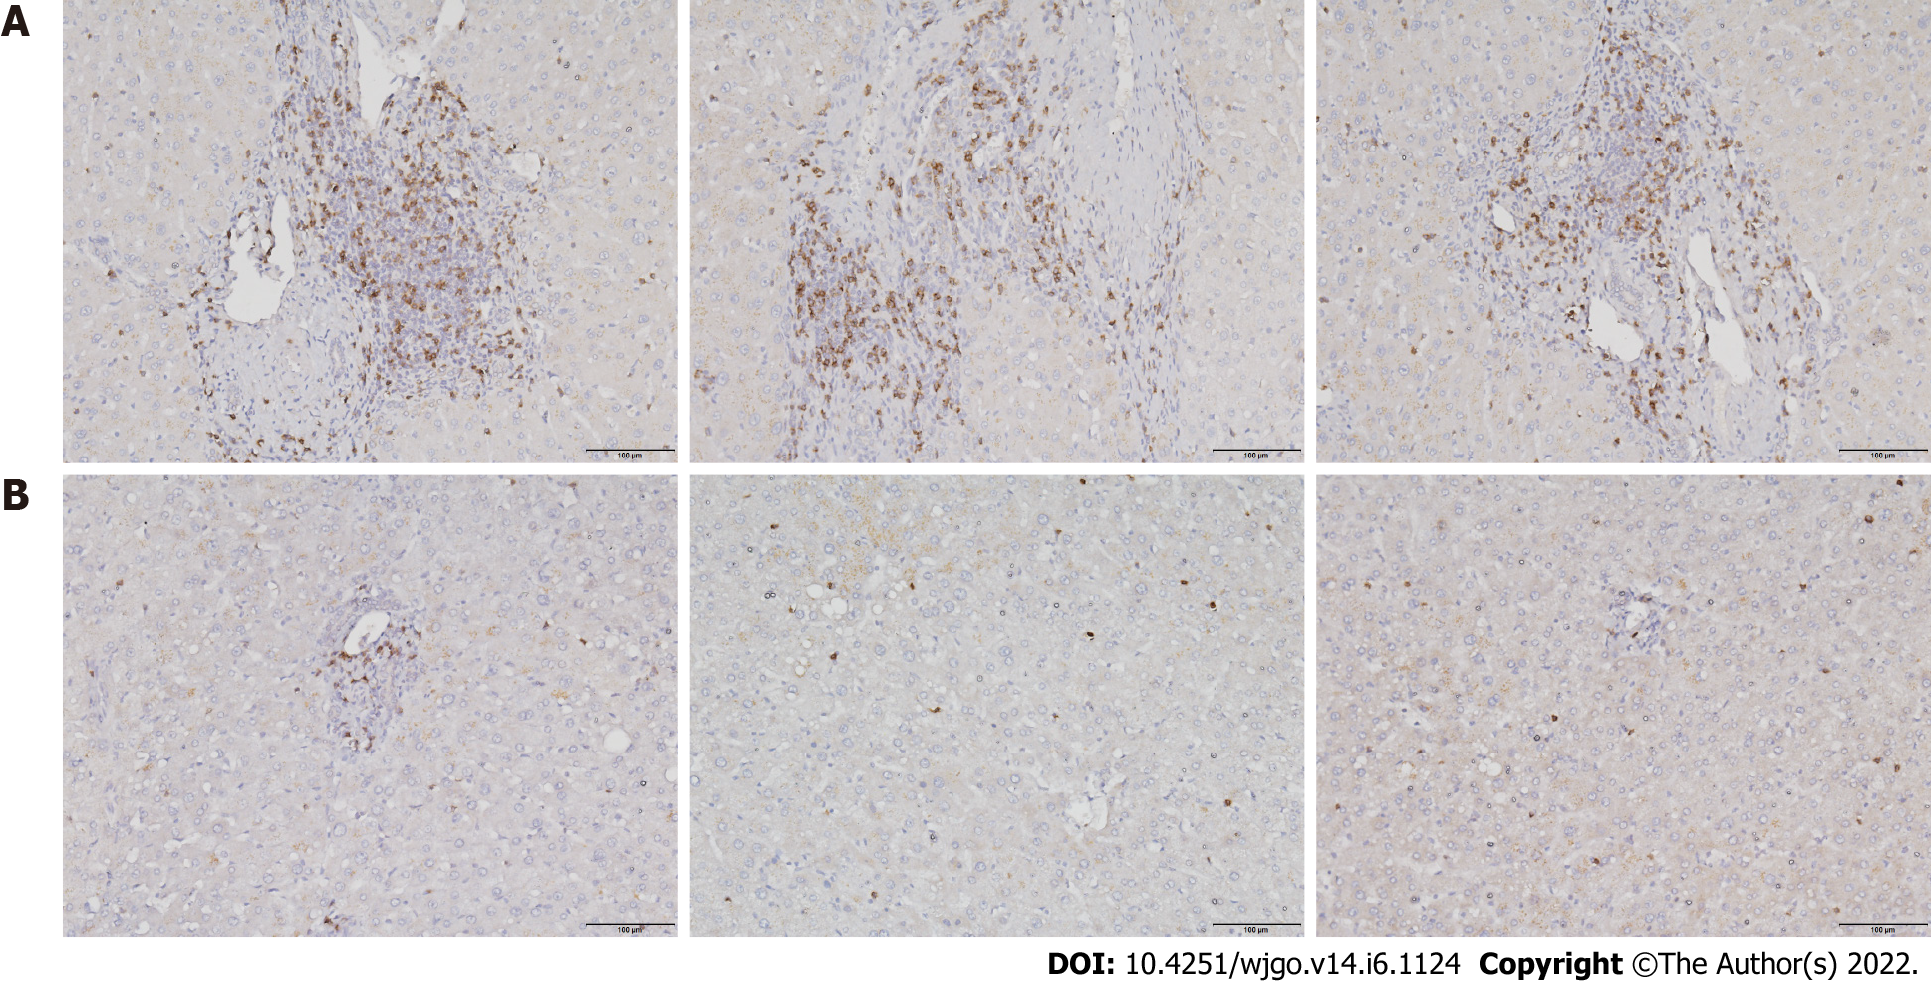
Figure 1 CD8+ T cell infiltration in liver tissues.
A: Hepatocellular carcinoma tissues; B: Paracancerous tissues. Scale bar: 200 μm.
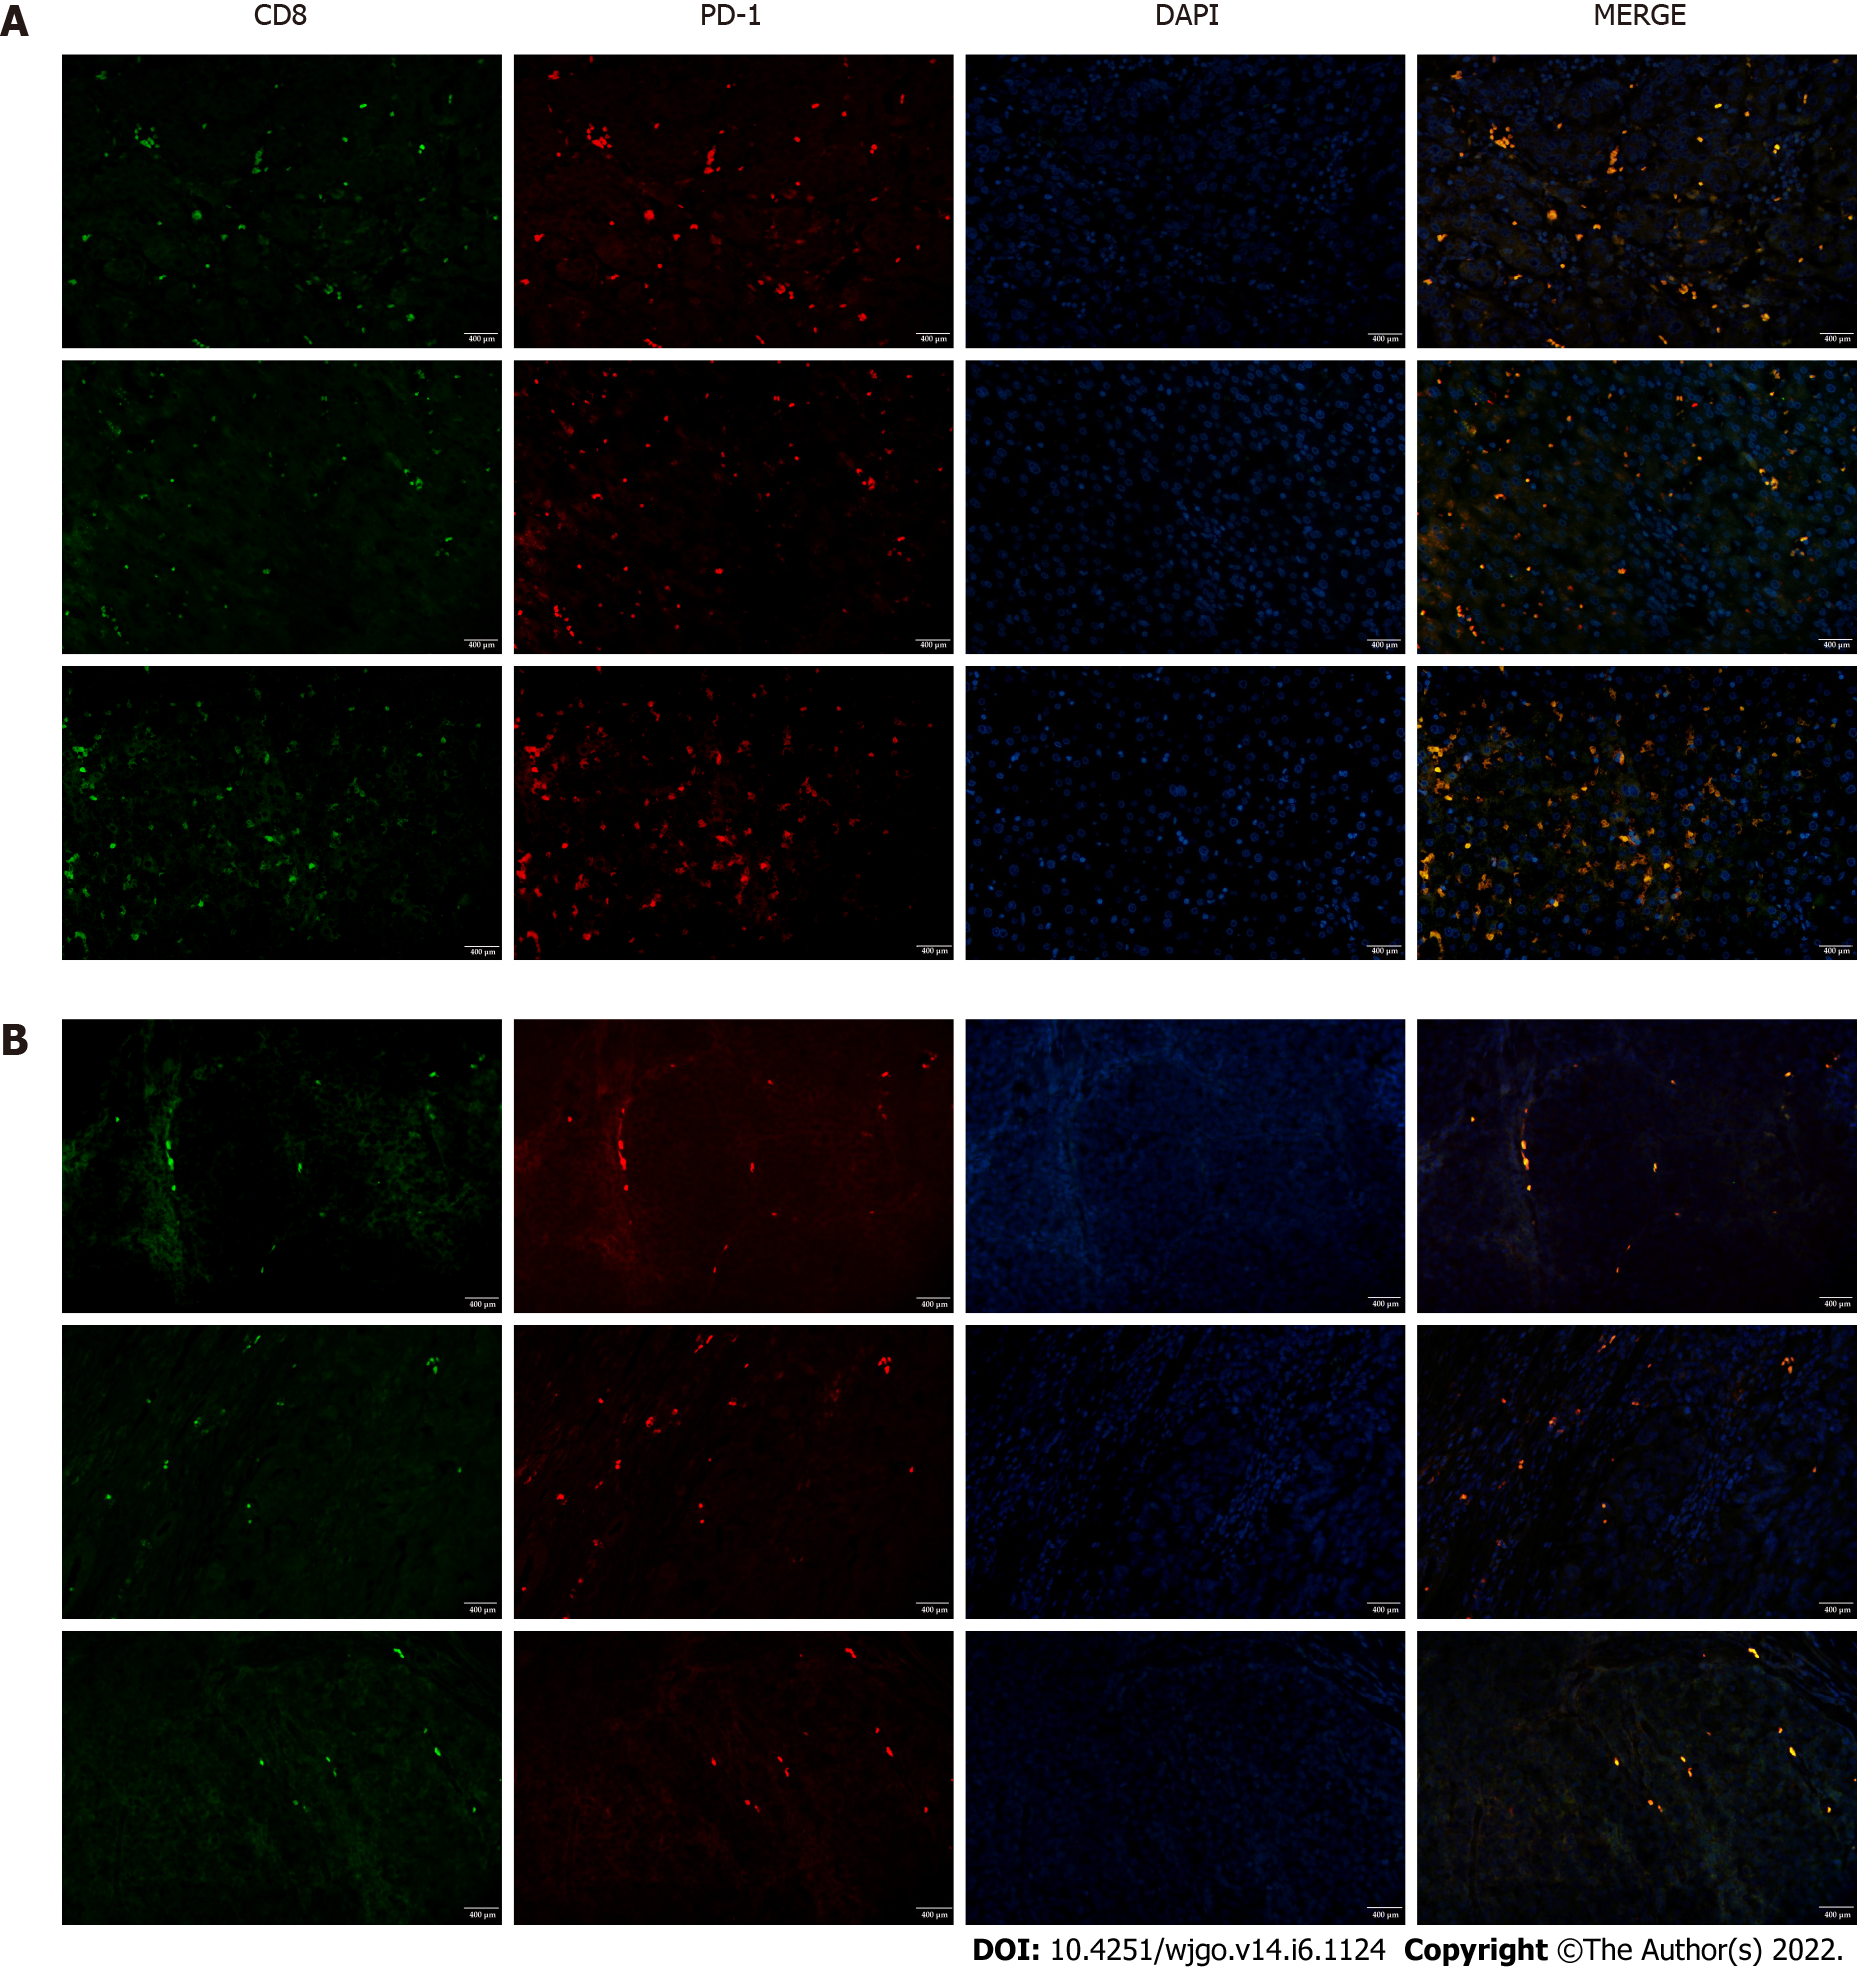
Figure 2 PD-1 expression by infiltrating CD8+ T cells in liver tissues.
Tissues were subjected to fluorescent double staining with anti-CD8 and anti-PD-1 antibodies. A: Hepatocellular carcinoma tissues; B: Paracancerous tissues. Scale bar: 400 μm.
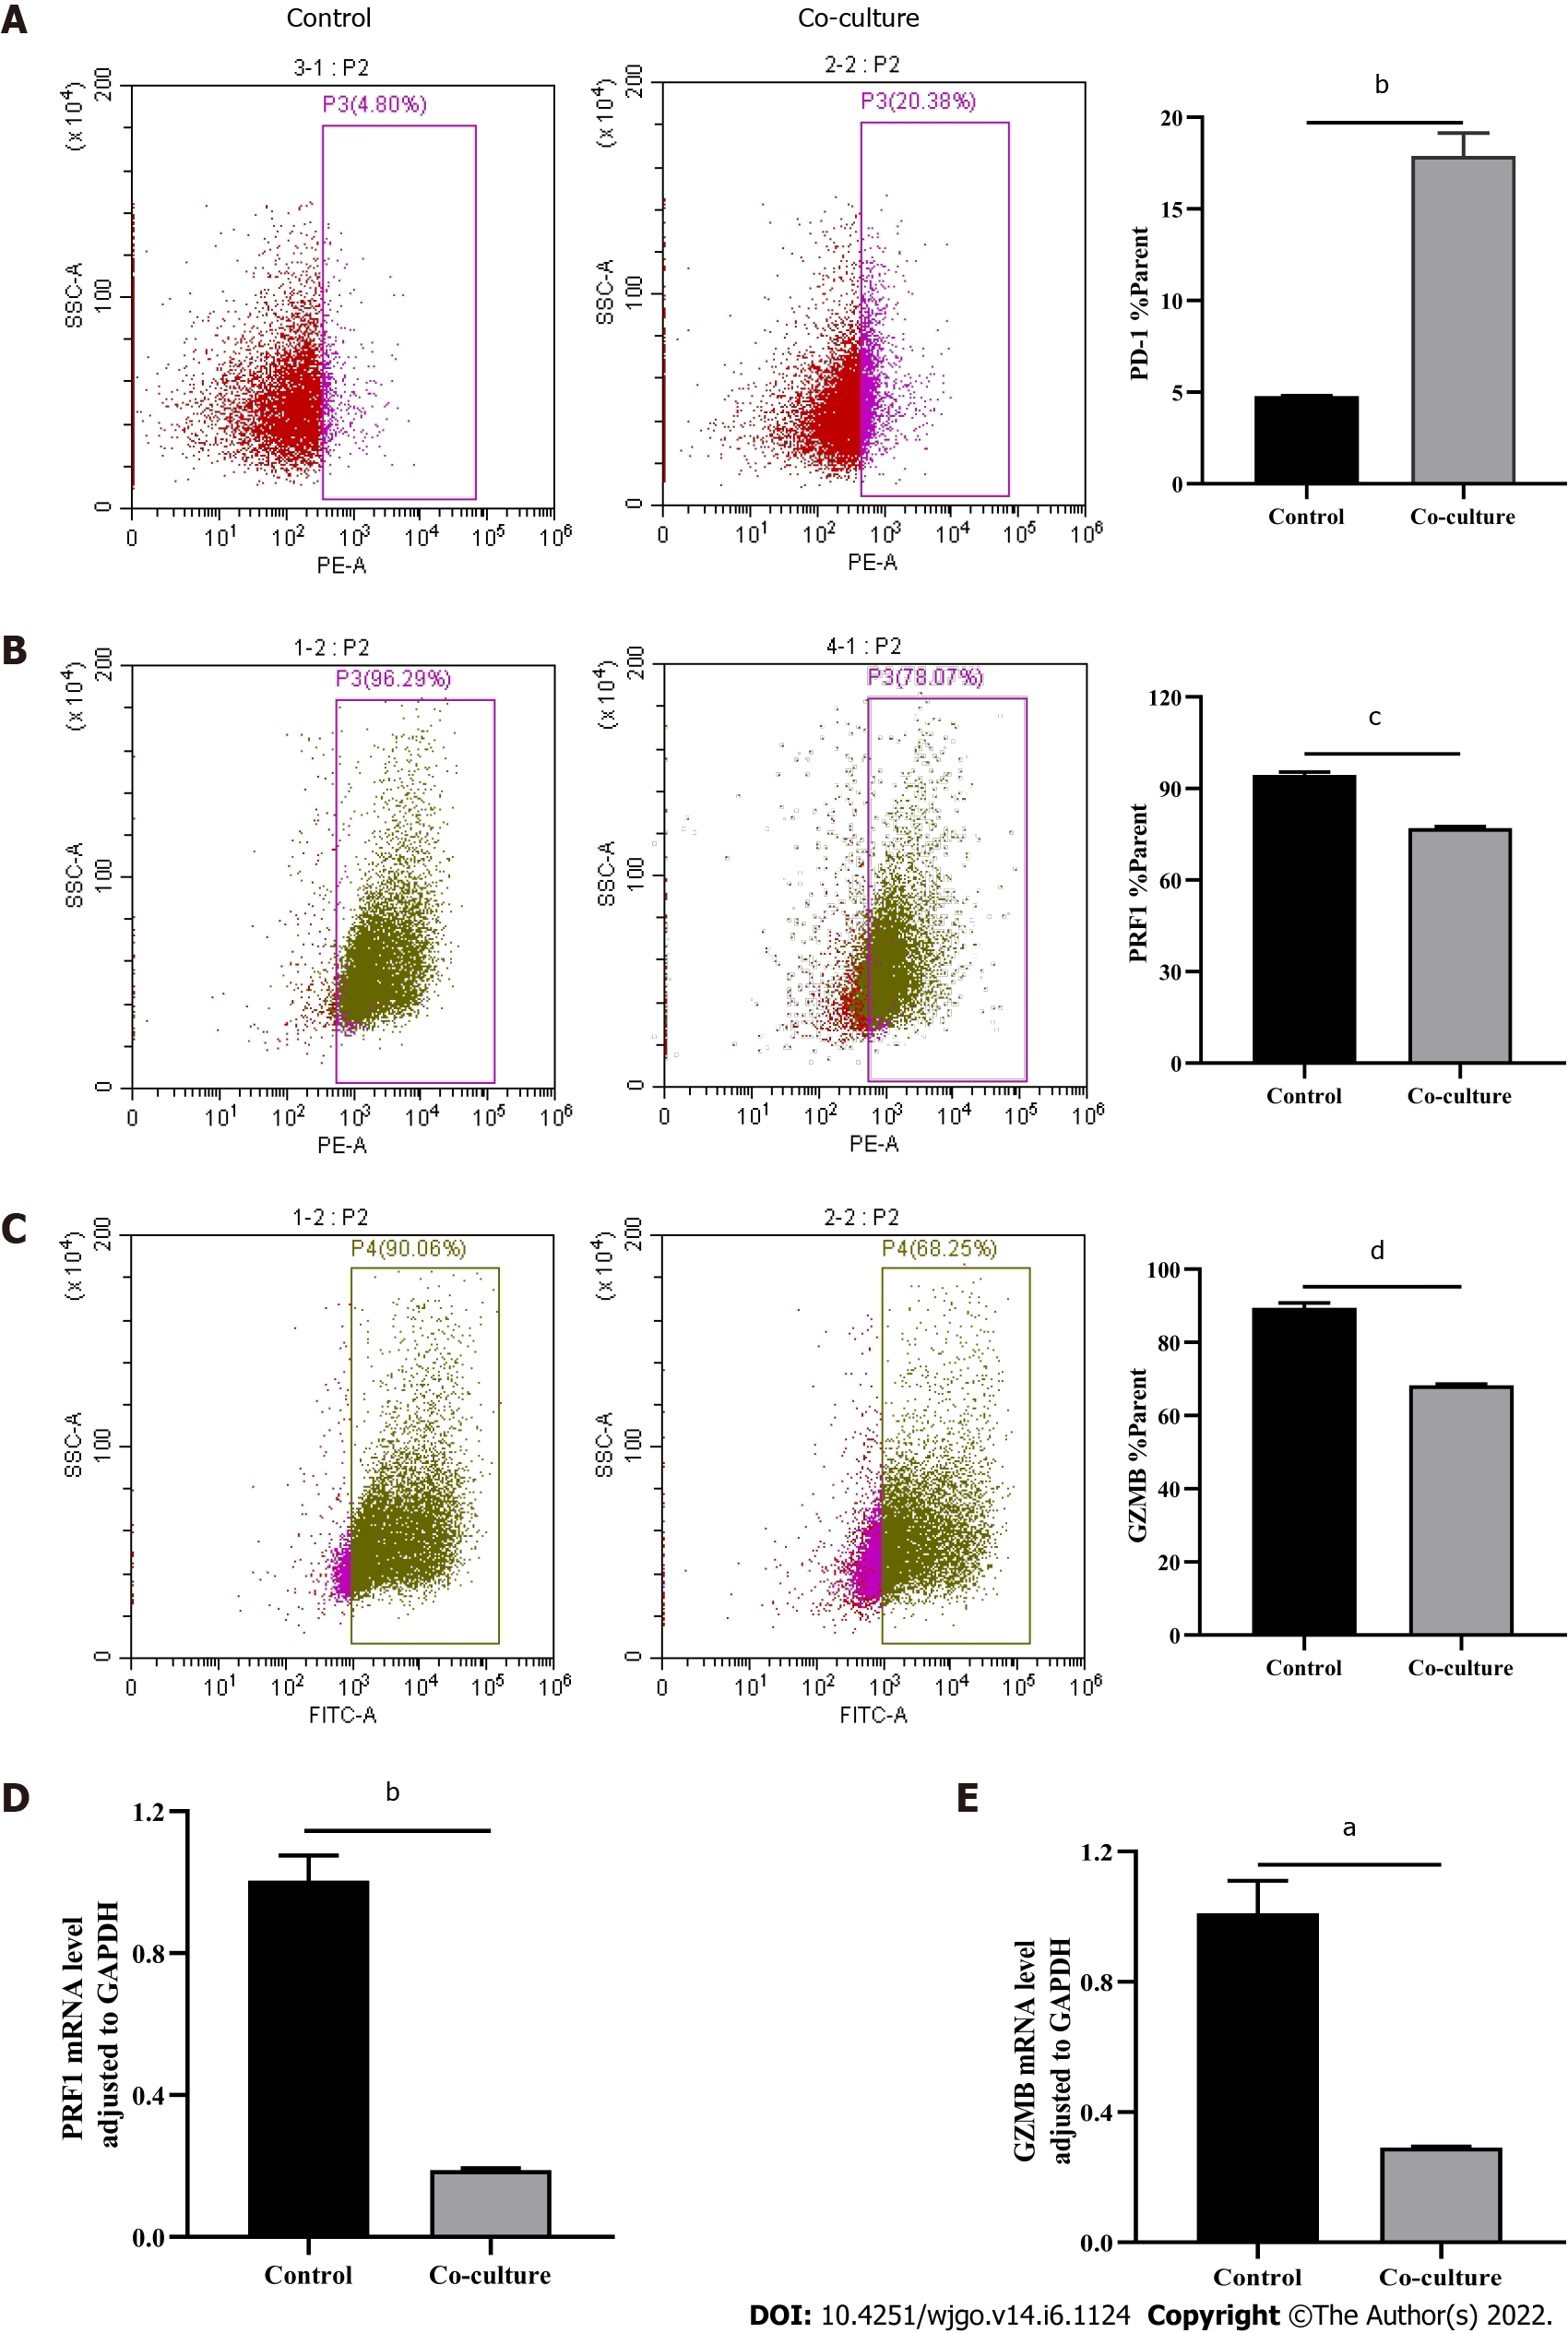
Figure 3 Evaluations of CD8+ T cell function.
Activated CD8+ T cells were co-cultured with Huh-7 cells for 3 d. Flow cytometry was used to detect the expression of indicated molecules in CD8+ T cells. A: PD-1; B: PRF1; C: Granzyme B (GZMB). D and E: Quantitative real-time polymerase chain reaction was used to detect the mRNA levels in CD8+ T cells (D: PRF1; E: GZMB). The data represent the mean ± SE; aP < 0.05; bP < 0.01; cP < 0.001; dP < 0.0001.
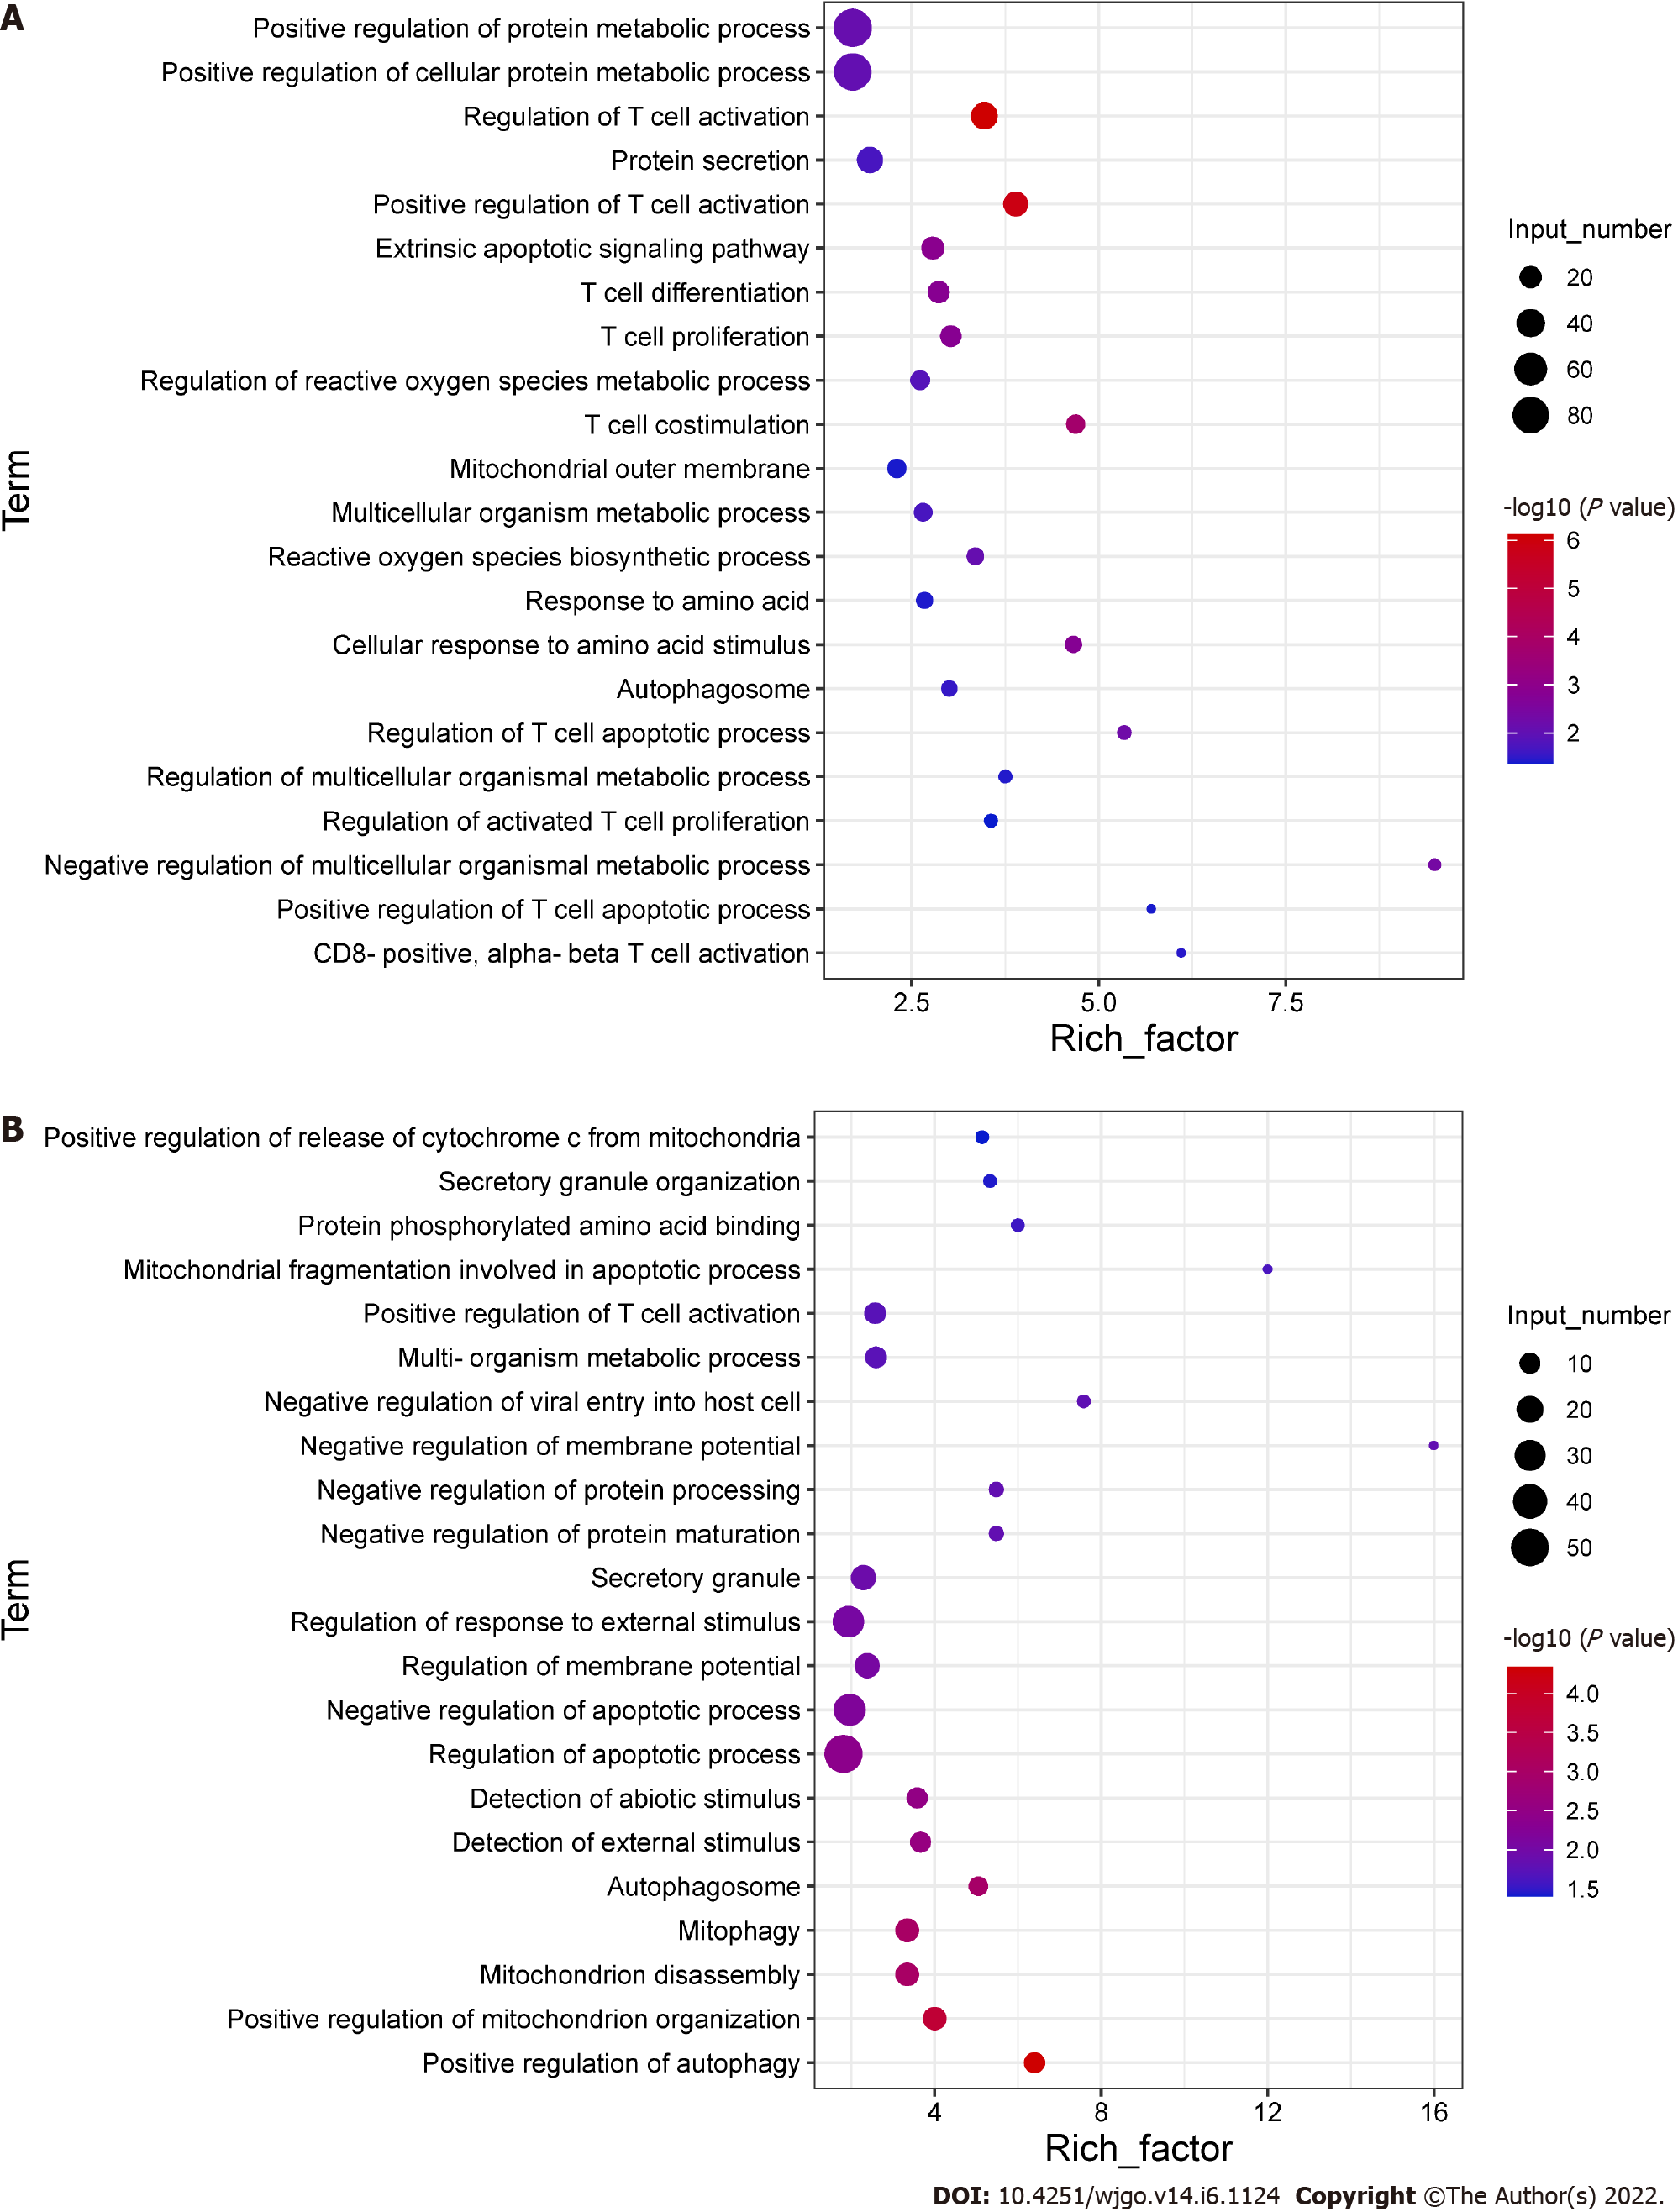
Figure 4 Differential gene expression in CD8+ T cells.
Activated CD8+ T cells were co-cultured with Huh-7 cells for 3 d. Total RNA was extracted from CD8+ T cells for transcriptome sequencing. A: GO enrichment plot of upregulated genes; B: GO enrichment plot of downregulated genes.
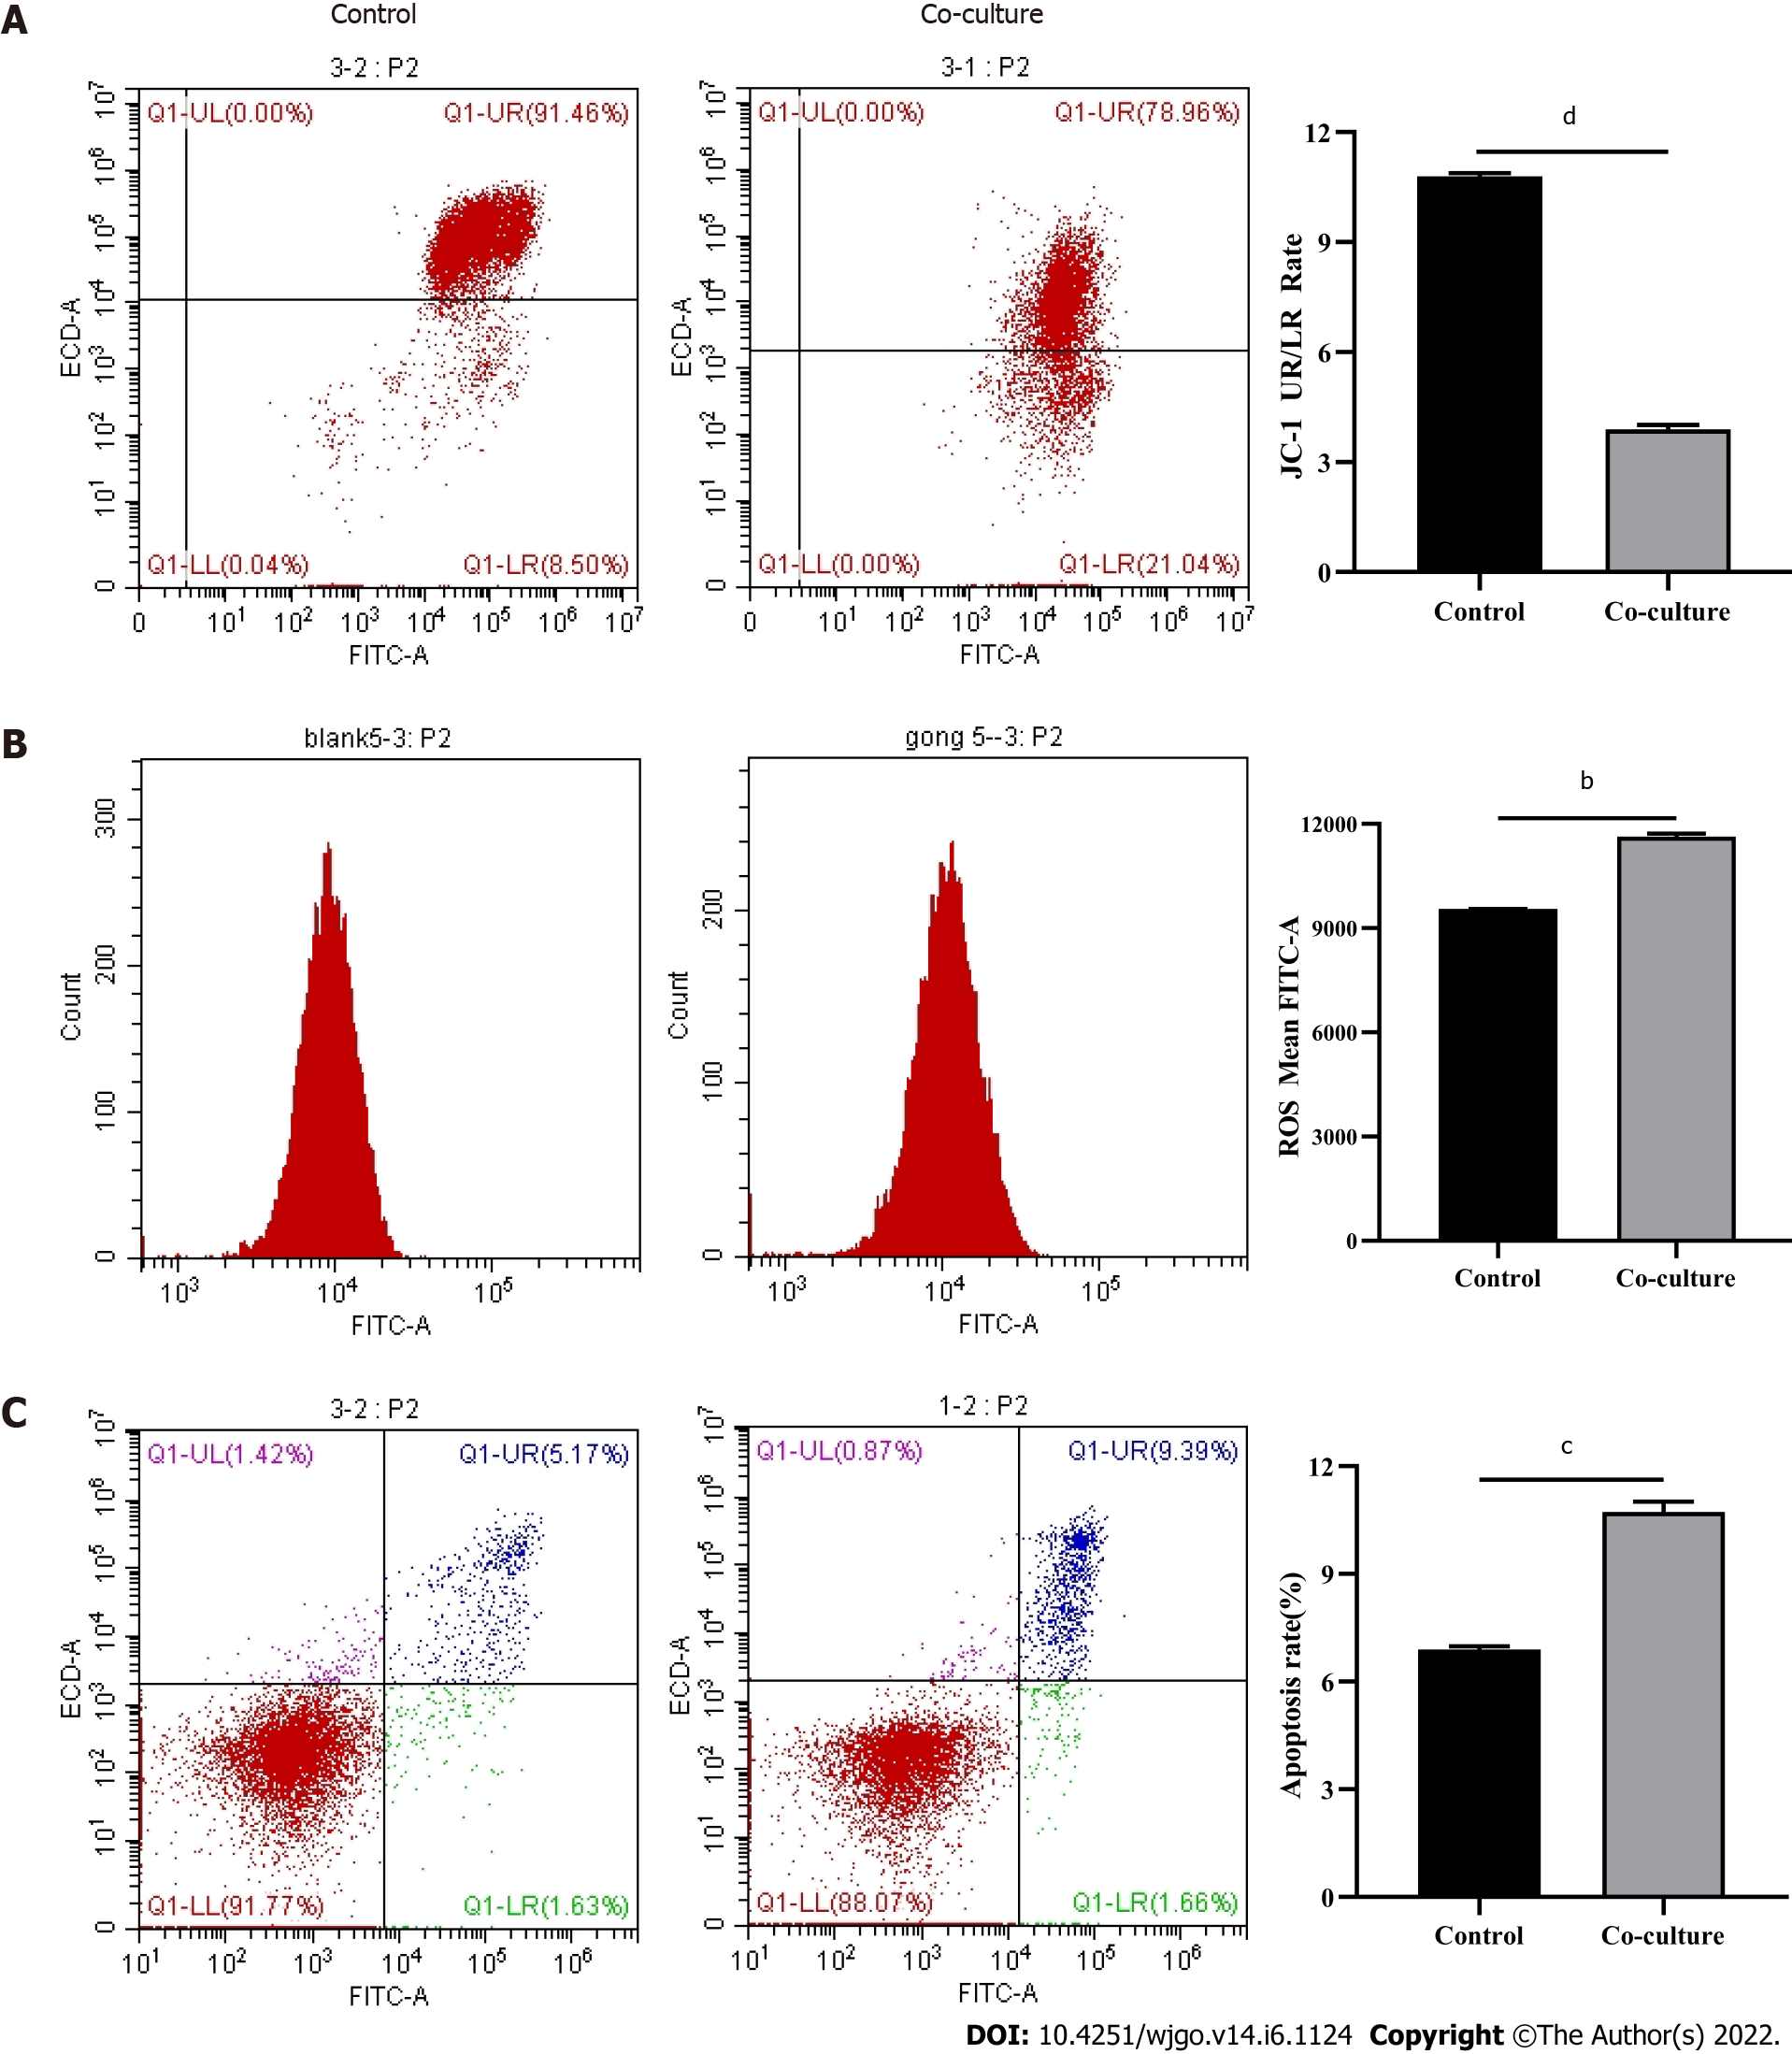
Figure 5 Detection of mitochondrial damage and apoptosis in CD8+ T cells.
Activated CD8+ T cells, co-cultured with Huh-7 cells for 3 d, were detected by flow cytometry. A: JC-1; B: Reactive oxygen species; C: Apoptosis. The data represent the mean ± SE; bP < 0.01; cP < 0.001; dP < 0.0001.
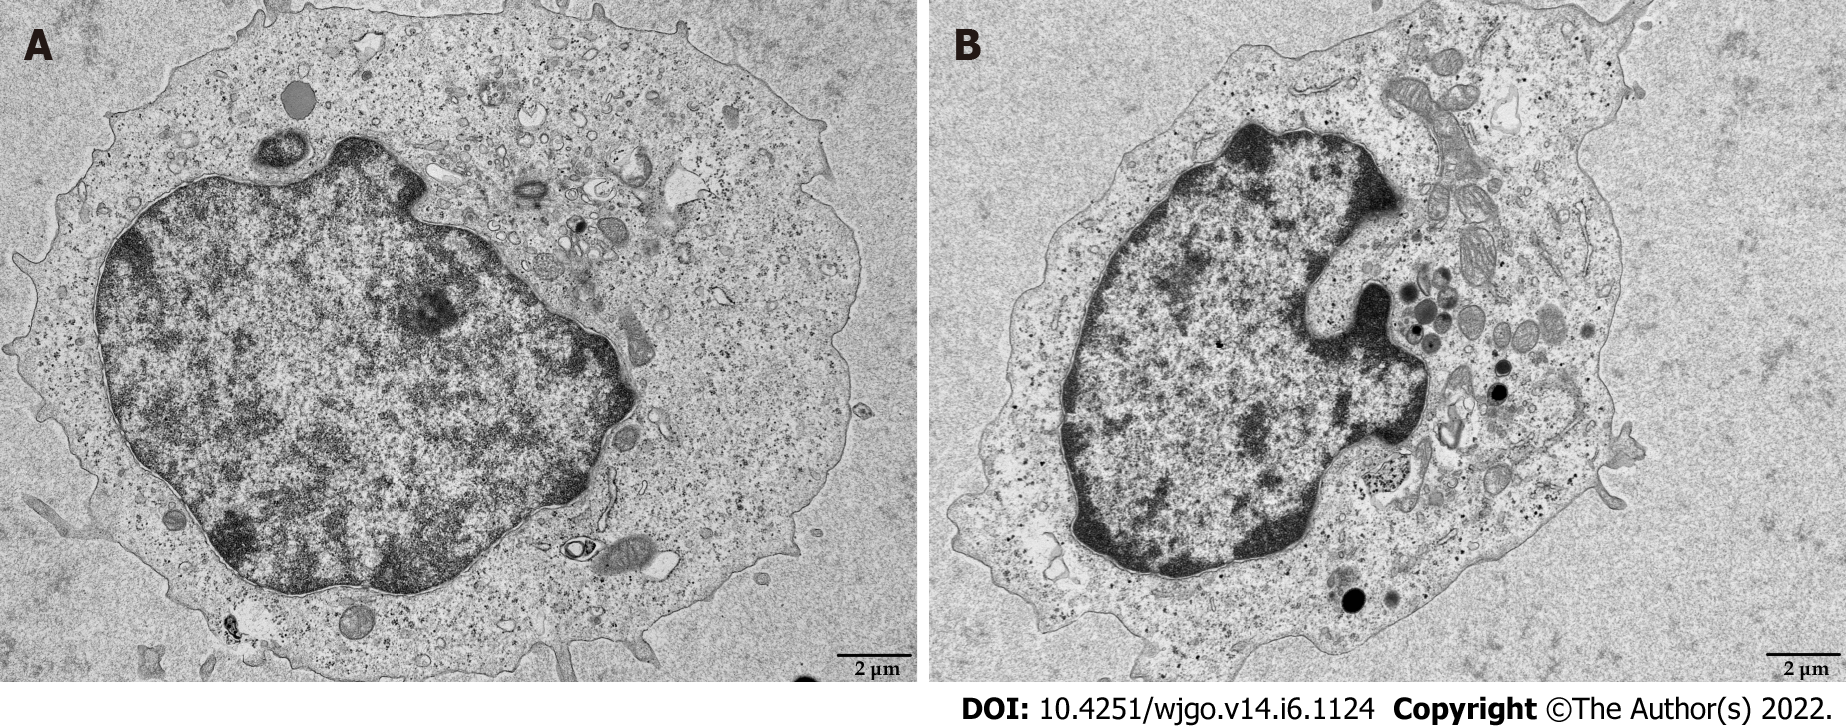
Figure 6 Transmission electron microscopy images of mitochondria in CD8+ T cells.
Activated CD8+ T cells were co-cultured with Huh-7 cells for 3 d. The morphology of mitochondria in CD8+ T cells was detected by transmission electron microscopy. A: Control; B: Co-culture. Scale bar: 2 μm.
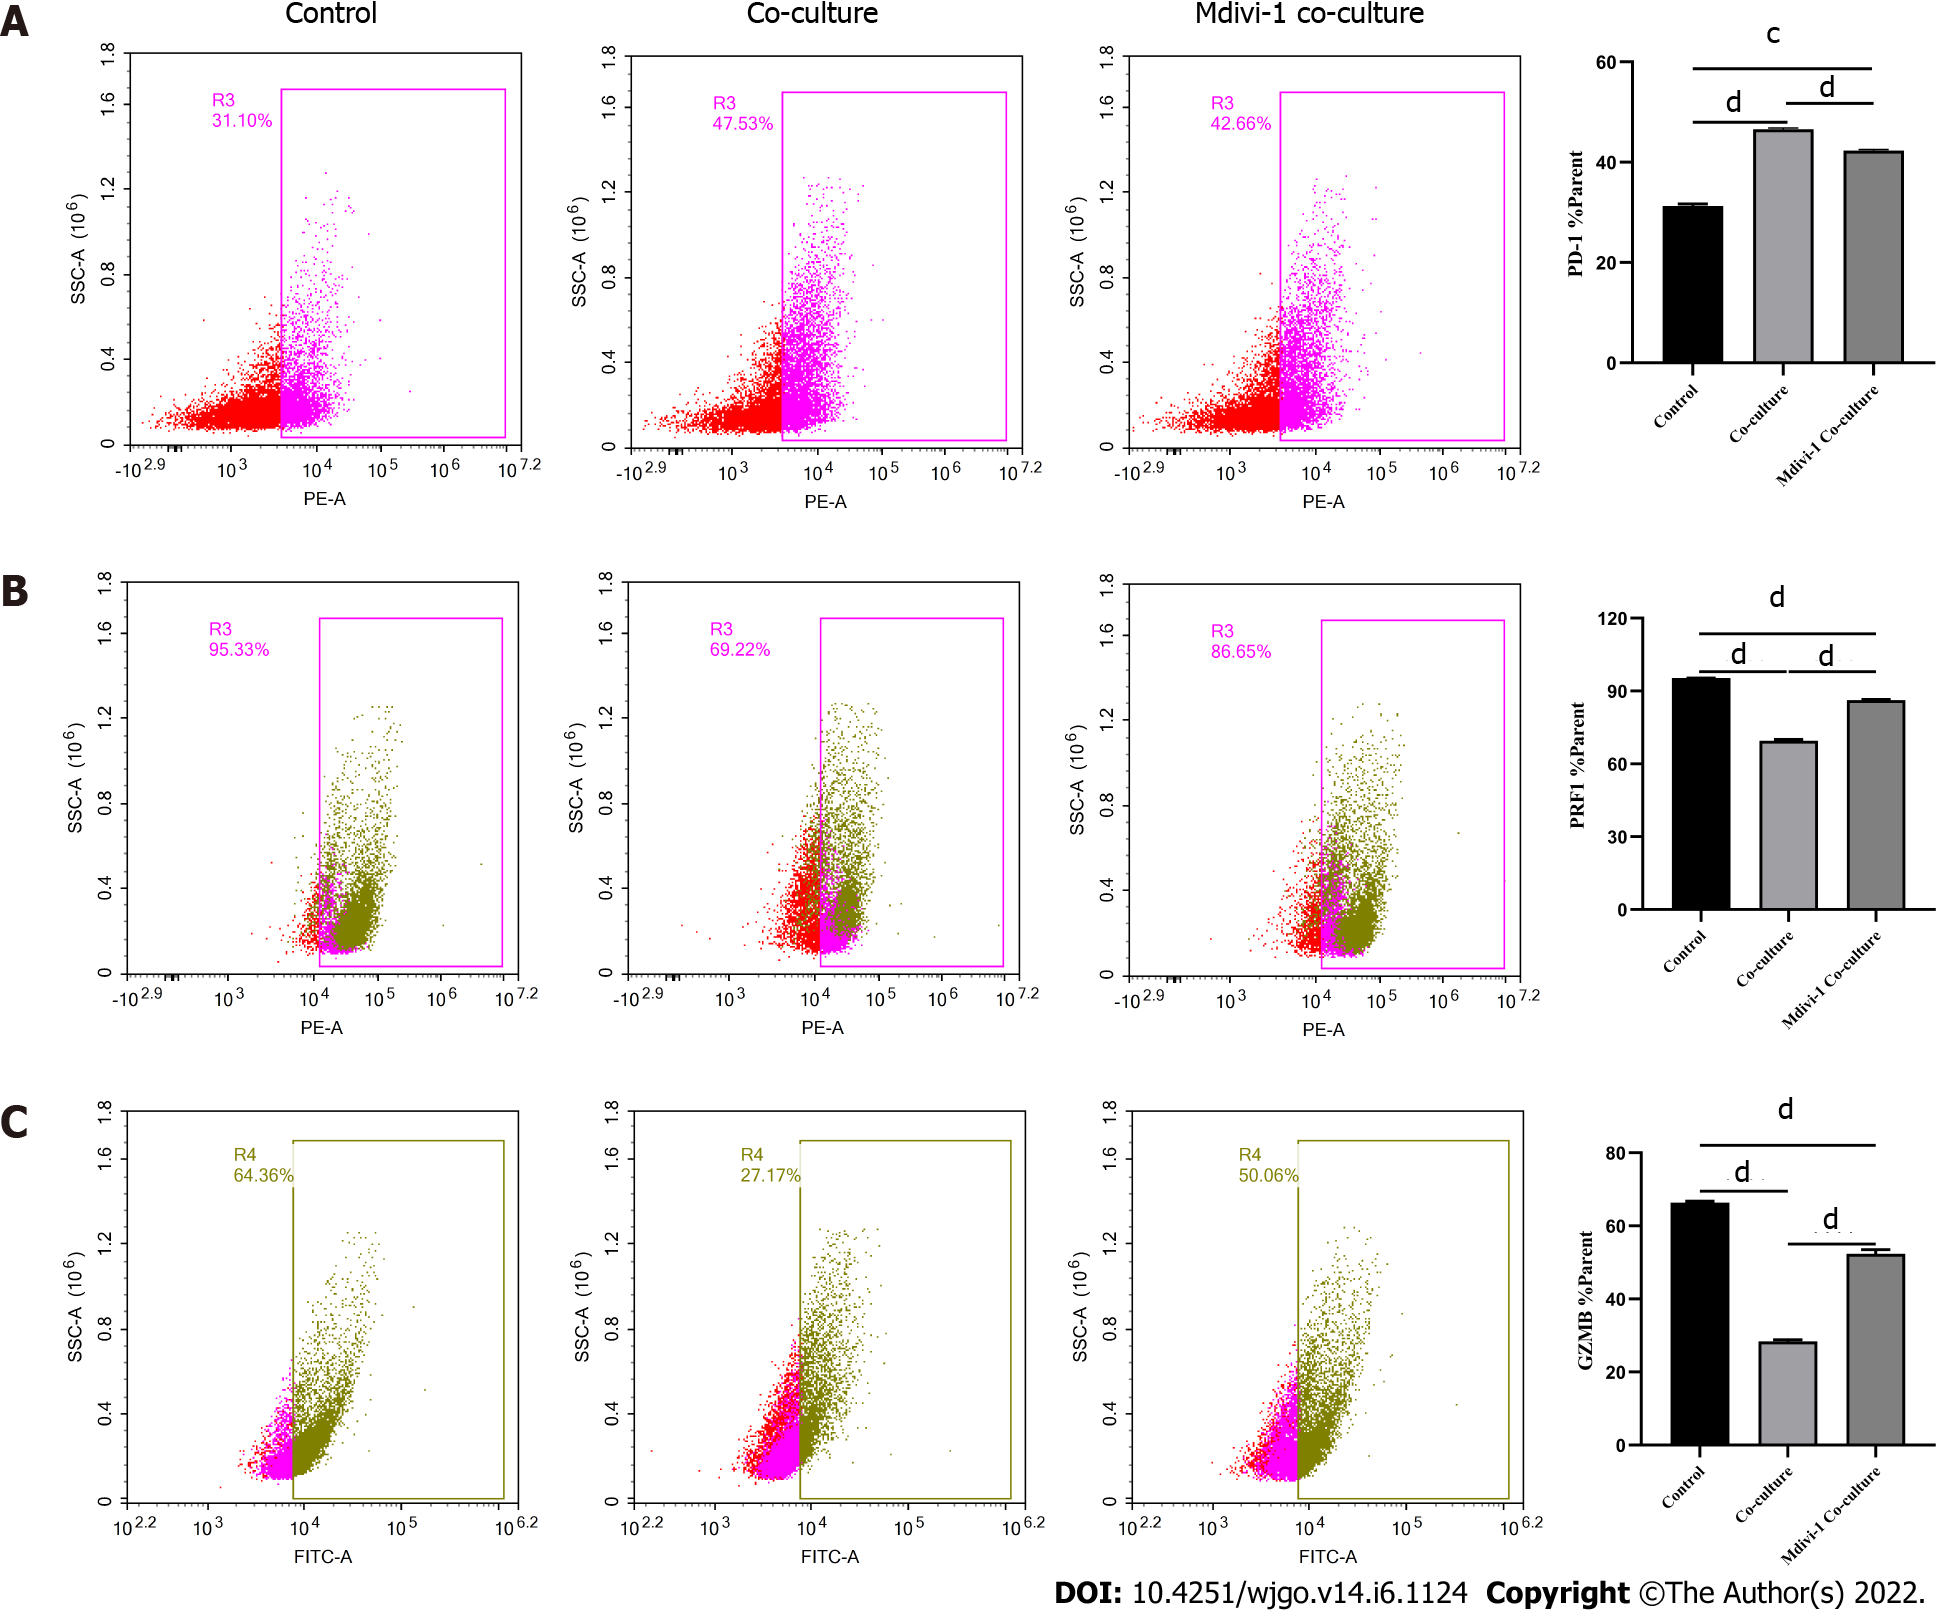
Figure 7 Regulation of CD8+ T cell function by Mdivi-1.
A-C: Activated CD8+ T cells were co-cultured with Huh-7 cells in RPMI 1640 containing 5 μmol/L Mdivi-1 for 3 d. The levels of indicated molecules in CD8+ T cells were detected by flow cytometry. A: PD-1; B: PRF1; C: Granzyme B. The data represent the mean ± SE; cP < 0.001; dP < 0.0001.
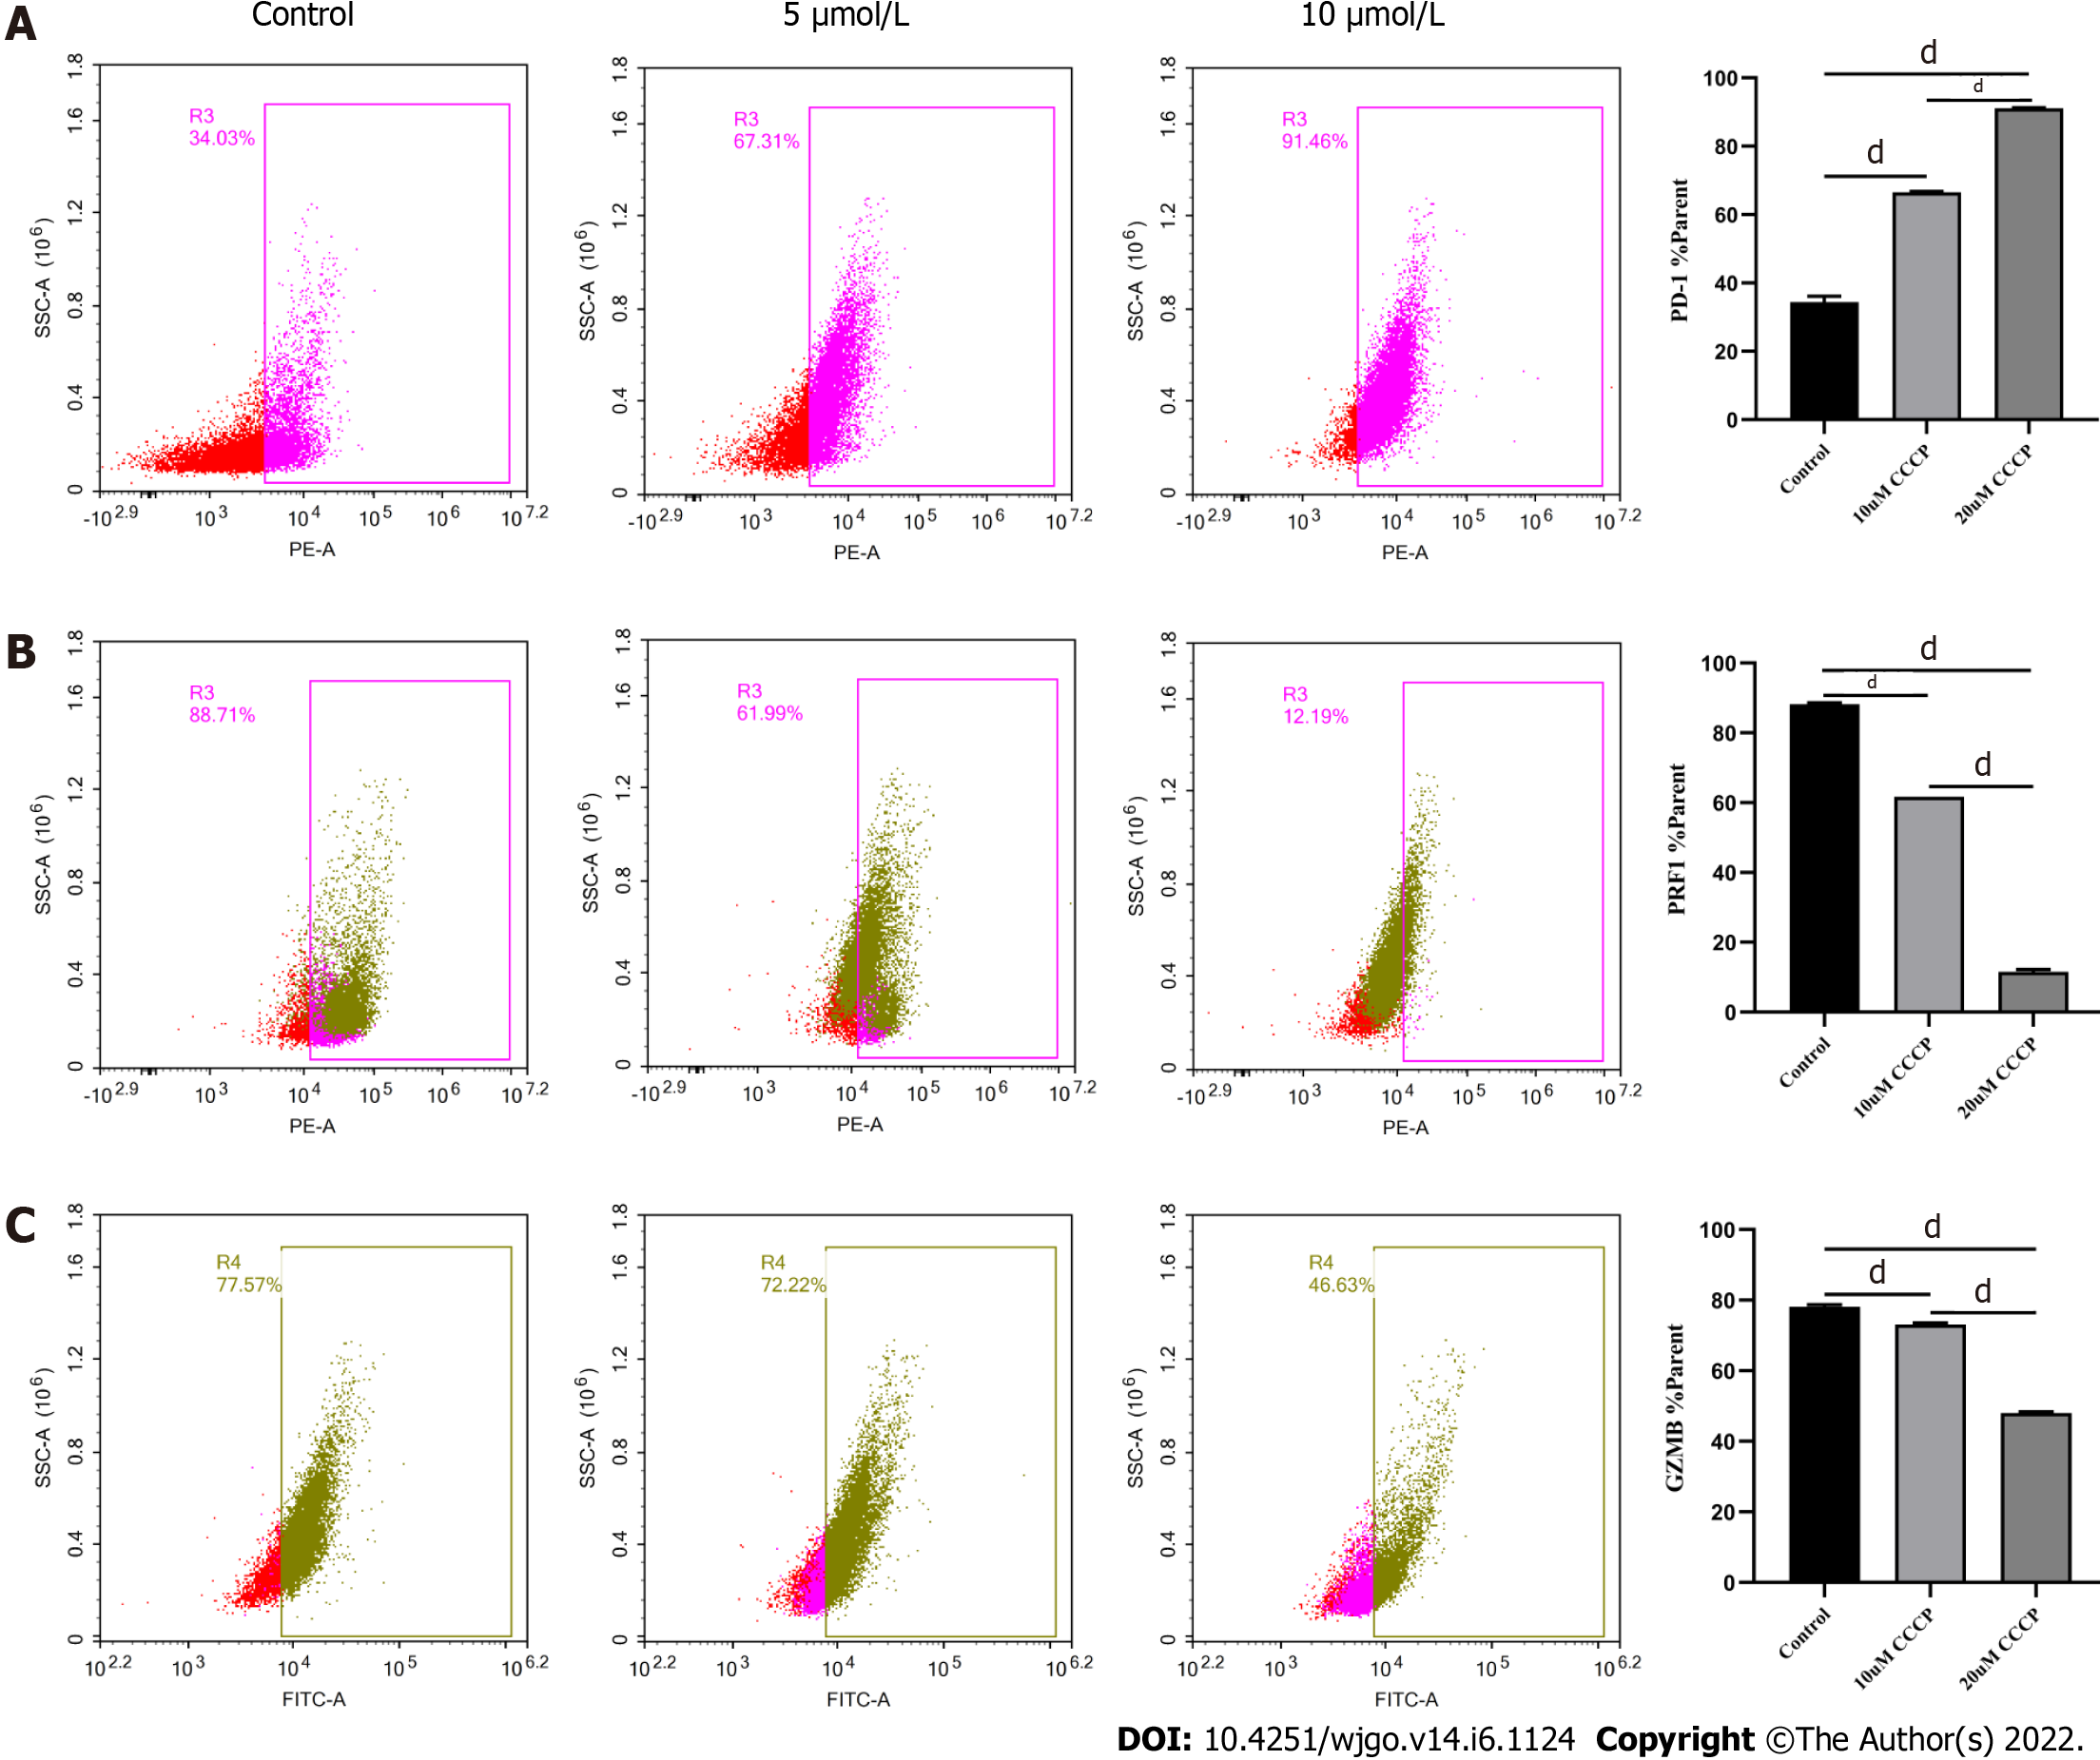
Figure 8 Regulation of CD8+ T cell function by carbonyl cyanide-3-chlorophenylhydrazone.
A-C: Activated CD8+T cells were cultured in RPMI 1640 supplemented with 5 μmol/L or 10 μmol/L carbonyl cyanide-3-chlorophenylhydrazone for 3 d, respectively. The levels of indicated molecules in CD8+ T cells were detected by flow cytometry. A: PD-1; B: PRF1; C: Granzyme B. The data represent the mean ± SE; dP < 0.0001. CCCP: Carbonyl cyanide-3-chlorophenylhydrazone.
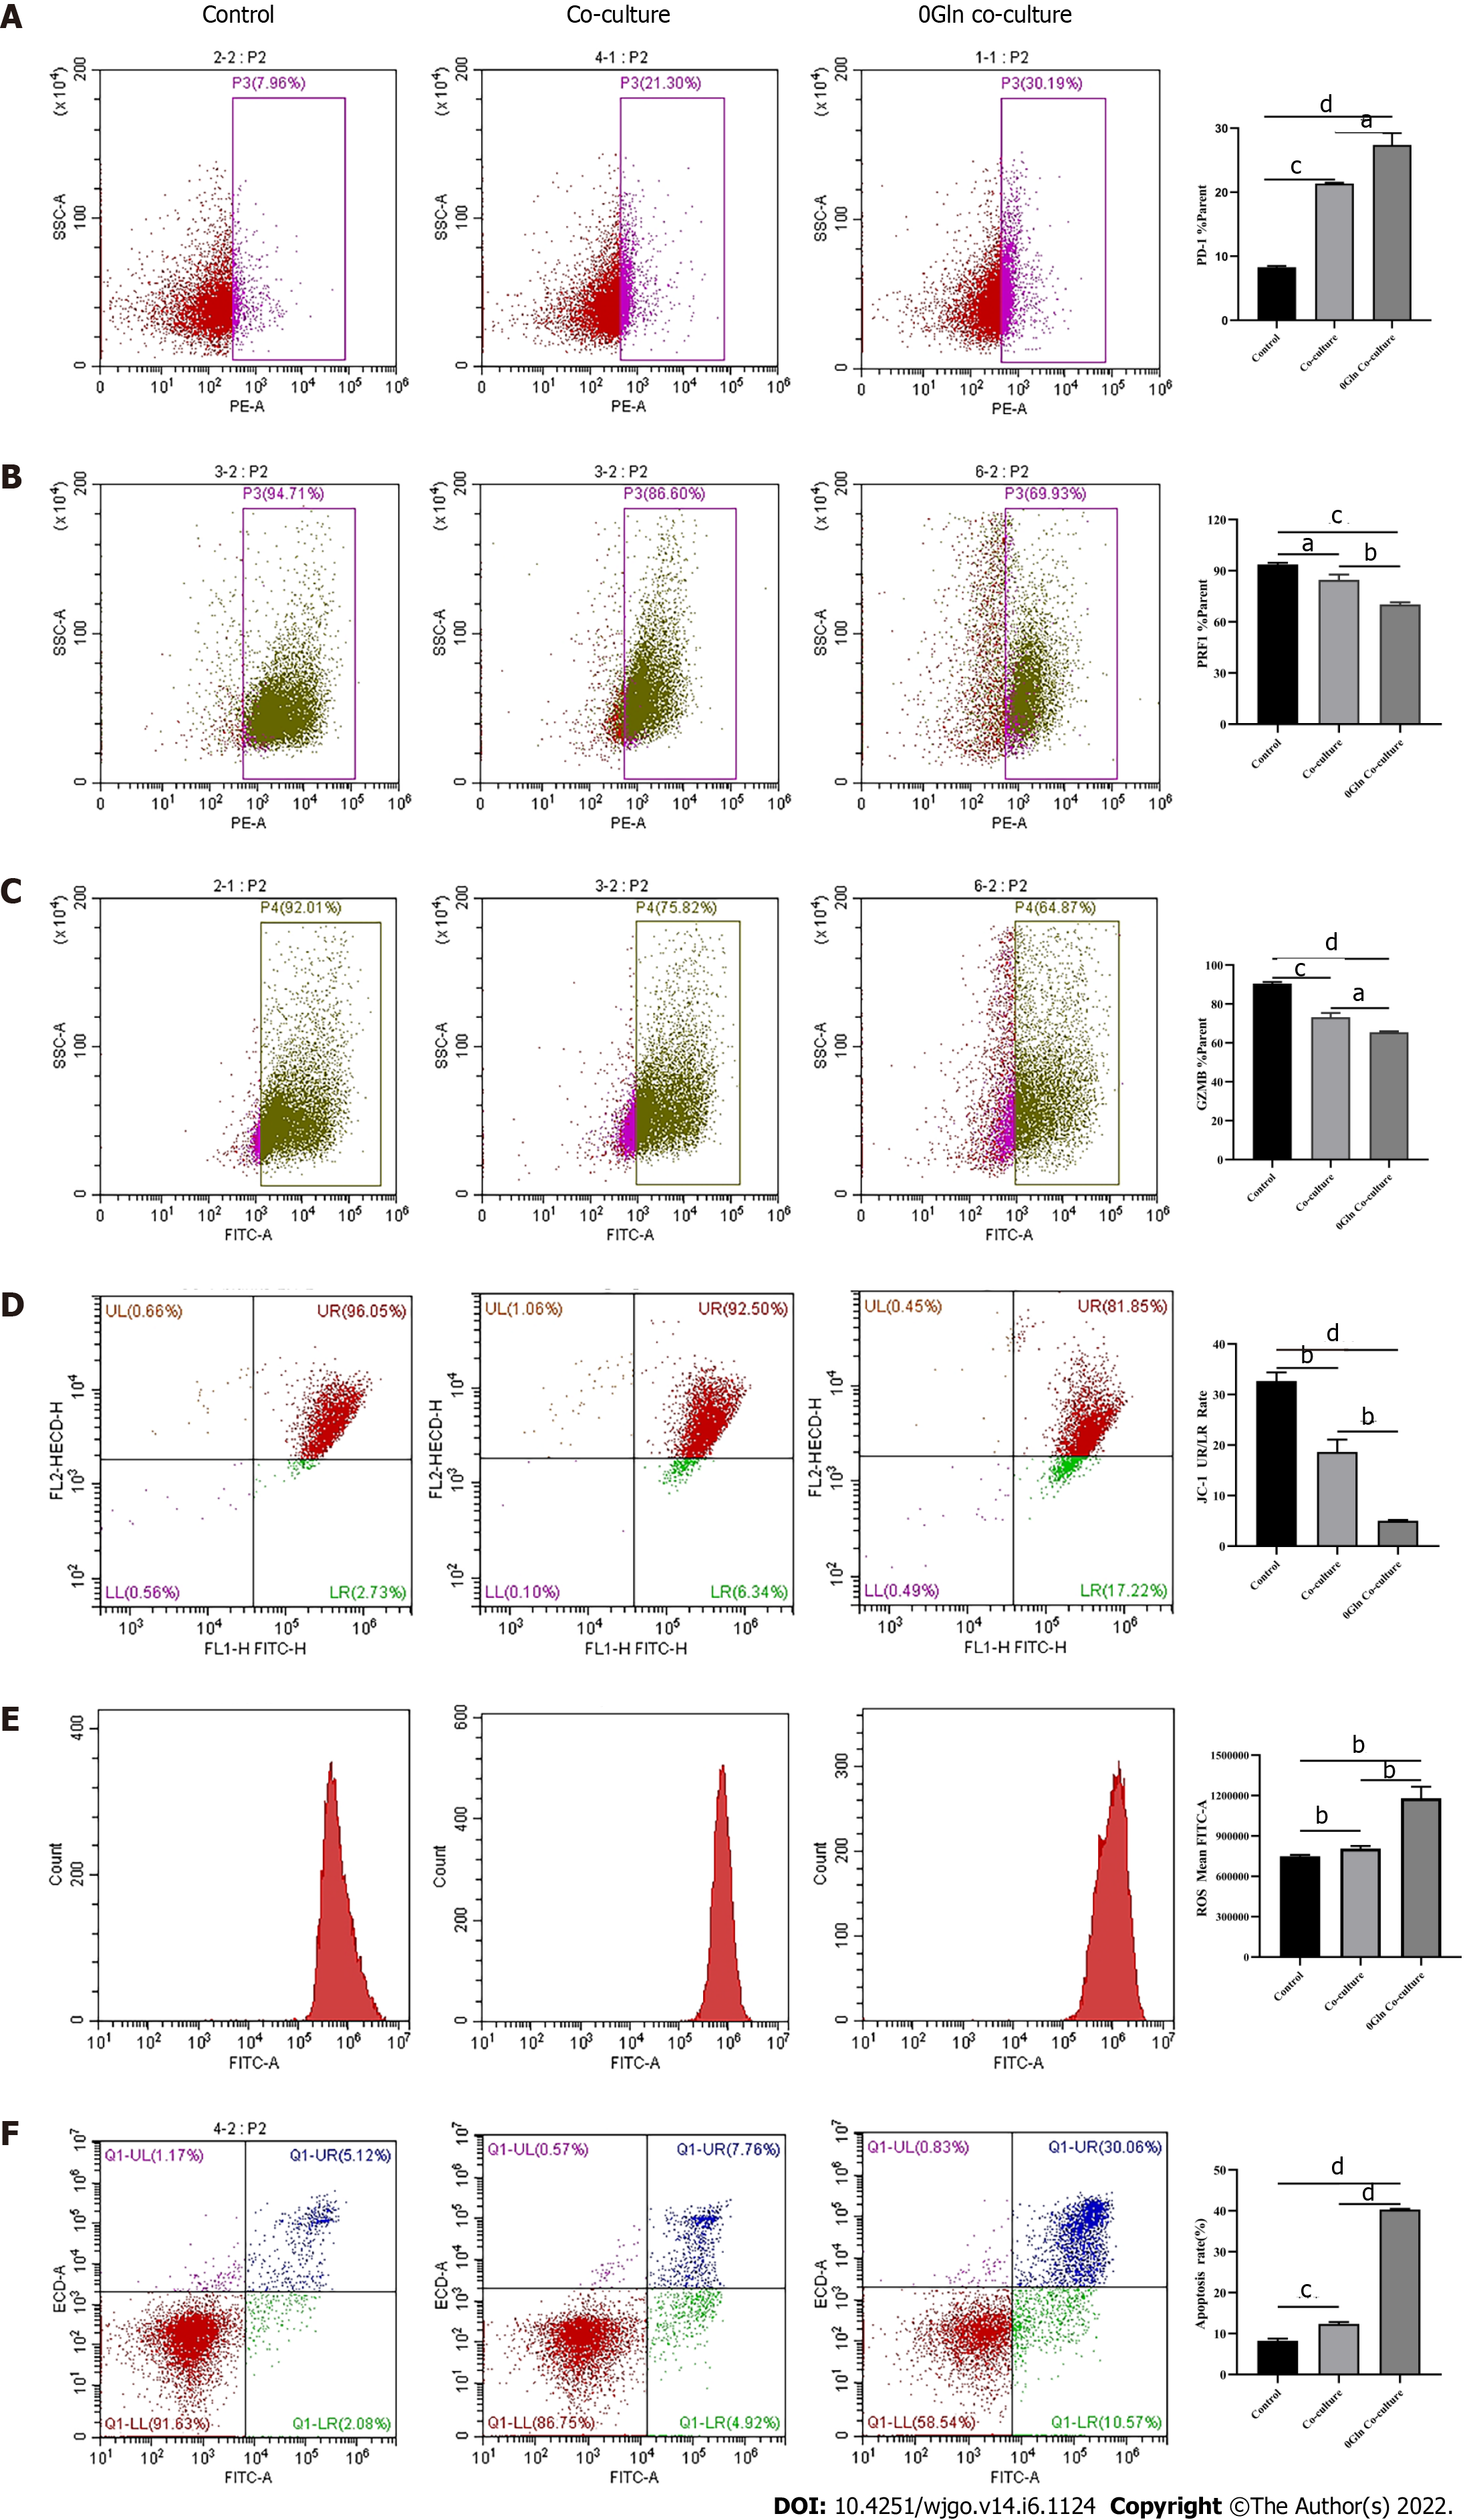
Figure 9 Effect of glutamine deprivation on CD8+ T cells co-cultured with hepatoma cells.
Activated CD8+T cells were co-cultured with Huh-7 cells in RPMI 1640 containing no glutamine (0Gln) for 3 d. The levels of indicated molecules in CD8+ T cells were detected by flow cytometry. A: PD-1; B: PRF1; C: Granzyme B; D: JC-1; E: Reactive oxygen species; F: Apoptosis. The data represent the mean ± SE; aP < 0.05; bP < 0.01; cP < 0.001; dP < 0.0001. Gln: Glutamine.
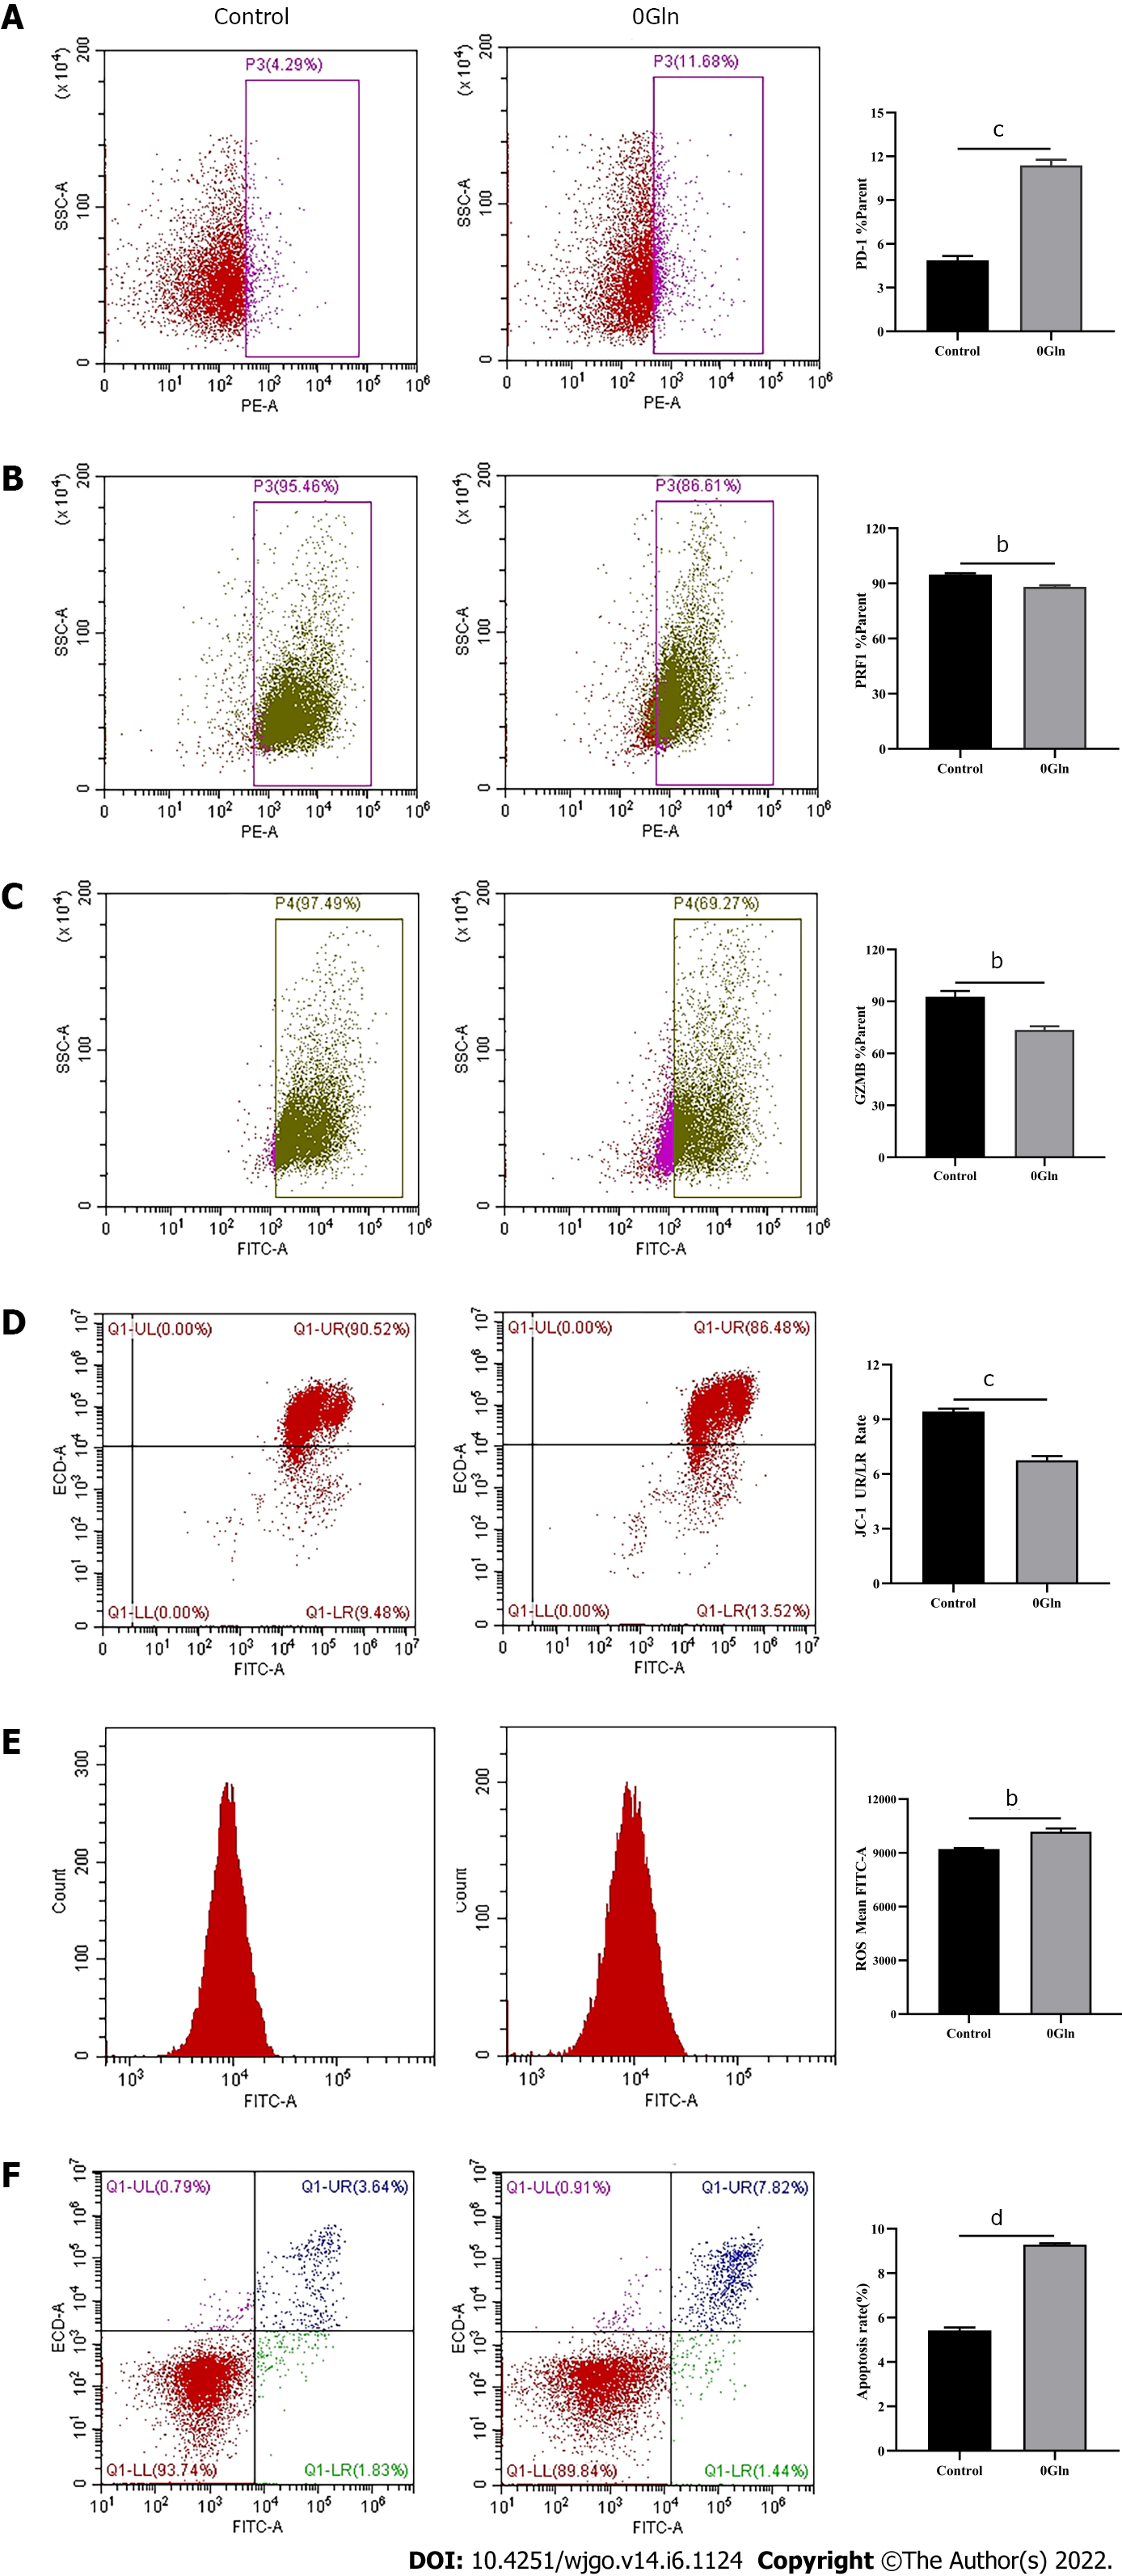
Figure 10 Altered CD8+ T cell function by glutamine deficiency.
Activated CD8+ T cells were cultured in RPMI 1640 containing no glutamine (0Gln) for 3 d. The levels of indicated molecules in CD8+ T cells were detected by flow cytometry. A: PD-1; B: PRF1; C: Granzyme B; D: JC-1; E: Reactive oxygen species; F: Apoptosis. The data represent the mean ± SE; bP < 0.01; cP < 0.001; dP < 0.0001. Gln: Glutamine.
- Citation: Wang W, Guo MN, Li N, Pang DQ, Wu JH. Glutamine deprivation impairs function of infiltrating CD8+ T cells in hepatocellular carcinoma by inducing mitochondrial damage and apoptosis. World J Gastrointest Oncol 2022; 14(6): 1124-1140
- URL: https://www.wjgnet.com/1948-5204/full/v14/i6/1124.htm
- DOI: https://dx.doi.org/10.4251/wjgo.v14.i6.1124


