Copyright
©The Author(s) 2022.
World J Gastrointest Oncol. Mar 15, 2022; 14(3): 703-715
Published online Mar 15, 2022. doi: 10.4251/wjgo.v14.i3.703
Published online Mar 15, 2022. doi: 10.4251/wjgo.v14.i3.703
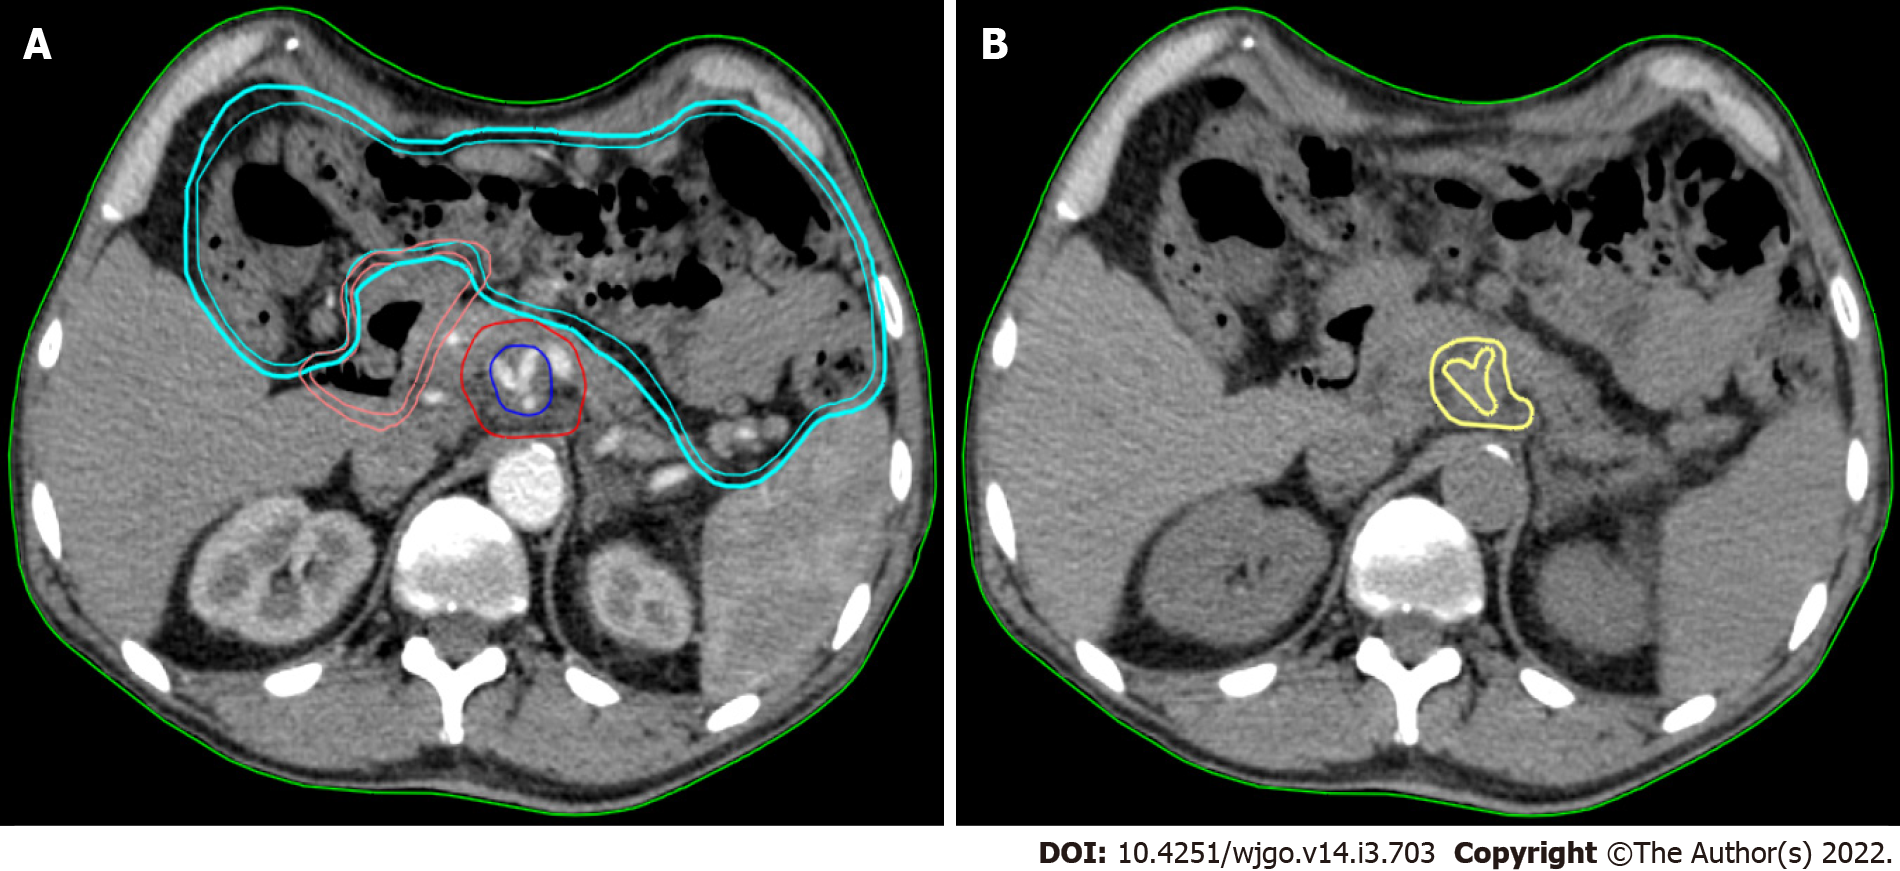
Figure 1 Texture analysis performed using contrast-free simulation computed tomography imaging.
A: Target volumes delineation in a stereotactic ablative radiation therapy case. The high-dose planning target volume (blue) encompasses the tumour-vessel interface (TVI, encasement of celiac axis) inside the tumour planning target volume (PTVt, red). The prescription dose is 30 Gy and 50 Gy in 5 fractions, with simultaneous integrated boost, to PTVt and TVI, respectively. The following organ at risk are shown: duodenum (pink) and bowel (cyan); B: The gross tumour volume (GTV) of the pancreatic lesion without vessels (yellow) is shown in the same axial computed tomography (CT)-simulation image without contrast. This is the final CT used for analysis.
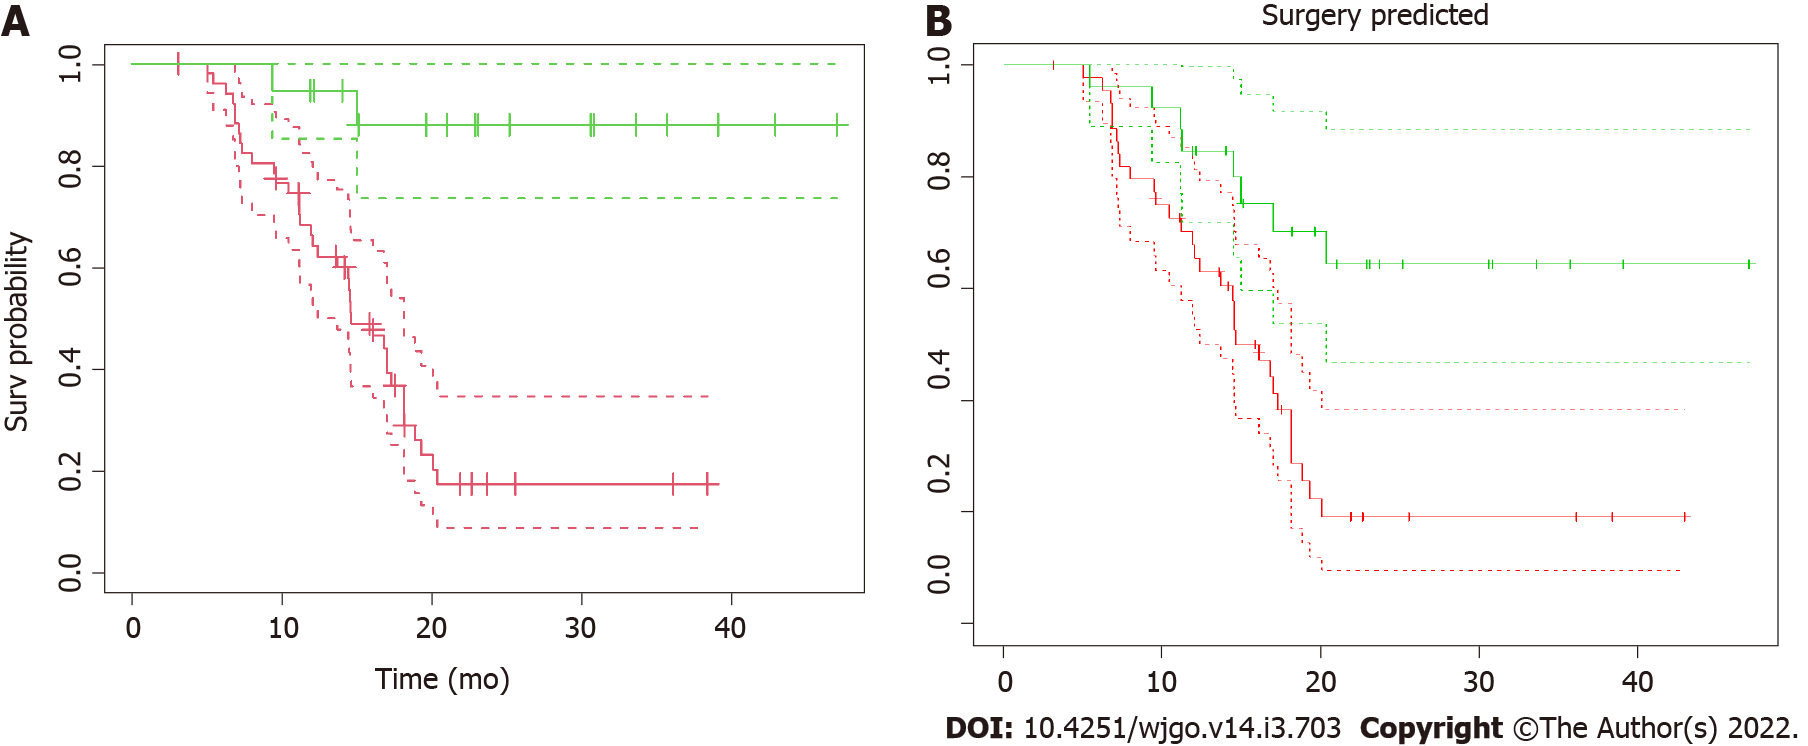
Figure 2 Kaplan–Meier overall survival.
A: Kaplan–Meier overall survival (OS) as a function of surgical resection. Patients were stratified according to resectability status and OS curves from radiotherapy for resected (green line) vs non-resected (red line) and their confidence intervals (dotted lines) were plotted. The median OS from radiation therapy for resected patients has not been reached, compared to 14.6 mo (CI: 12.4-18.1 mo) of non-resected patients (P < 0.001); B: Kaplan–Meier OS as a function of surgical resection as predicted by the model. The “predicted” OS curves from radiotherapy for resected (green line) vs non-resected (red line) patients and their confidence intervals (dotted lines) showed here were obtained applying the model to the dataset to predict the resectability status. The two curves are significantly different (P < 0.001).
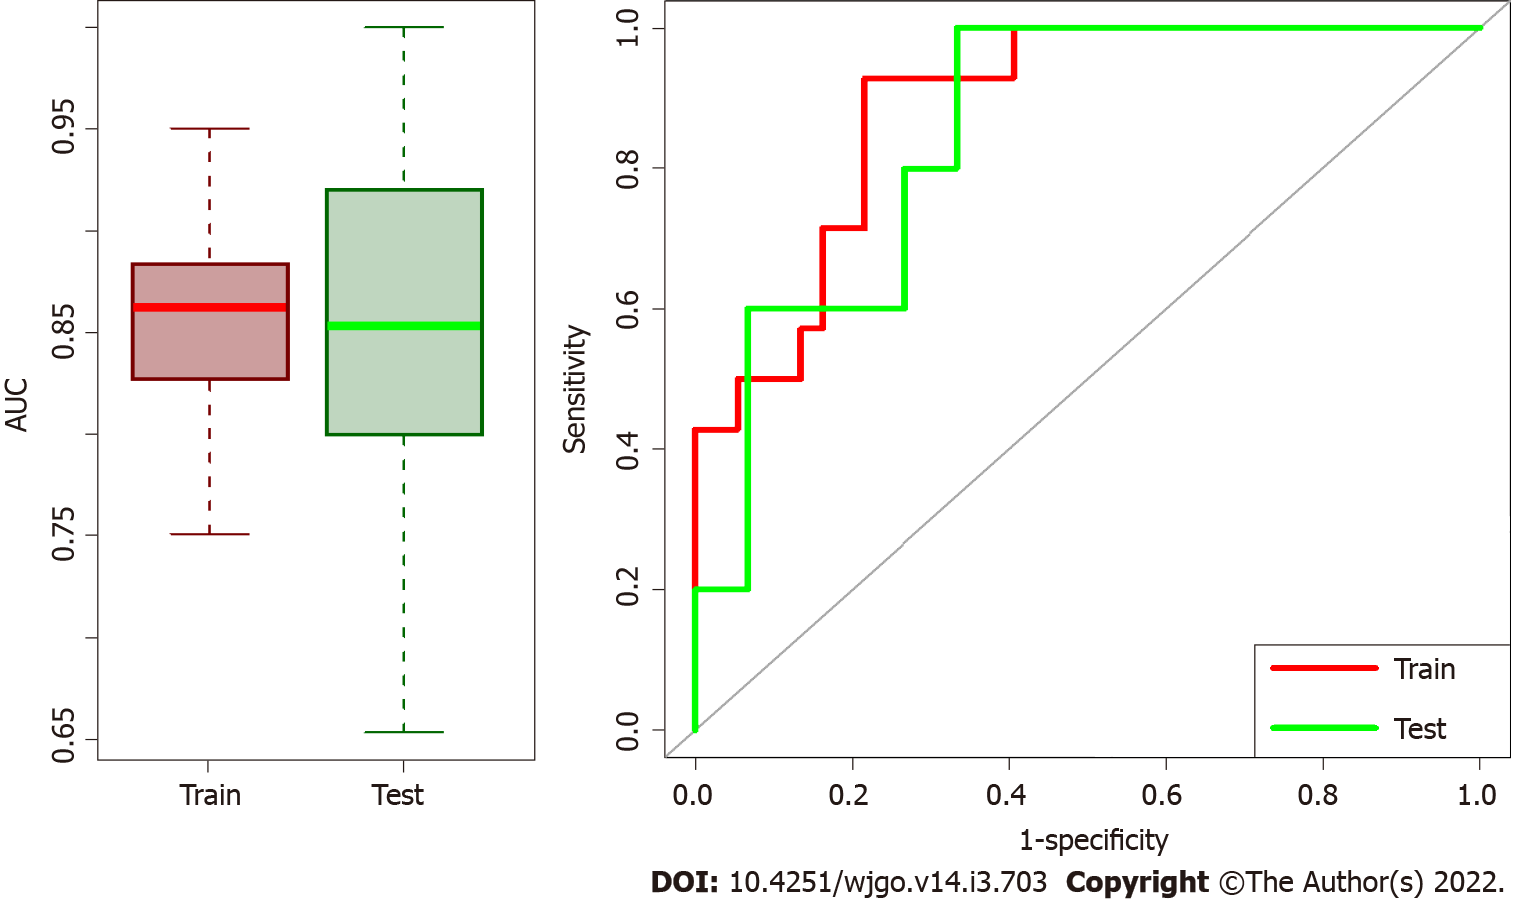
Figure 3 Box plots of area under the receiver operating characteristic curve distributions and receiver operating characteristic curves for test/train datasets.
The first part of training model and validation was repeated 100 times and Box plots of area under the receiver operating characteristic (ROC) curve (AUC) distributions for test/train datasets are represented on the left side. Median AUC both for train and validation sets are higher than 0.85 meaning that the model has high performance in both datasets. On the right the ROC curves of the median solution among the repetitions both for train and validation test are shown.
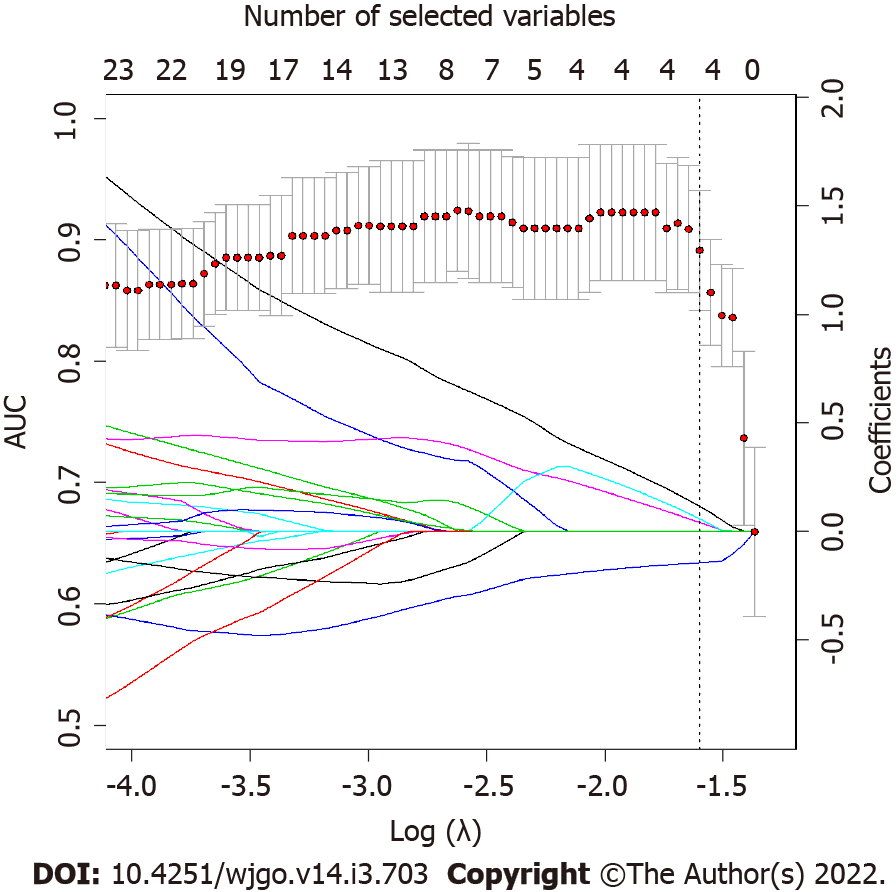
Figure 4 LASSO regression coefficients and area under the receiver operating characteristic curve as function of lambda parameter.
LASSO regression coefficients for each variable (represented by continuous lines, each line is a variable that are imposed to reach zero by LASSO regression as lambda increases) and area under the receiver operating characteristic curve (AUC) as function of Log(λ) are superimposed. Dotted line represents the best lambda parameters that corresponds to the value at one standard deviation after the lambda that maximize AUC. As it is possible to notice, the best lambda value corresponds to four variables selected by LASSO.
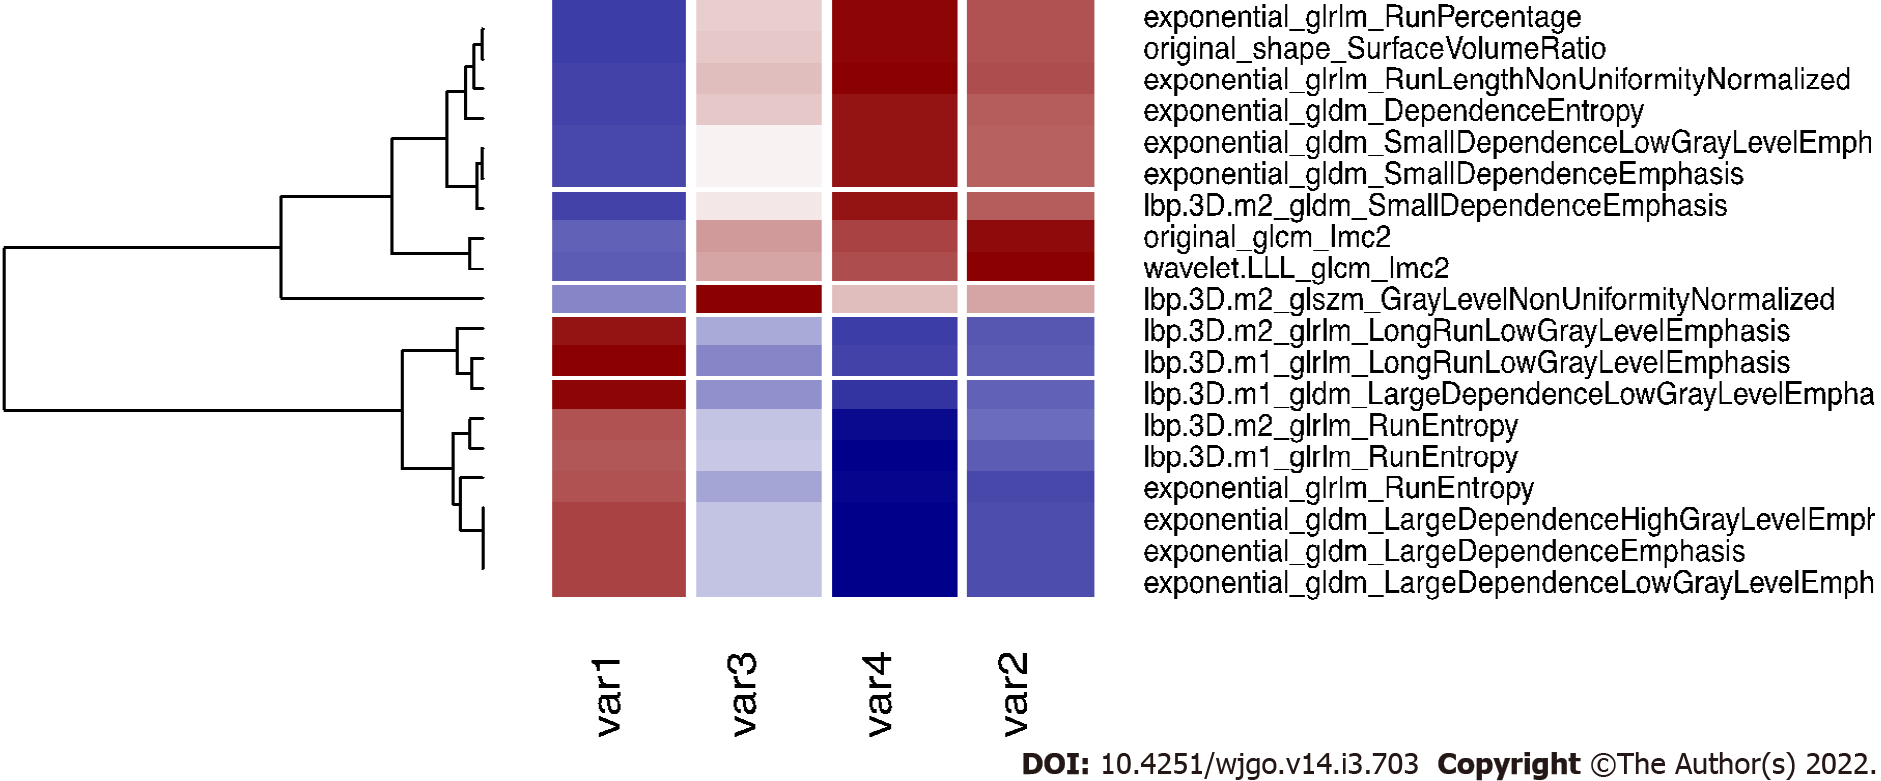
Figure 5 Correlation plot of the selected variables and other significant features.
The four selected variables (named var1, var2, var3 and var4 for simplicity, please refers to the end of this caption for the correspondence with variable names), are correlated (r > 0.9) with other variables that are rejected for further analysis. Here we report the correlated variables as reference for further studies that could find significant features correlated with our variables. Var1: Lbp.3D.m1_glrlm_LongRunLowGrayLevelEmphasis; Var2: Wavelet.LLL_glcm_Imc2; Var3: Lbp.3D.m2_glszm_GrayLevelNonUniformityNormalized; Var4: Exponential_glrlm_RunLengthNonUniformityNormalized.
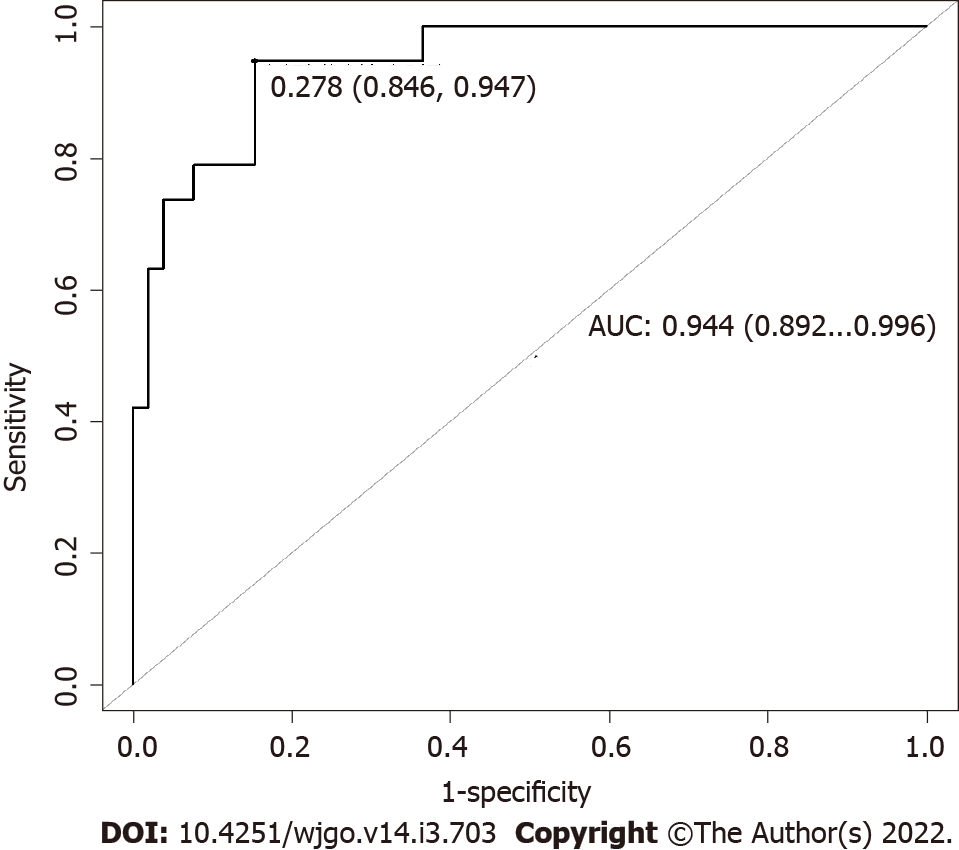
Figure 6 Area under the receiver operating characteristic curve obtained for the model applied on the entire dataset.
To test the performance of our model in the entire dataset, area under the receiver operating characteristic curve obtained applying the model to the entire dataset was computed and represented here. AUC: Area under the receiver operating characteristic curve.
- Citation: Rossi G, Altabella L, Simoni N, Benetti G, Rossi R, Venezia M, Paiella S, Malleo G, Salvia R, Guariglia S, Bassi C, Cavedon C, Mazzarotto R. Computed tomography-based radiomic to predict resectability in locally advanced pancreatic cancer treated with chemotherapy and radiotherapy. World J Gastrointest Oncol 2022; 14(3): 703-715
- URL: https://www.wjgnet.com/1948-5204/full/v14/i3/703.htm
- DOI: https://dx.doi.org/10.4251/wjgo.v14.i3.703


