Copyright
©The Author(s) 2022.
World J Gastrointest Oncol. Mar 15, 2022; 14(3): 678-689
Published online Mar 15, 2022. doi: 10.4251/wjgo.v14.i3.678
Published online Mar 15, 2022. doi: 10.4251/wjgo.v14.i3.678
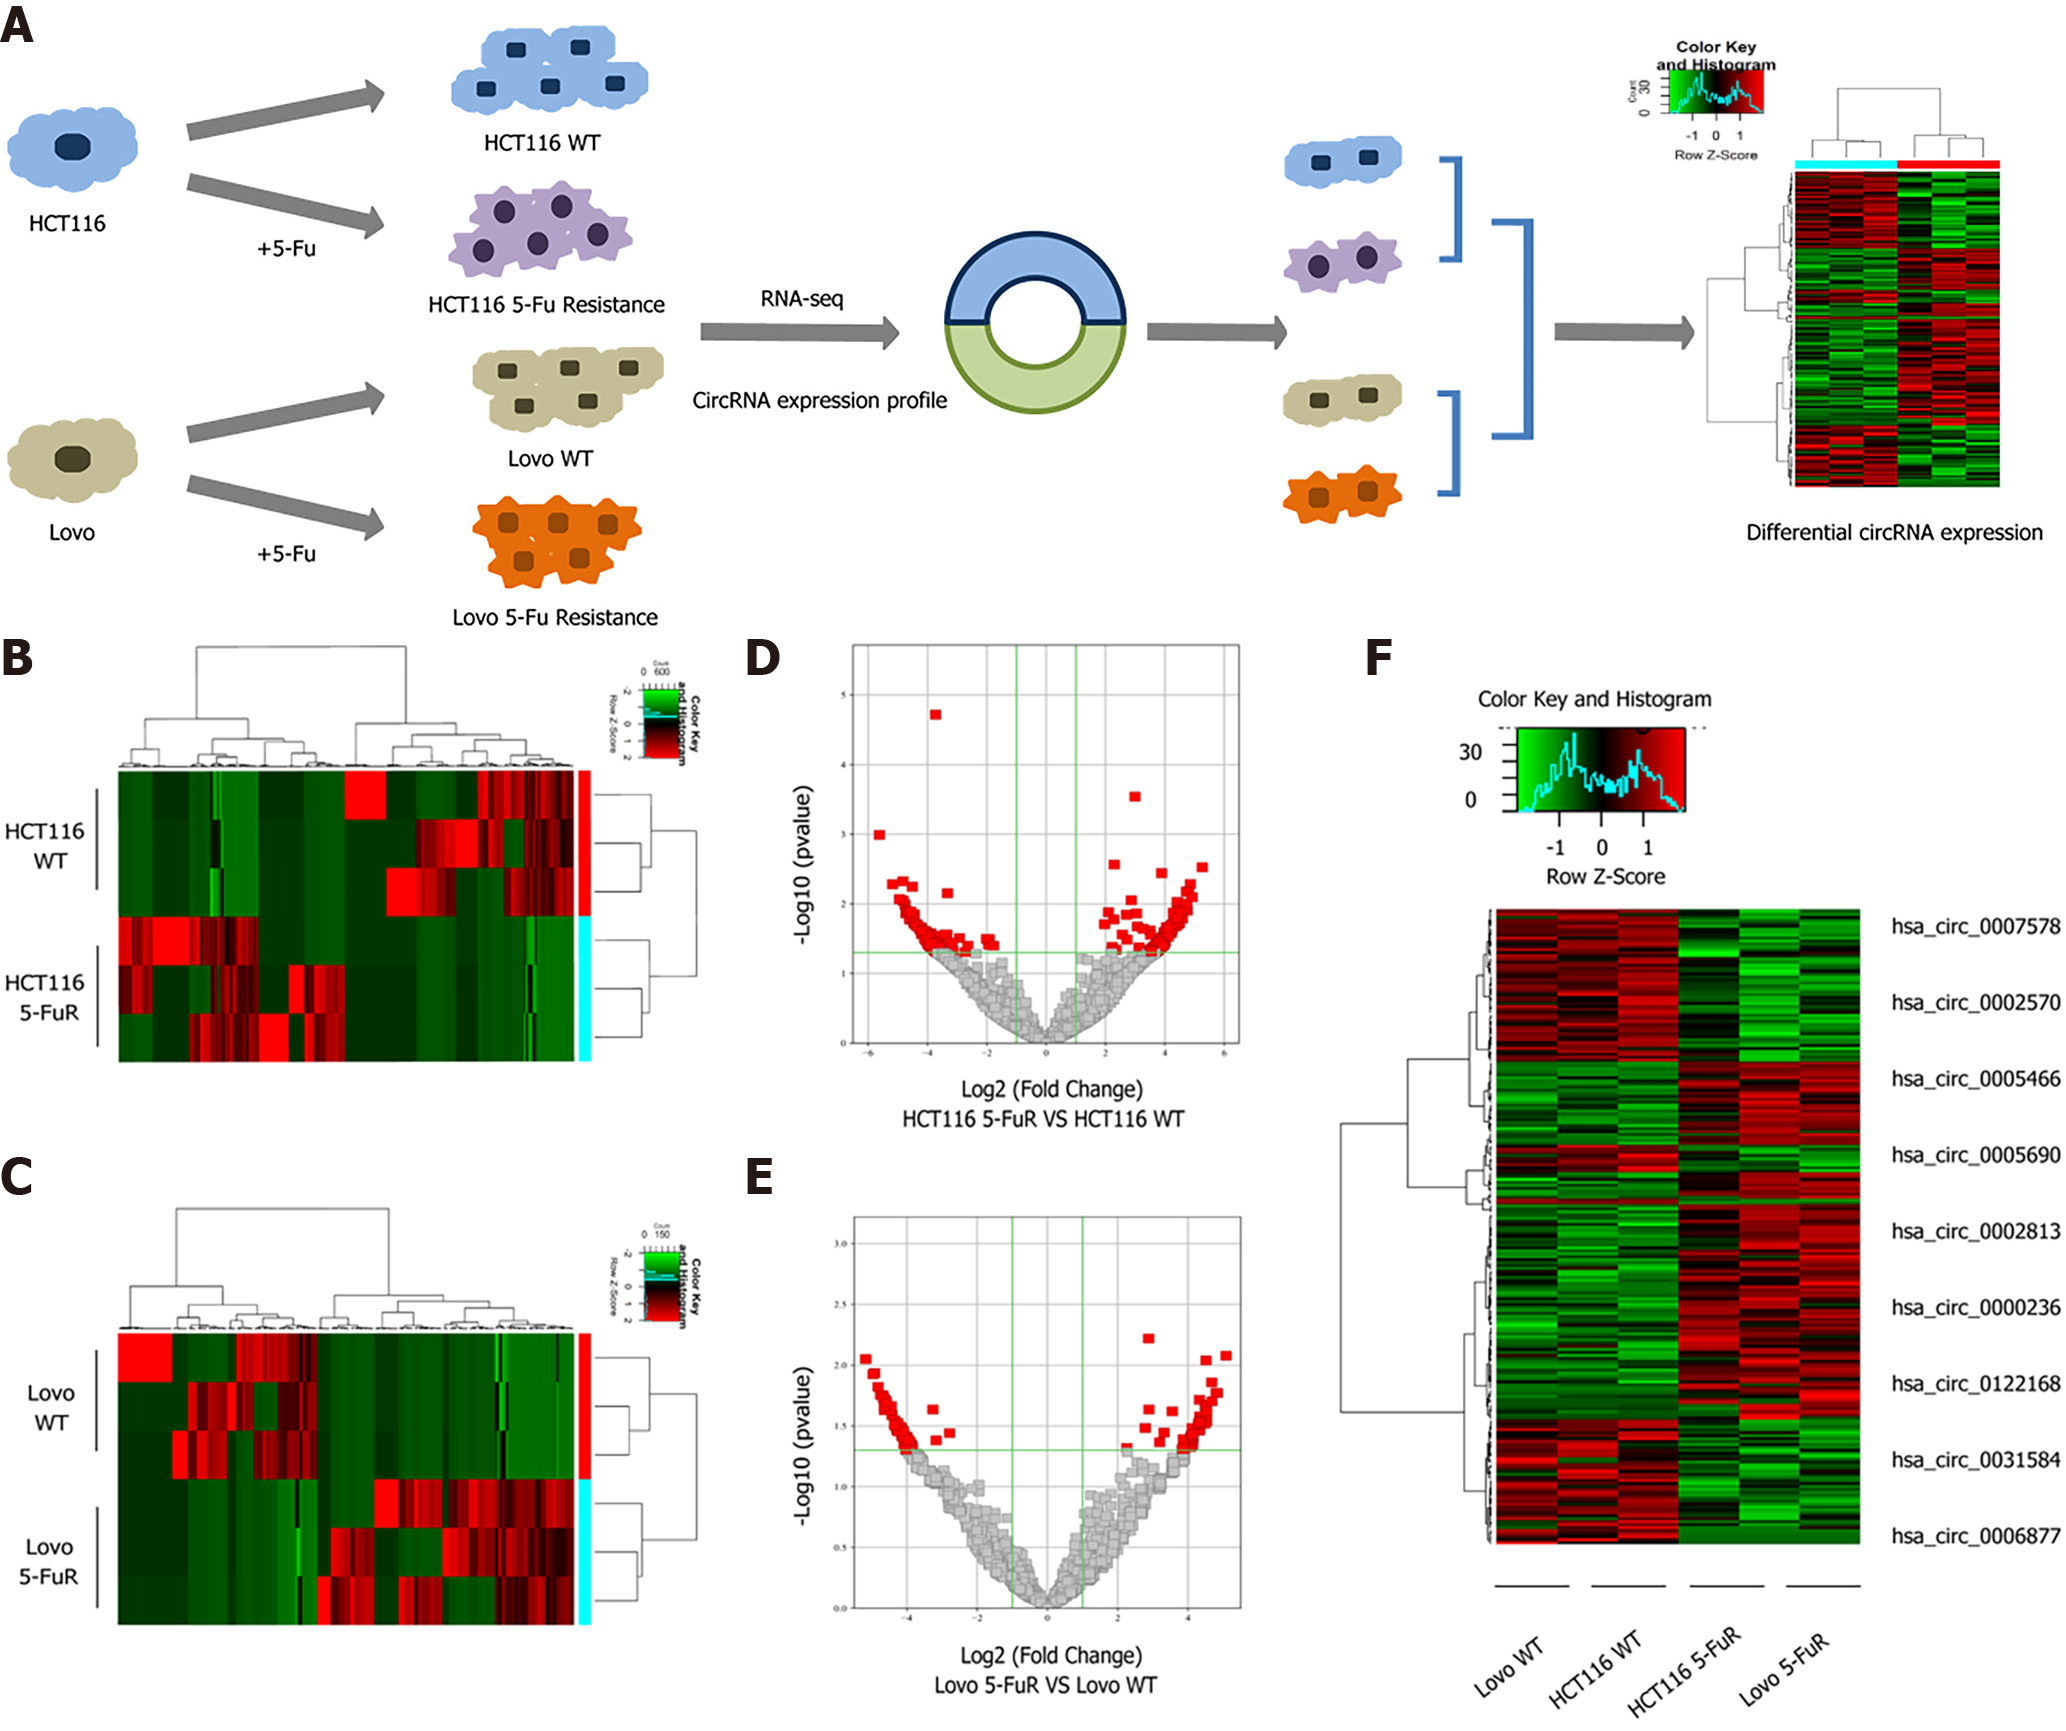
Figure 1 Changes in the expression profiles of significantly differentially expressed mRNAs and circular RNAs in 5-fluorouracil-resistant cells and their parental cells.
A: Flow chart of the sequencing analysis; B and C: Clustered heat map indicating differences in circular RNA (circRNA) expression profiling between the HCT116 and HCT116 5-fluorouracil (5-Fu) resistant cell lines and the Lovo and Lovo 5-Fu resistant cell lines; D and E: The volcano plot shows the comparison of the circRNA expression profiles between the parental and 5-Fu resistant HCT116 and Lovo cell lines; F: Clustered heat map indicating differences in circRNA expression profiling in both paired cell lines.
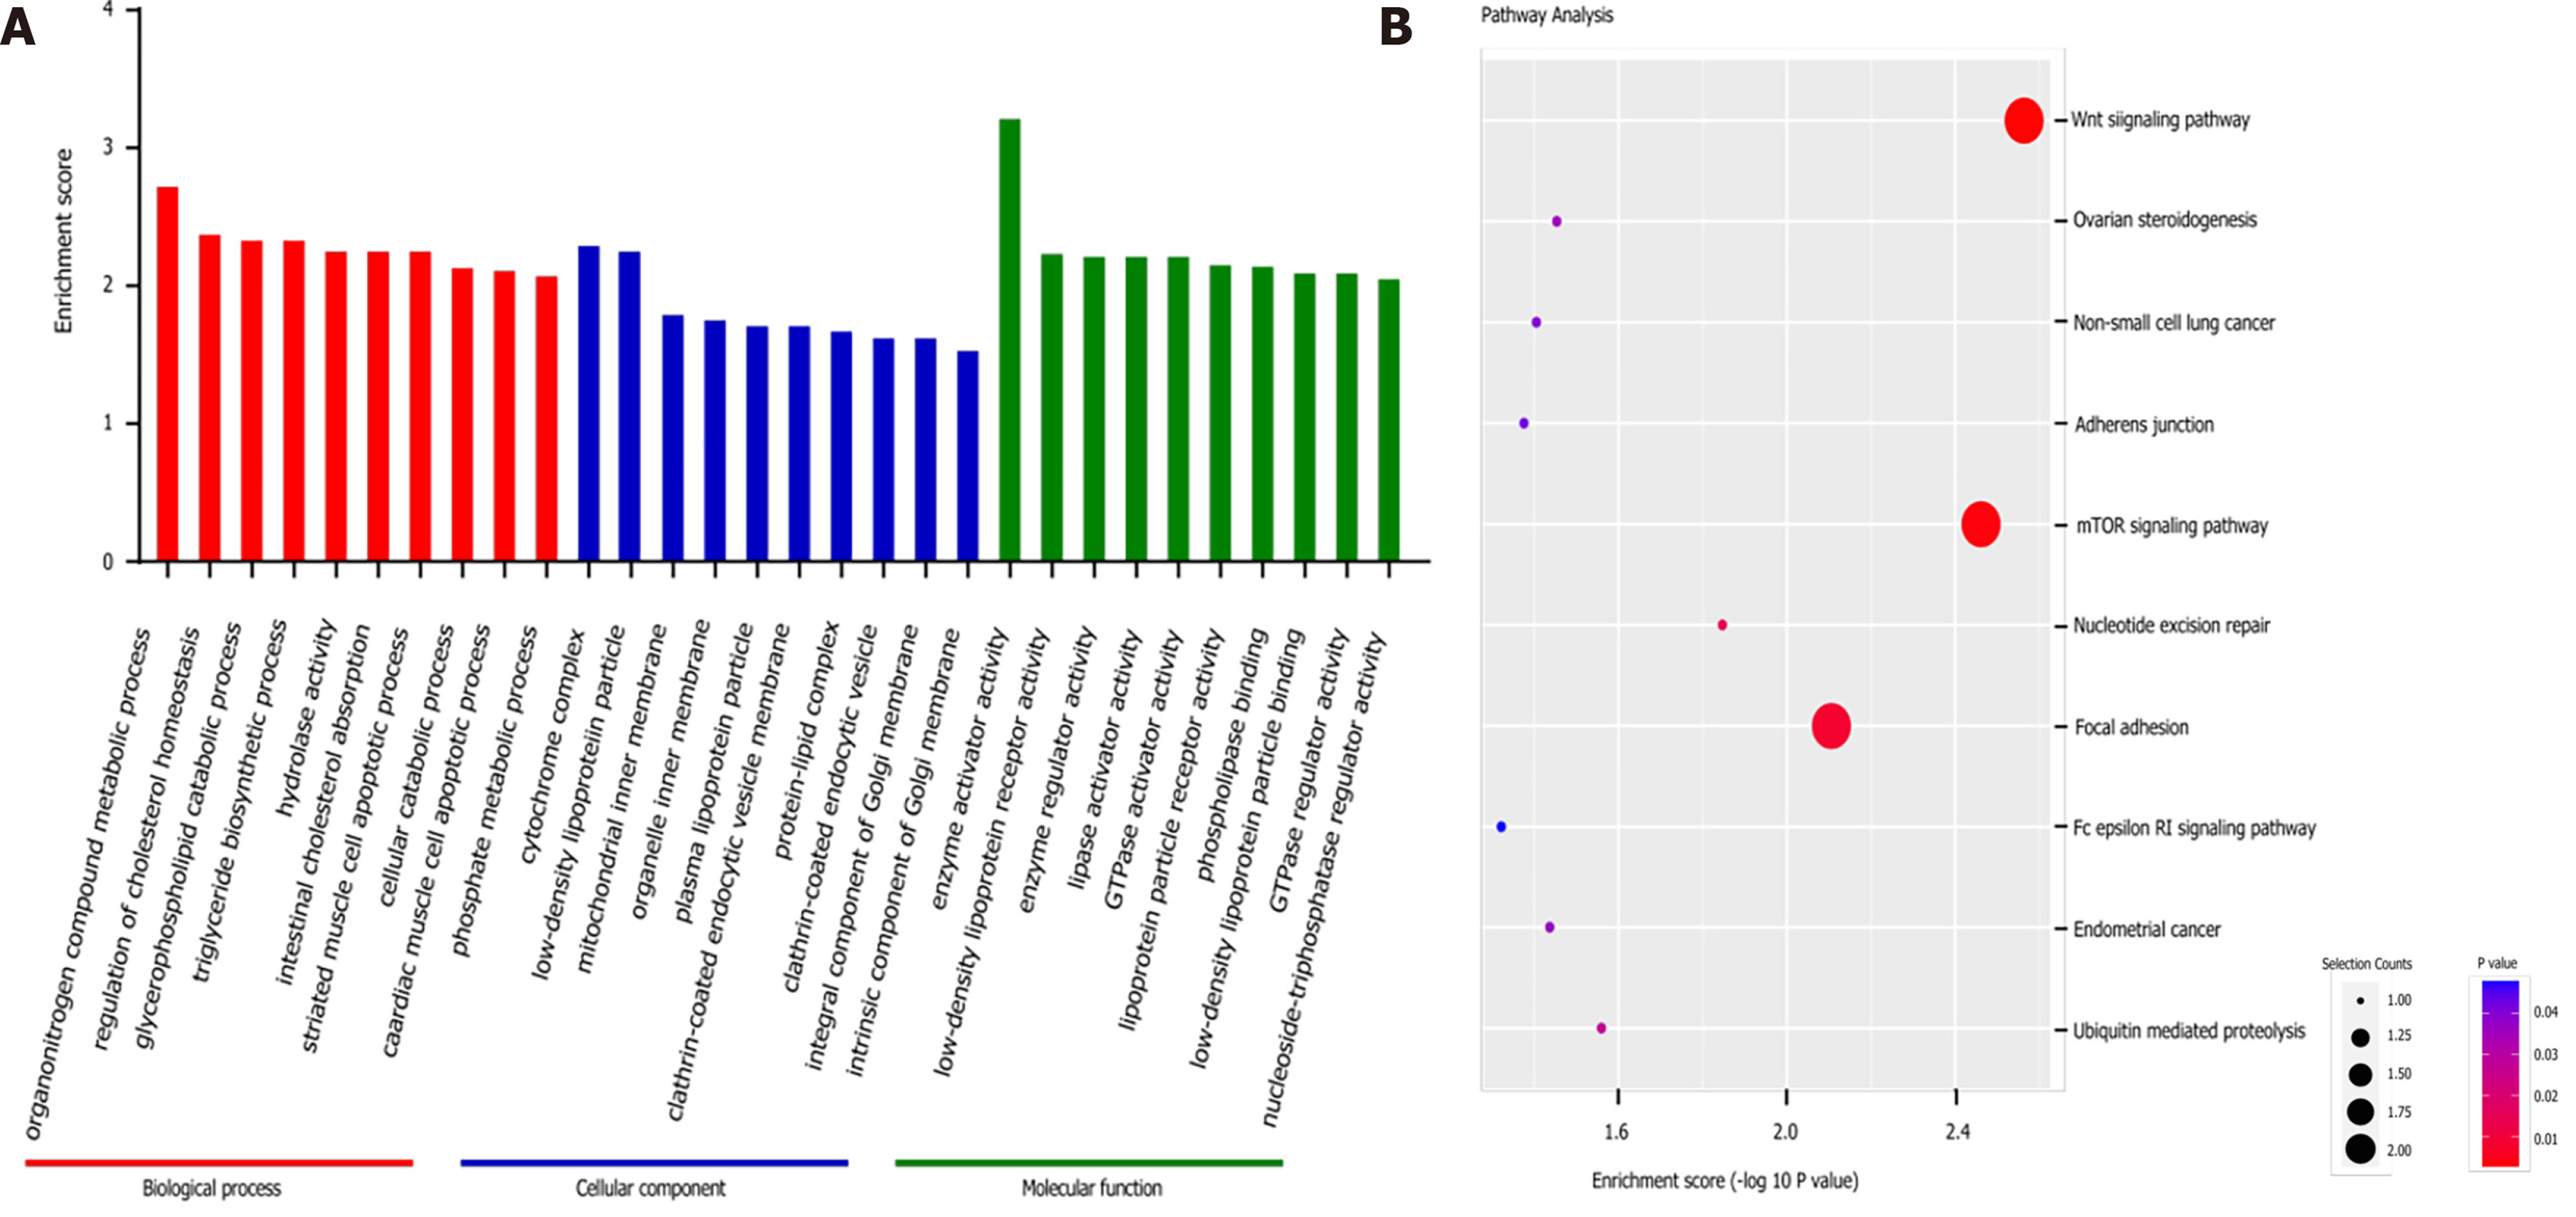
Figure 2 Gene Ontology and Kyoto Encyclopedia of Genes and Genomes pathway analyses based on the sequencing results.
A: Top 10 Gene Ontology (GO) terms identified in the GO analysis; B: Top 10 pathways identified in the Kyoto Encyclopedia of Genes and Genomes pathway analysis. GO: Gene Ontology; KEGG: Kyoto Encyclopedia of Genes and Genomes.
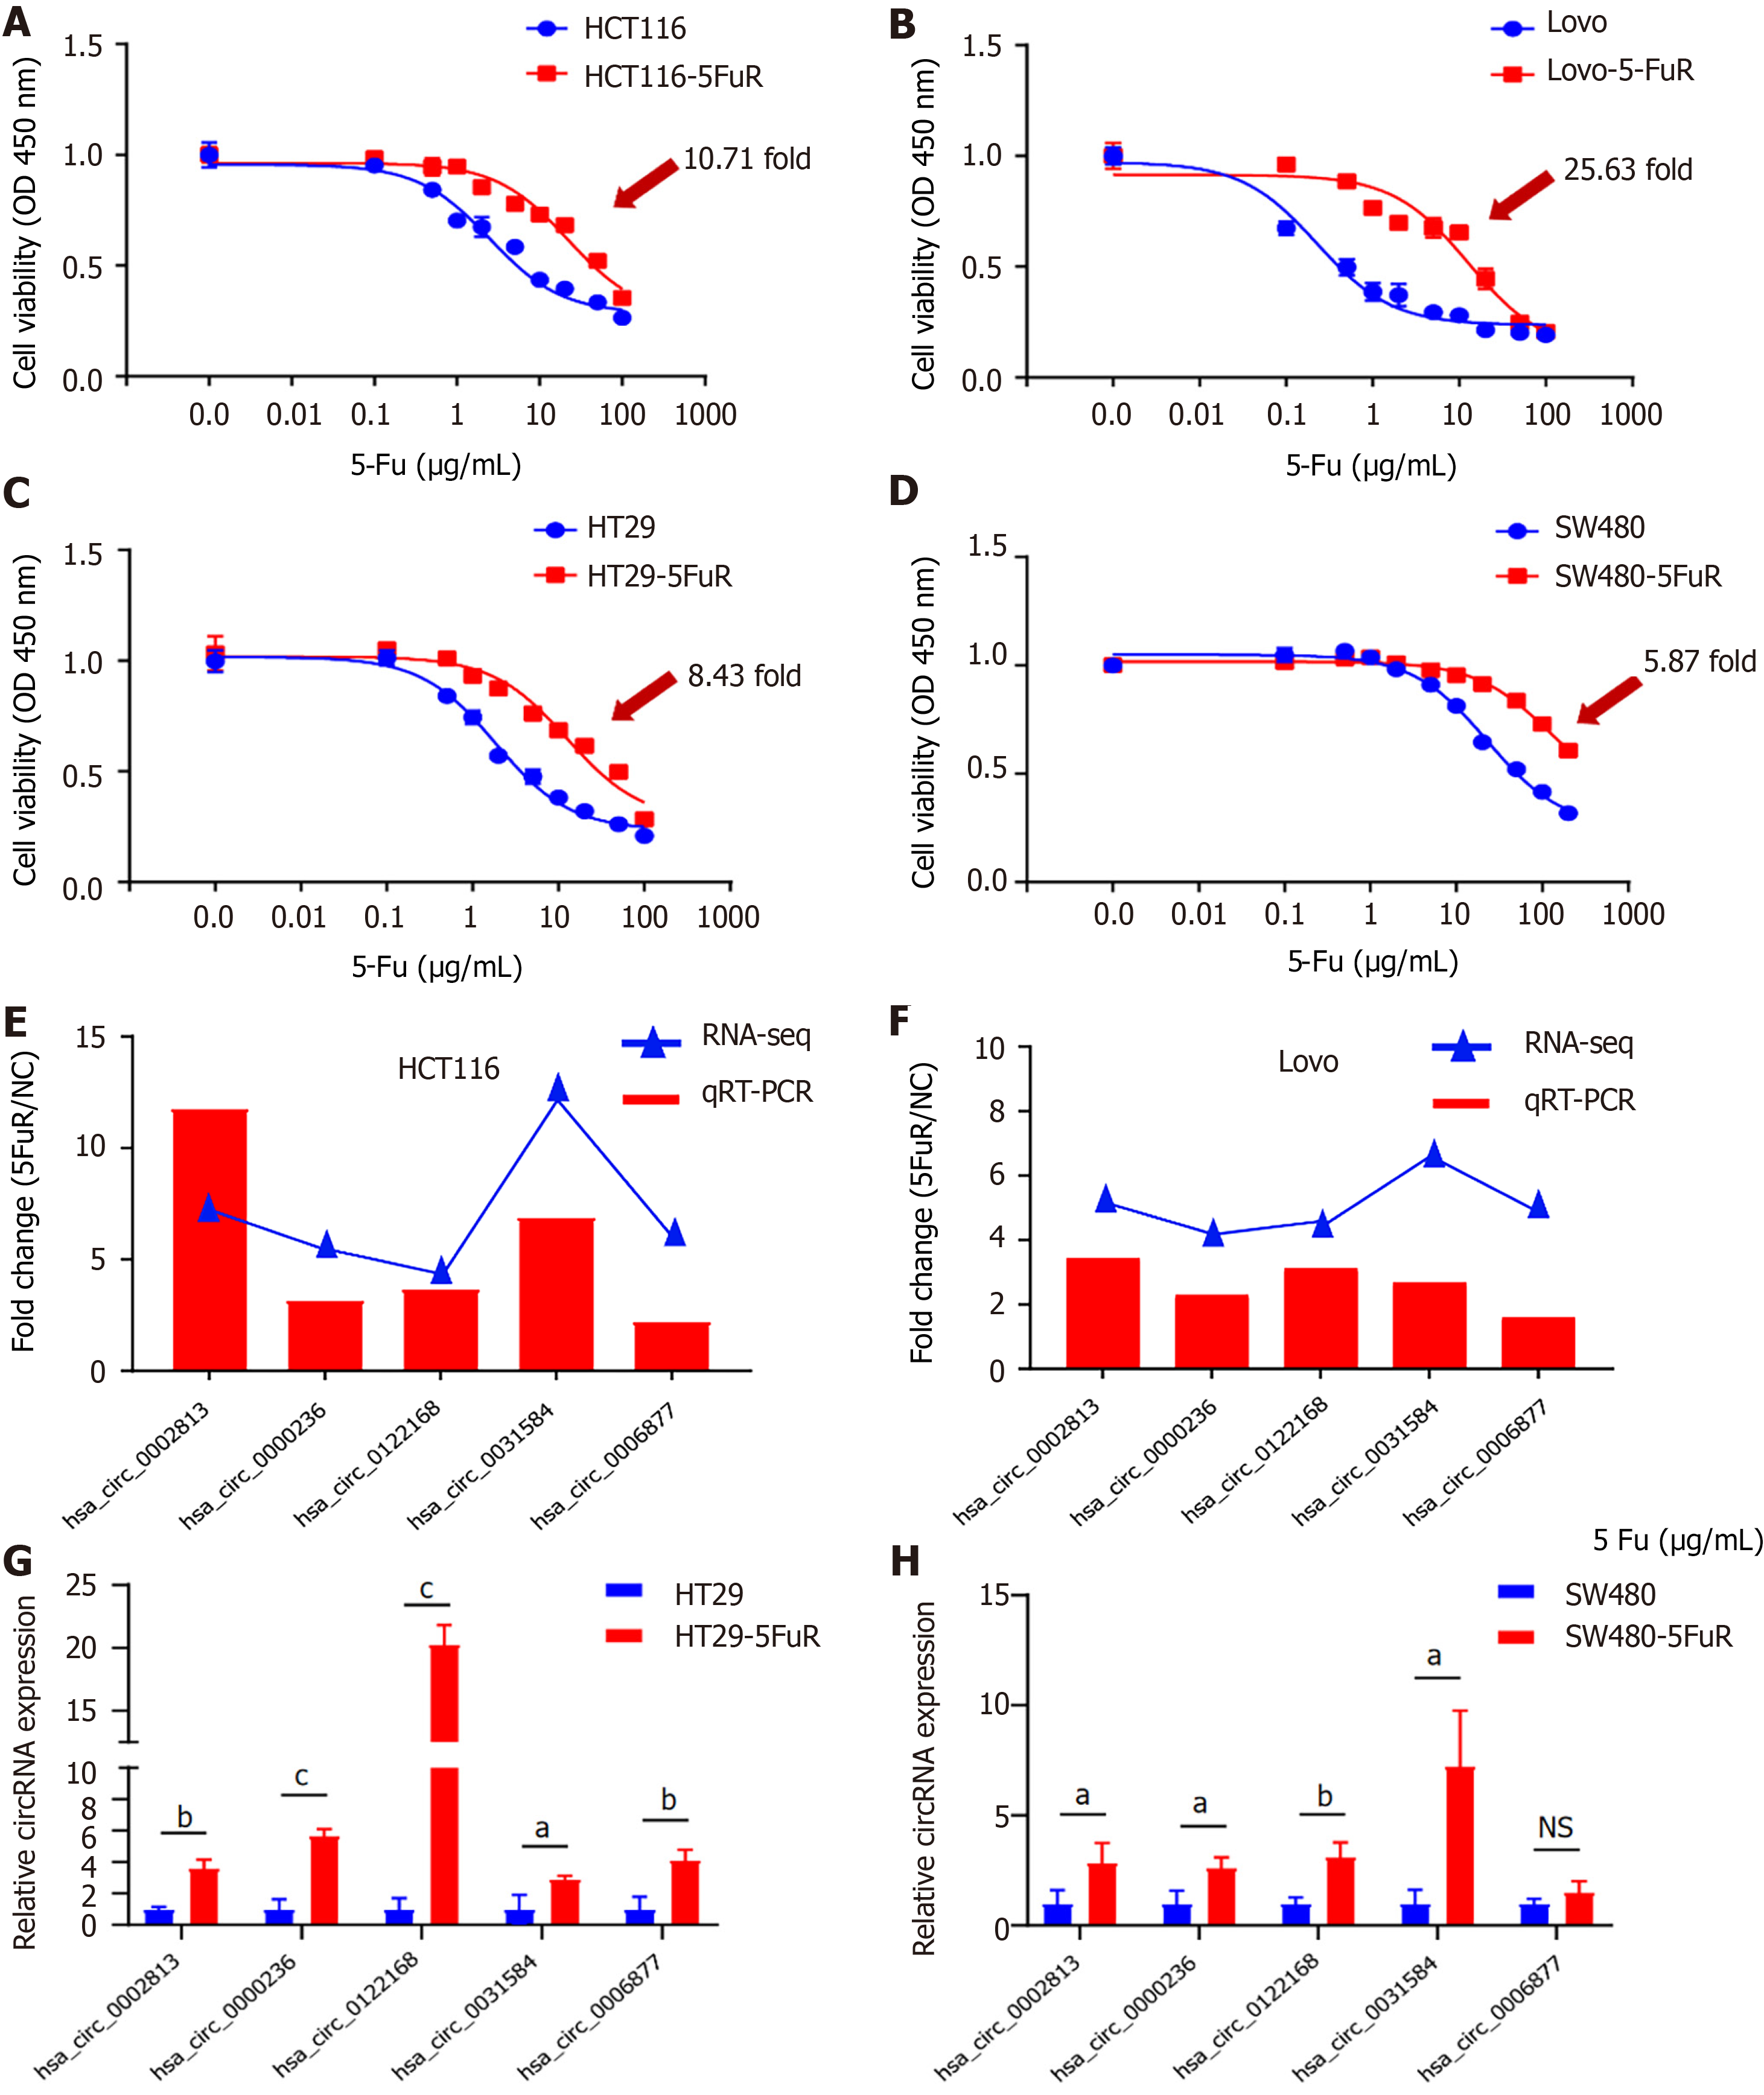
Figure 3 Verification of the sensitivity to 5-fluorouracil and differential circular RNA expression in 4 cell lines.
A-D: The inhibition rate of 5-fluorouracil (5-Fu) in these 4 paired cell lines was detected using the WST-1 assay at 48 h; E-H: Relative expression of 5 circular RNAs (hsa_circ_0002813, hsa_circ_0000236, hsa_circ_0122168, hsa_circ_0031584, and hsa_circ_0006877) in 4 paired cell lines was measured using quantitative real-time polymerase chain reaction assays. Data are presented as means ± SD. aP < 0.05; bP < 0.01; cP < 0.001. NS: No significant difference; 5-Fu: 5-fluorouracil.
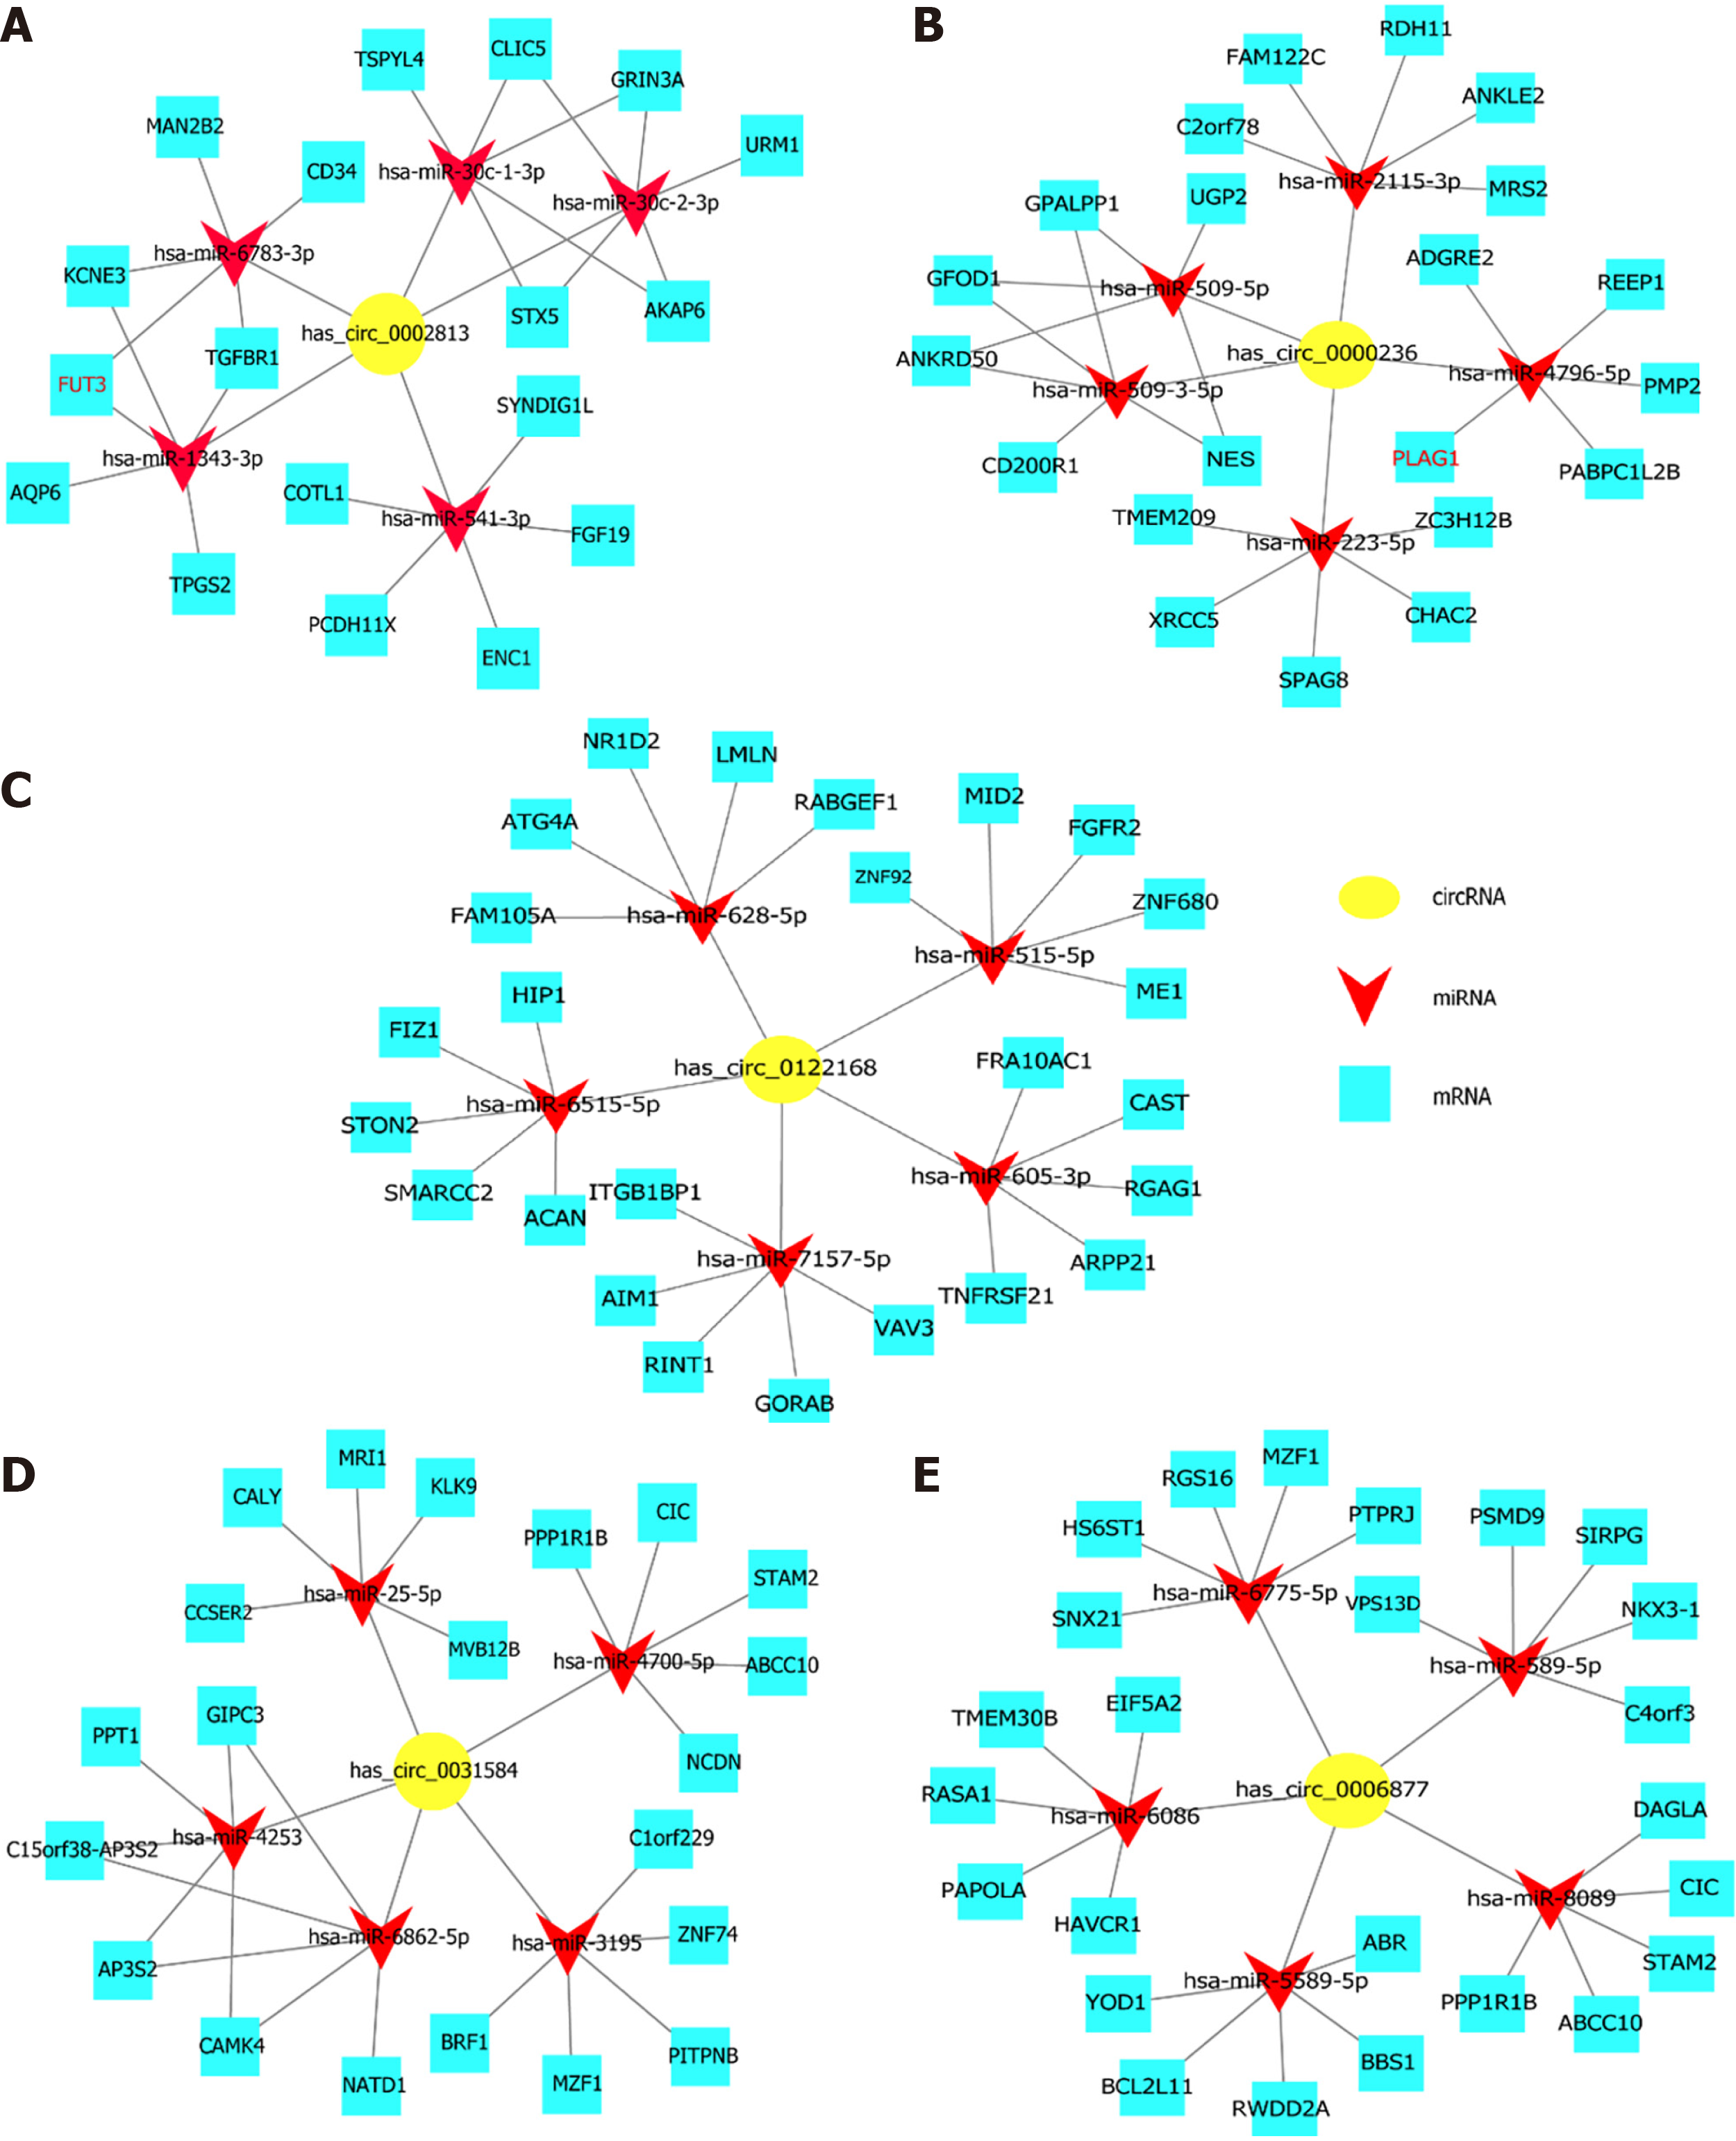
Figure 4 The competing endogenous RNA network.
The circRNA-miRNA-mRNA interactions for the 5 circRNAs (hsa_circ_0002813, hsa_circ_0000236, hsa_circ_0122168, hsa_circ_0031584, and hsa_circ_0006877) were determined by predictions and bioinformatics analysis using Cytoscape software. A: hsa_circ_0002813; B: hsa_circ_0000236; C: hsa_circ_0122168; D: hsa_circ_0031584; E: hsa_circ_0006877.
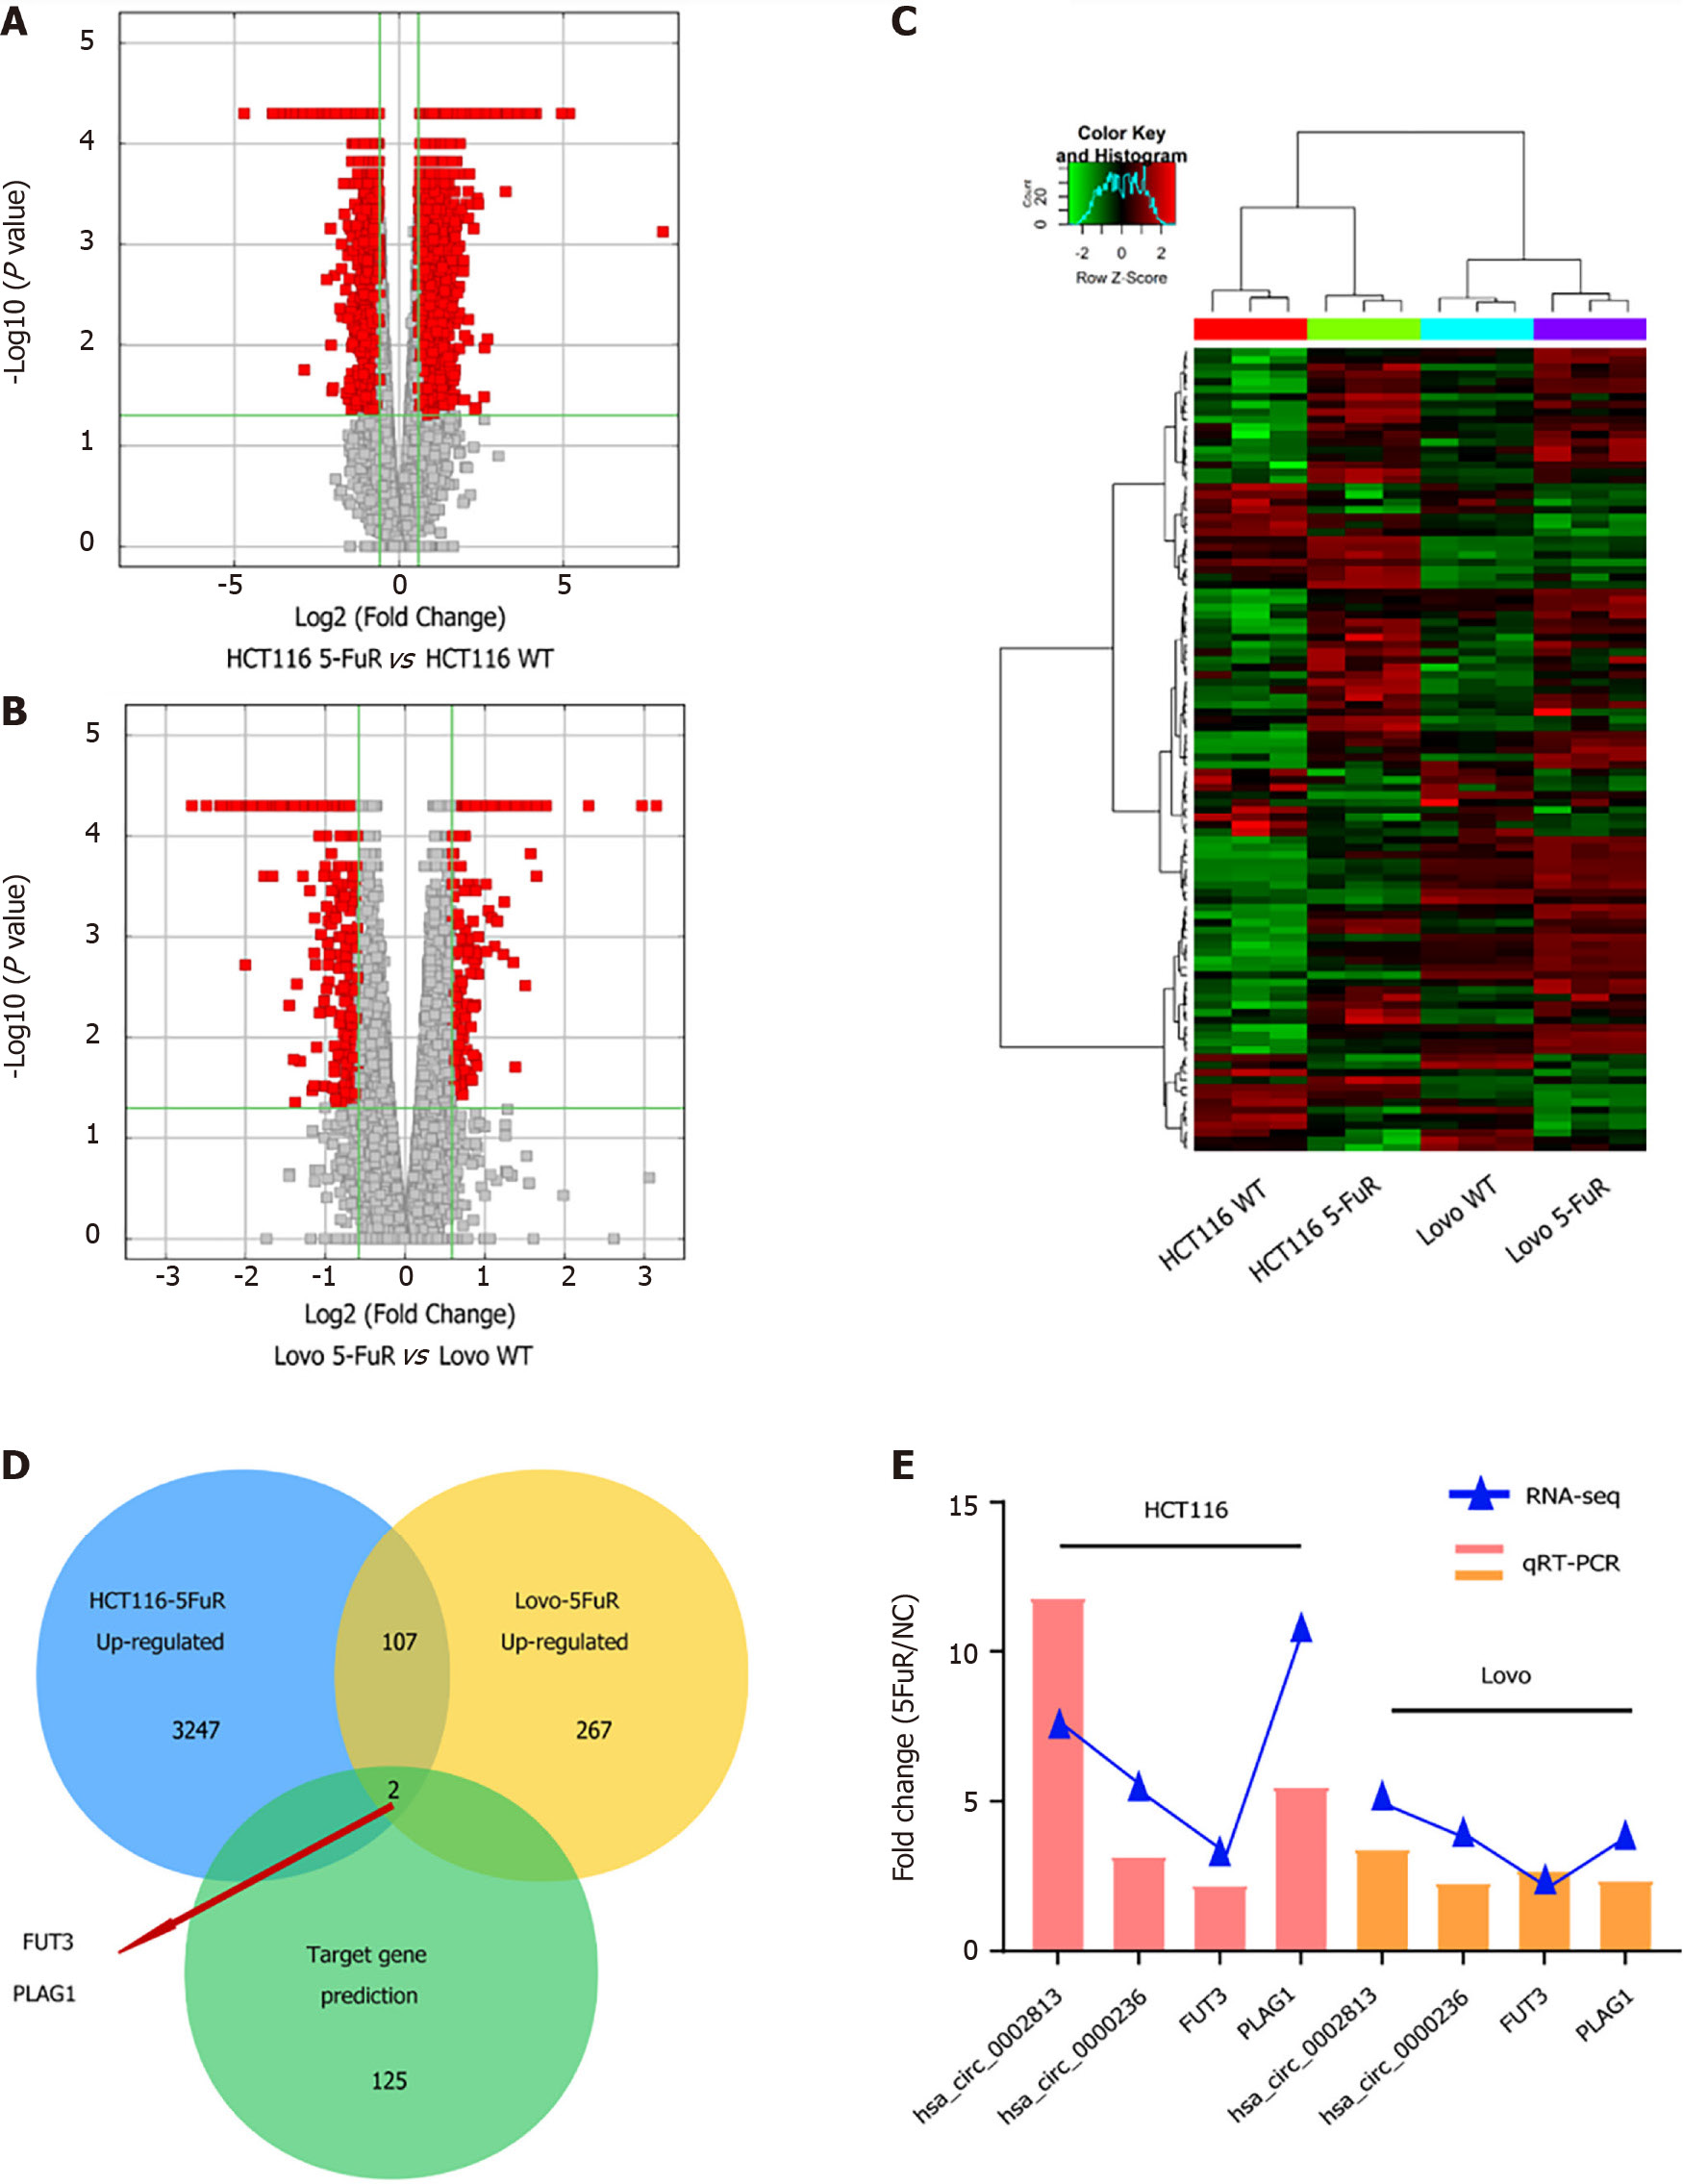
Figure 5 Comparison of mRNA expression profiles in 5-fluorouracil-resistant colorectal cancer cell lines.
A and B: The volcano plot shows the comparison of the mRNA expression profiles between the parental and 5-fluorouracil (5-Fu) resistant HCT116 and Lovo cell lines; C: Heatmap of the clustering analysis indicating differences in mRNA expression profiles in both paired cell lines; D: Analysis of interactions between mRNAs that were upregulated in both paired 5-Fu-resistant cell lines and the potential target genes predicted by the circRNA-miRNA-mRNA regulatory network; E: Relative mRNA expression in the 2 paired cell lines was measured using quantitative real-time polymerase chain reaction assays.
- Citation: Cheng PQ, Liu YJ, Zhang SA, Lu L, Zhou WJ, Hu D, Xu HC, Ji G. RNA-Seq profiling of circular RNAs in human colorectal cancer 5-fluorouracil resistance and potential biomarkers. World J Gastrointest Oncol 2022; 14(3): 678-689
- URL: https://www.wjgnet.com/1948-5204/full/v14/i3/678.htm
- DOI: https://dx.doi.org/10.4251/wjgo.v14.i3.678


