Copyright
©The Author(s) 2022.
World J Gastrointest Oncol. Feb 15, 2022; 14(2): 478-497
Published online Feb 15, 2022. doi: 10.4251/wjgo.v14.i2.478
Published online Feb 15, 2022. doi: 10.4251/wjgo.v14.i2.478
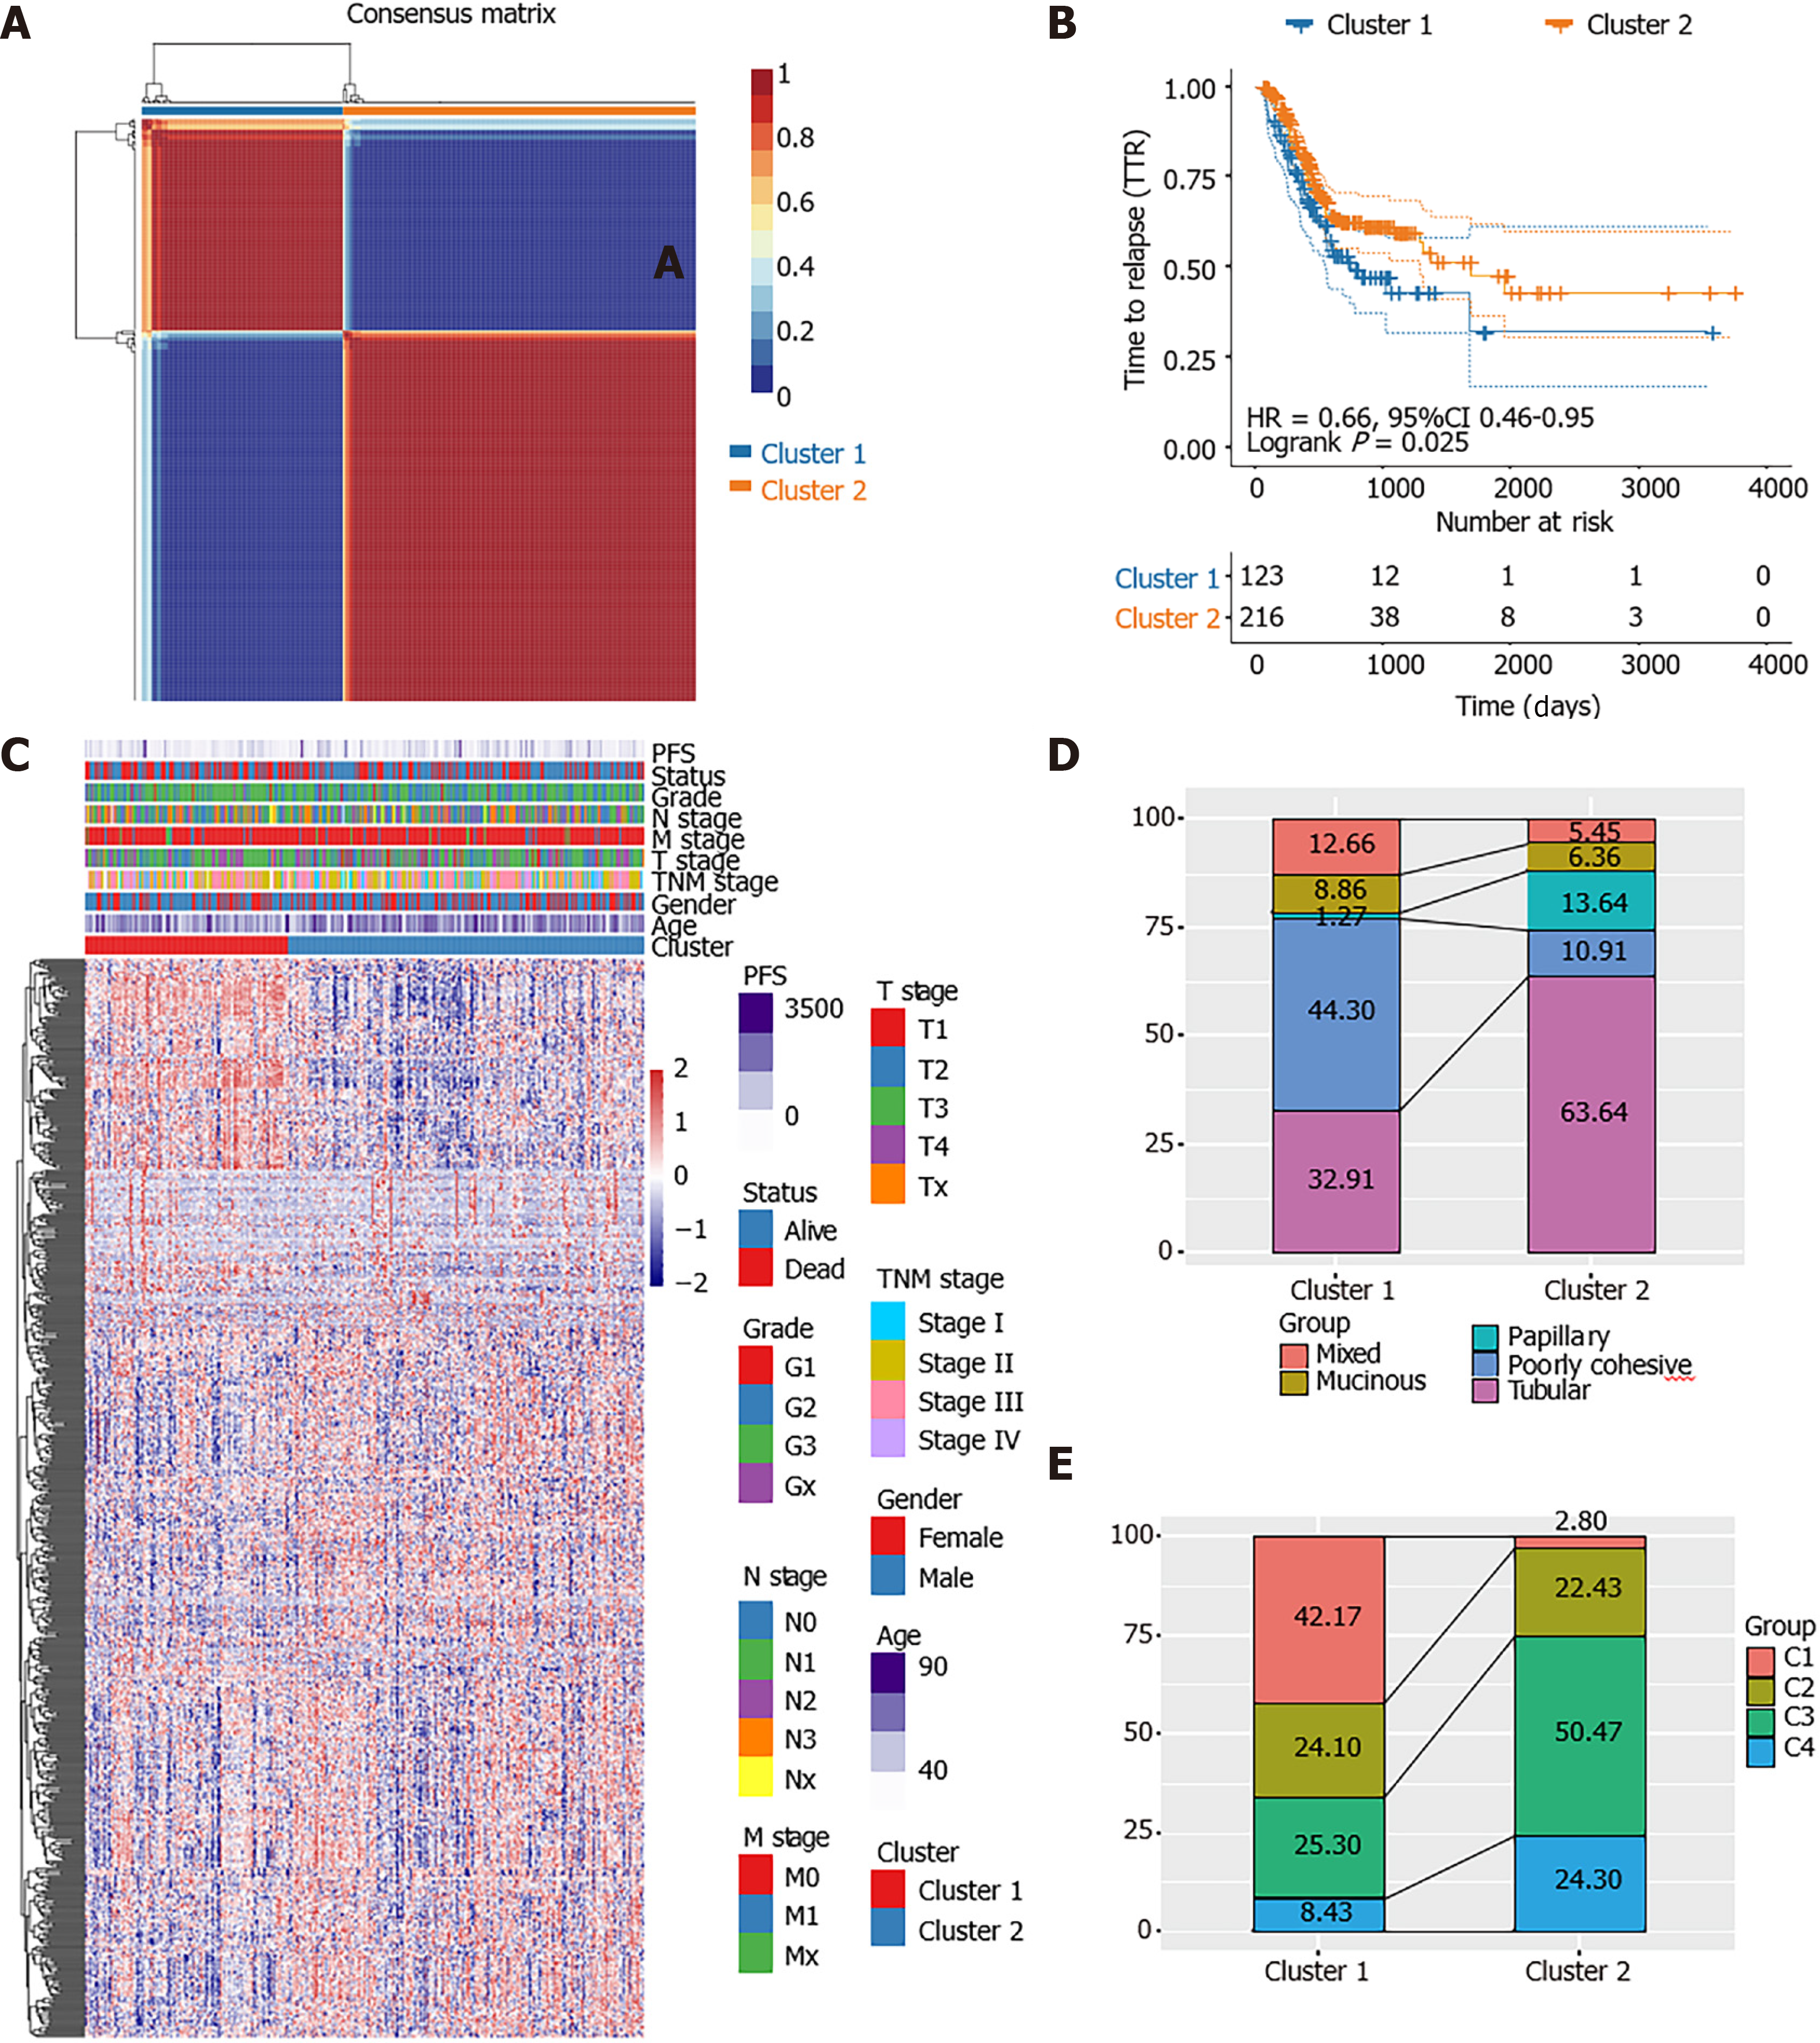
Figure 1 Identification of molecular subtypes in stomach adenocarcinoma.
A: Consensus map of non-negative matrix factorization clustering; B: Kaplan-Meier curves showed the PFS curve of the three subtypes; C: Heat map of the expression profile of 584 energy-metabolism-related genes and the distribution of clinicopathological parameters in all three subtypes; D: The alluvial diagram showed the comparison of molecular subtype with World Health Organization classification; E: The alluvial diagram showed the comparison of molecular subtype with The Cancer Genome Atlas four subtypes-classification.
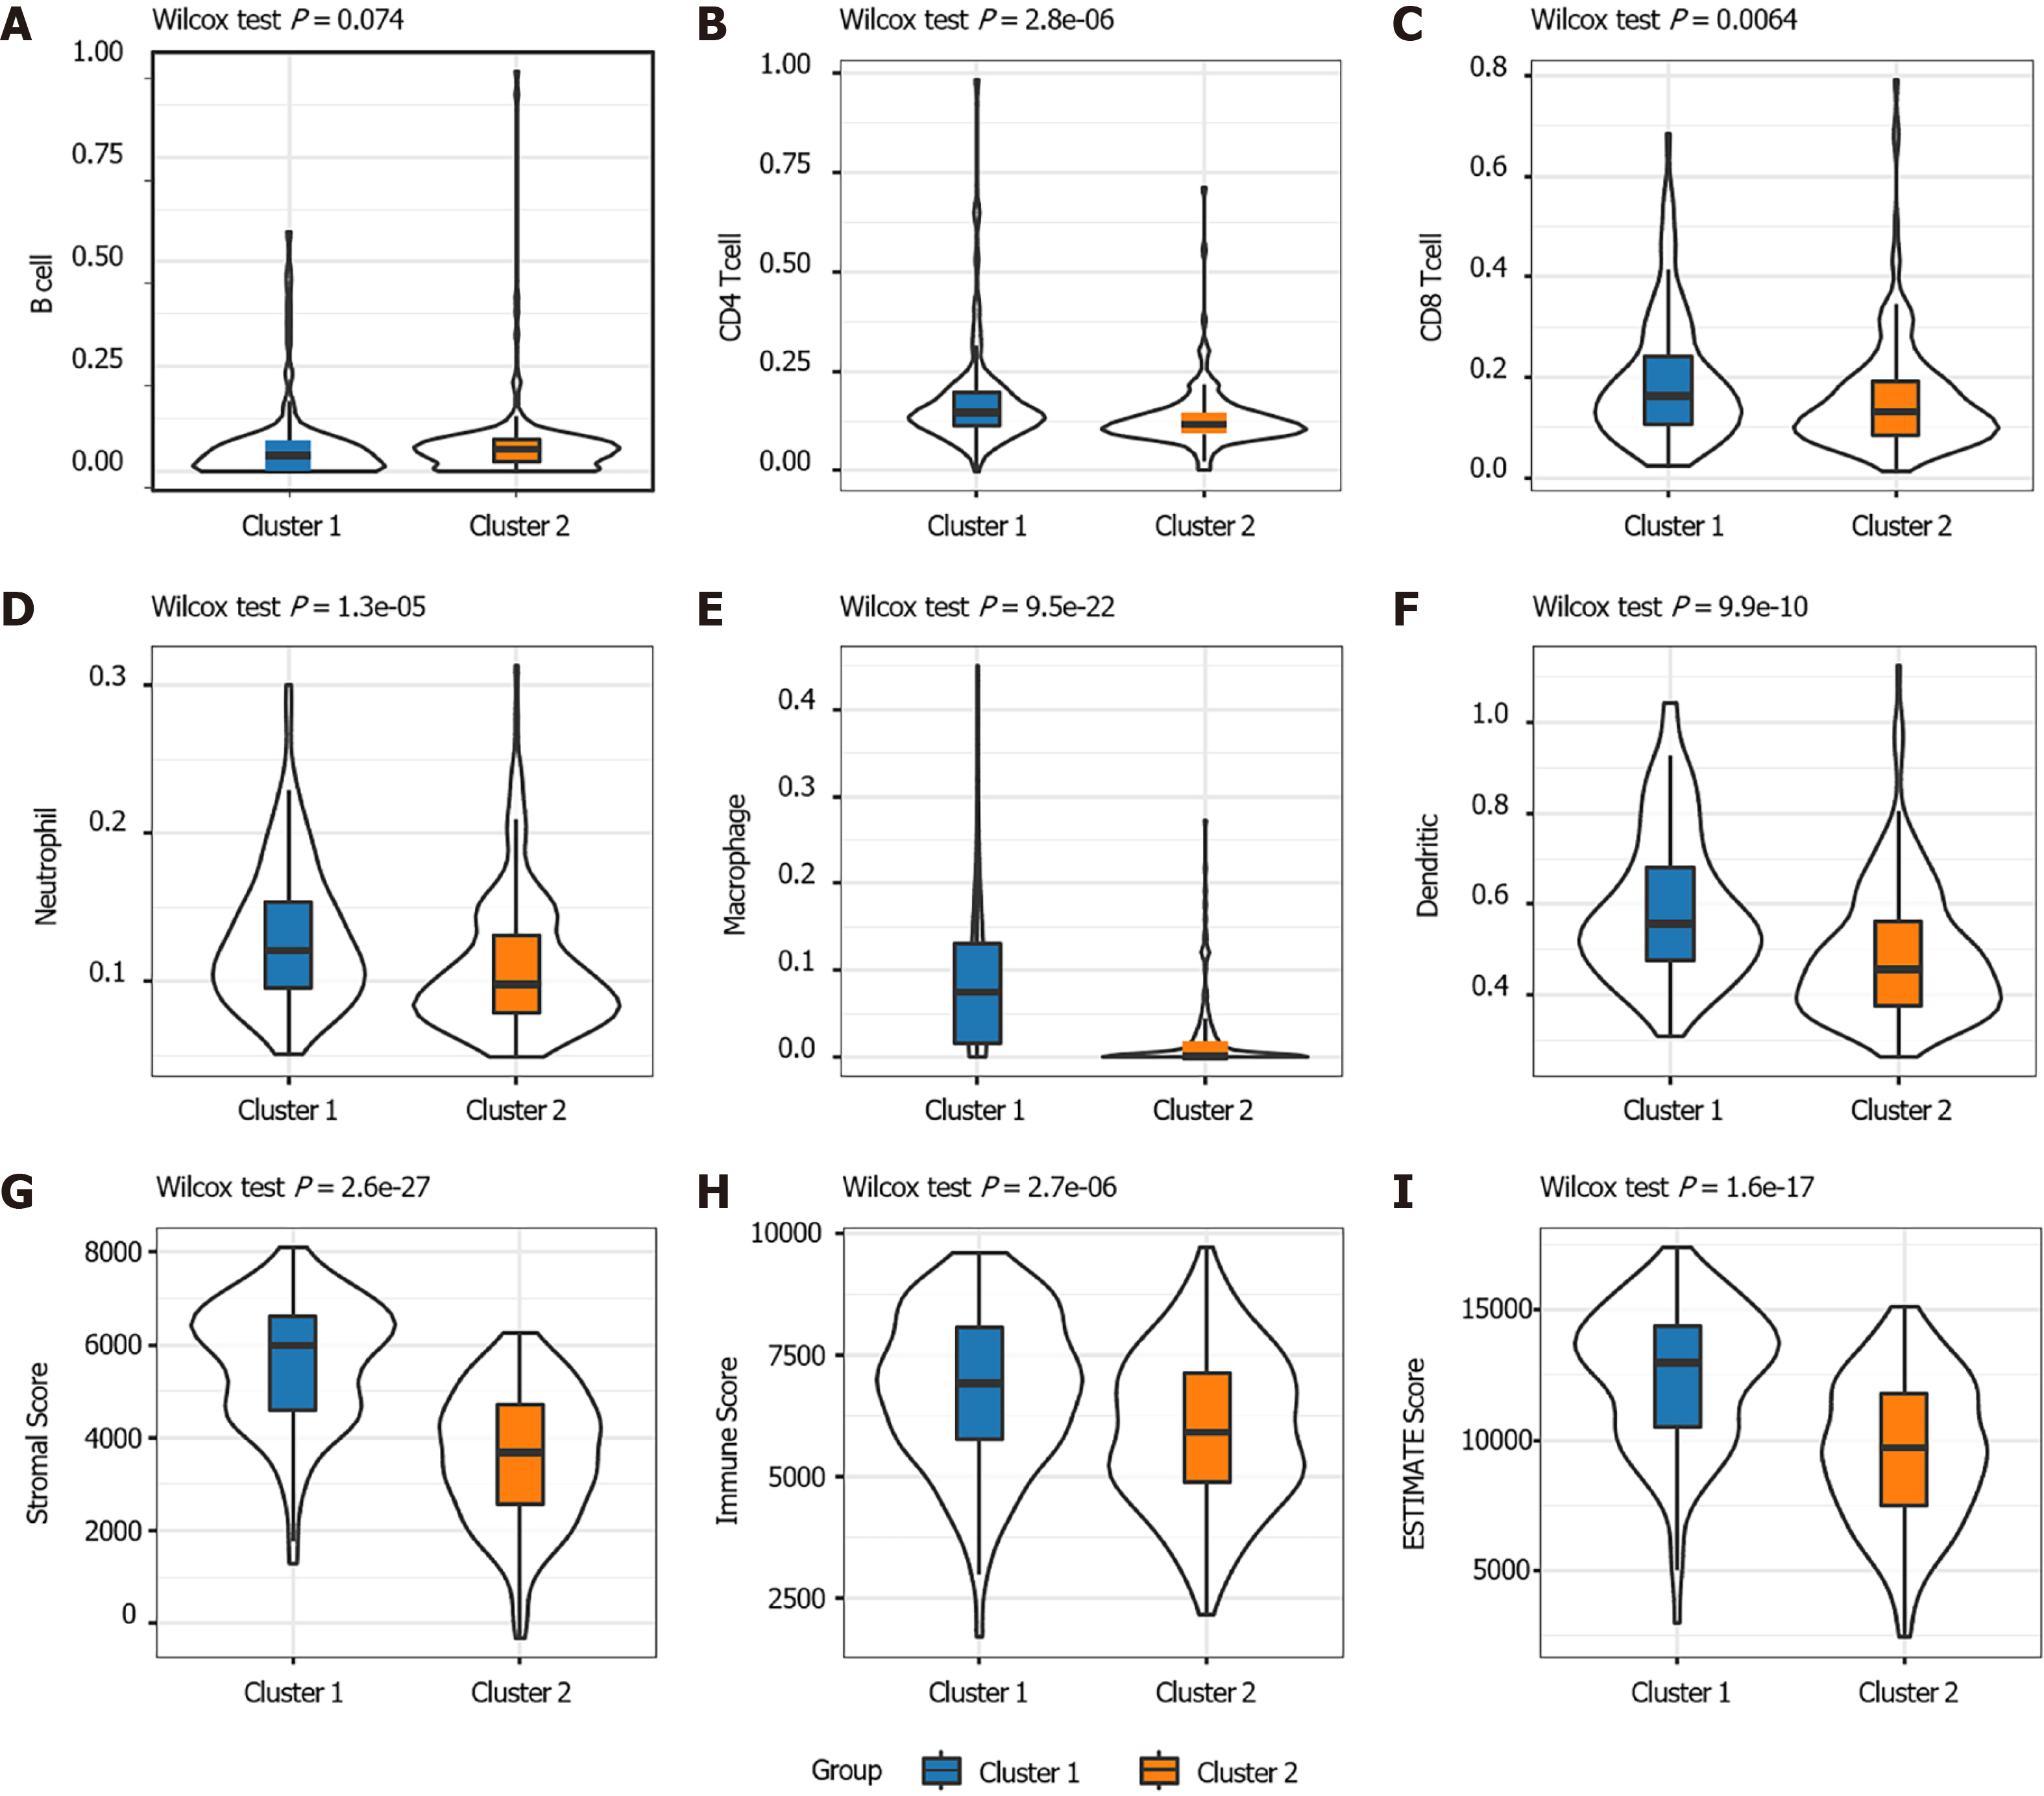
Figure 2 The proportions of tumor-infiltration immune cells and the fractions of immune and stromal cell components in TME between the two subgroups.
A-F: The proportions of B cell (A), CD4+T cell (B), CD8+T cell (C), Neutrophil (D), Macrophage (E) and Dendritic cell (F) between the two subtypes; G-I: Distribution of the ImmuneScore (G), StromalScore (H), ESTIMATEScore (I) between the two subtypes.
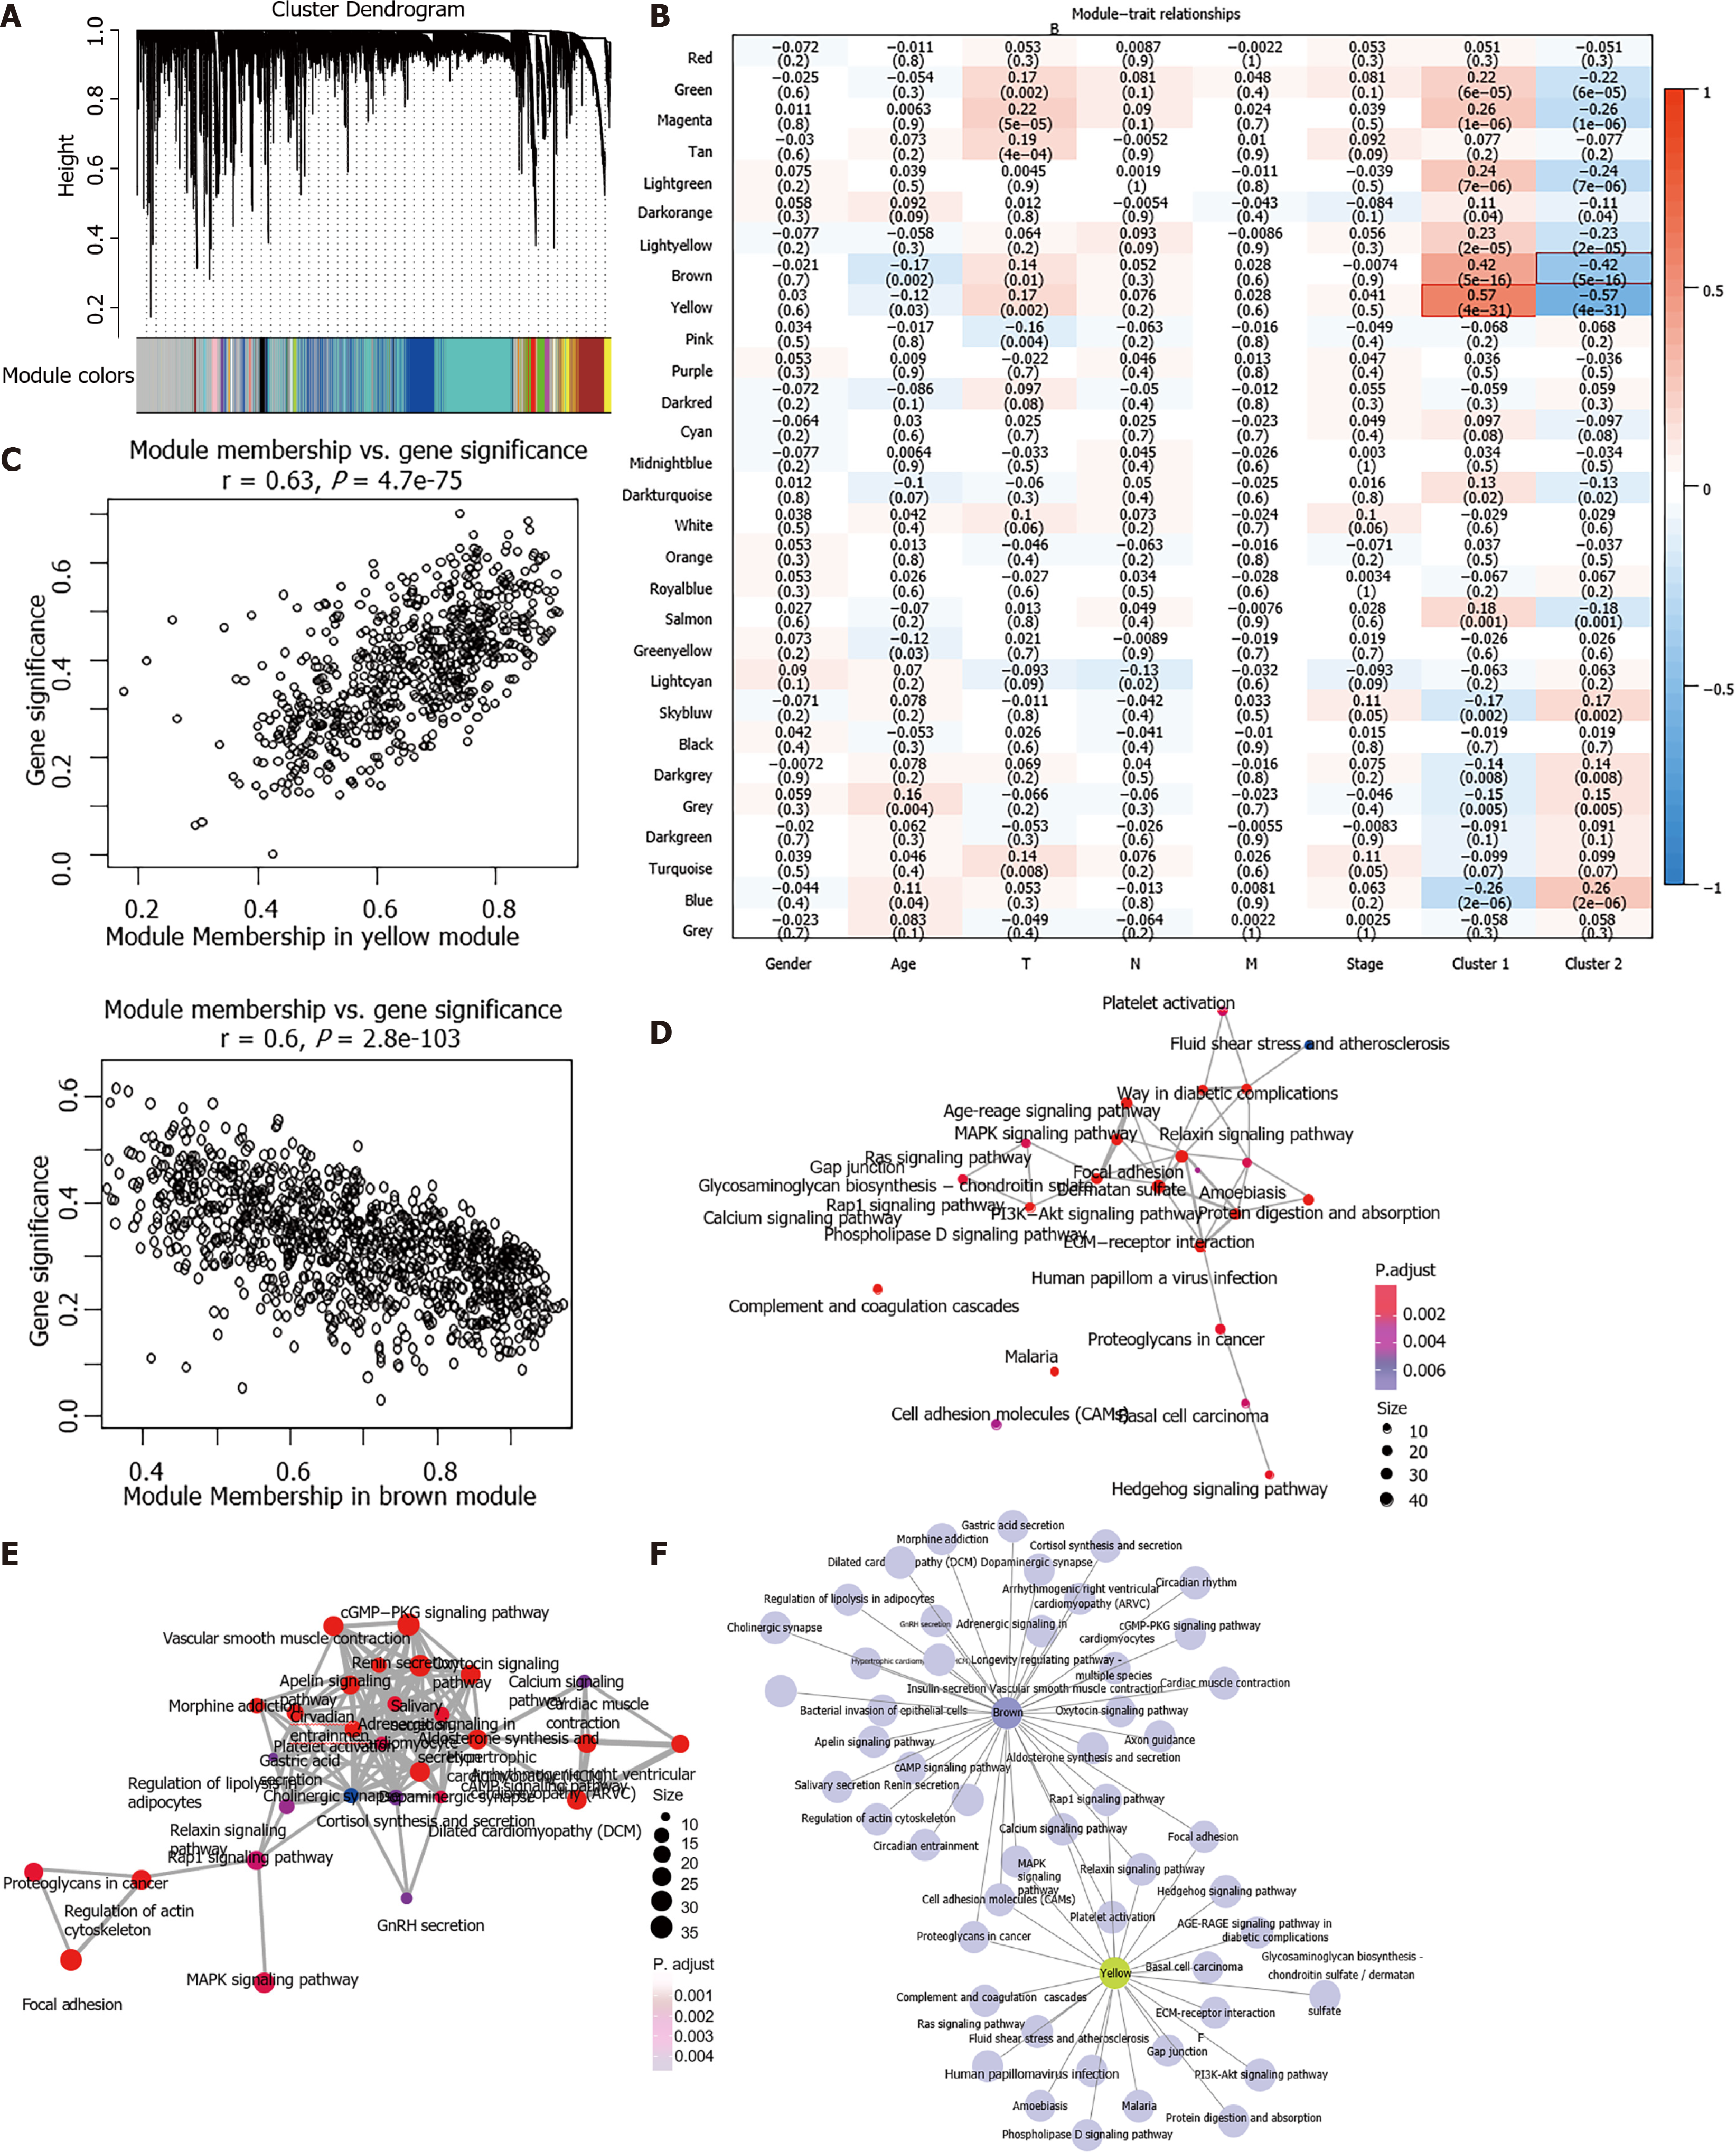
Figure 3 WGCNA co-expression analysis.
A: Gene dendrogram and module colors; B: Relationship between the 29 modules and the clinical phenotypes and molecular subtypes; C: The correlation of yellow module with Cluster 1, and brown module with Cluster 2 in The Cancer Genome Atlas dataset; D and E: Gene Kyoto Encyclopedia of Genes and Genomes enrichment functional integration network of the yellow module (D) and brown module (E); F: Network relationship between the enrichment results of the two modules. The color of the dot stands for the different P value and the size of the dot reflects the number of genes enriched in the corresponding pathway.
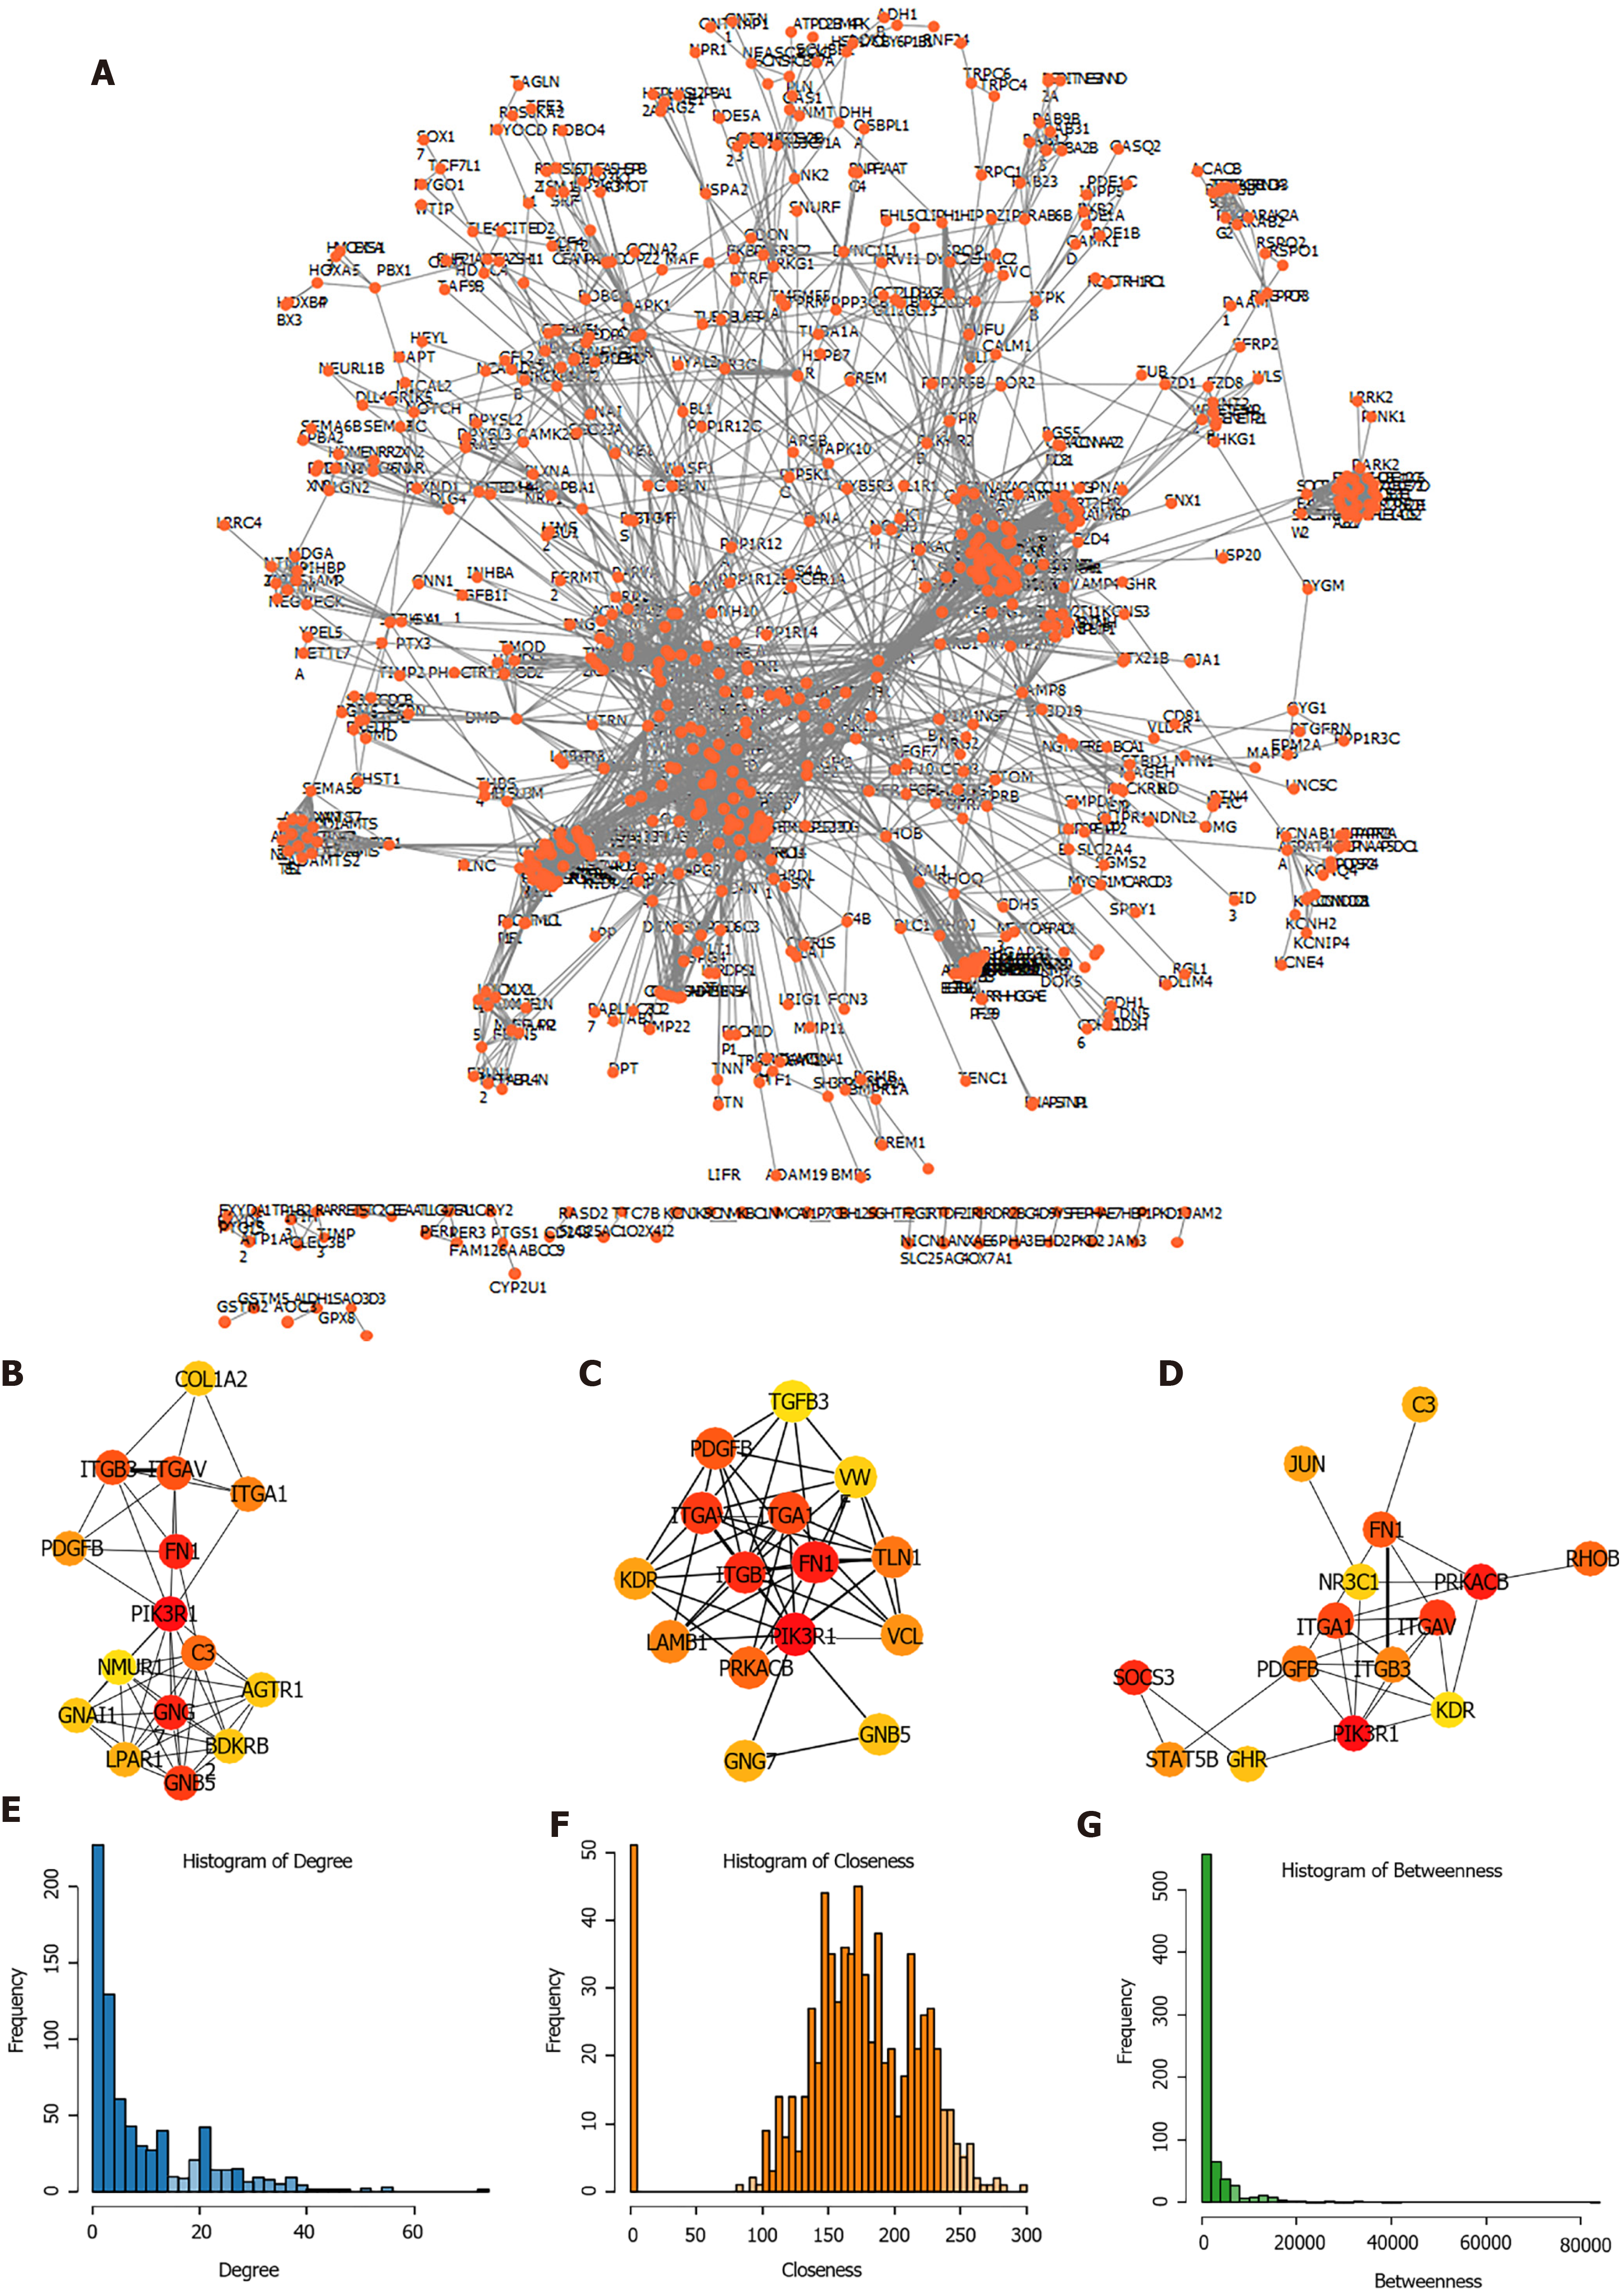
Figure 4 Screening of hub genes involved in the development of stomach adenocarcinoma.
A: The network showed co-expression gene in protein-protein interaction (PPI) pairs with a score higher than 0.9; B-D: Top hub genes identified by the Degree (B), Closeness (C) and Betweenness (D); E-G: The topological properties of the PPI network and the distributions of degree (E), closeness (F), and betweenness (G).
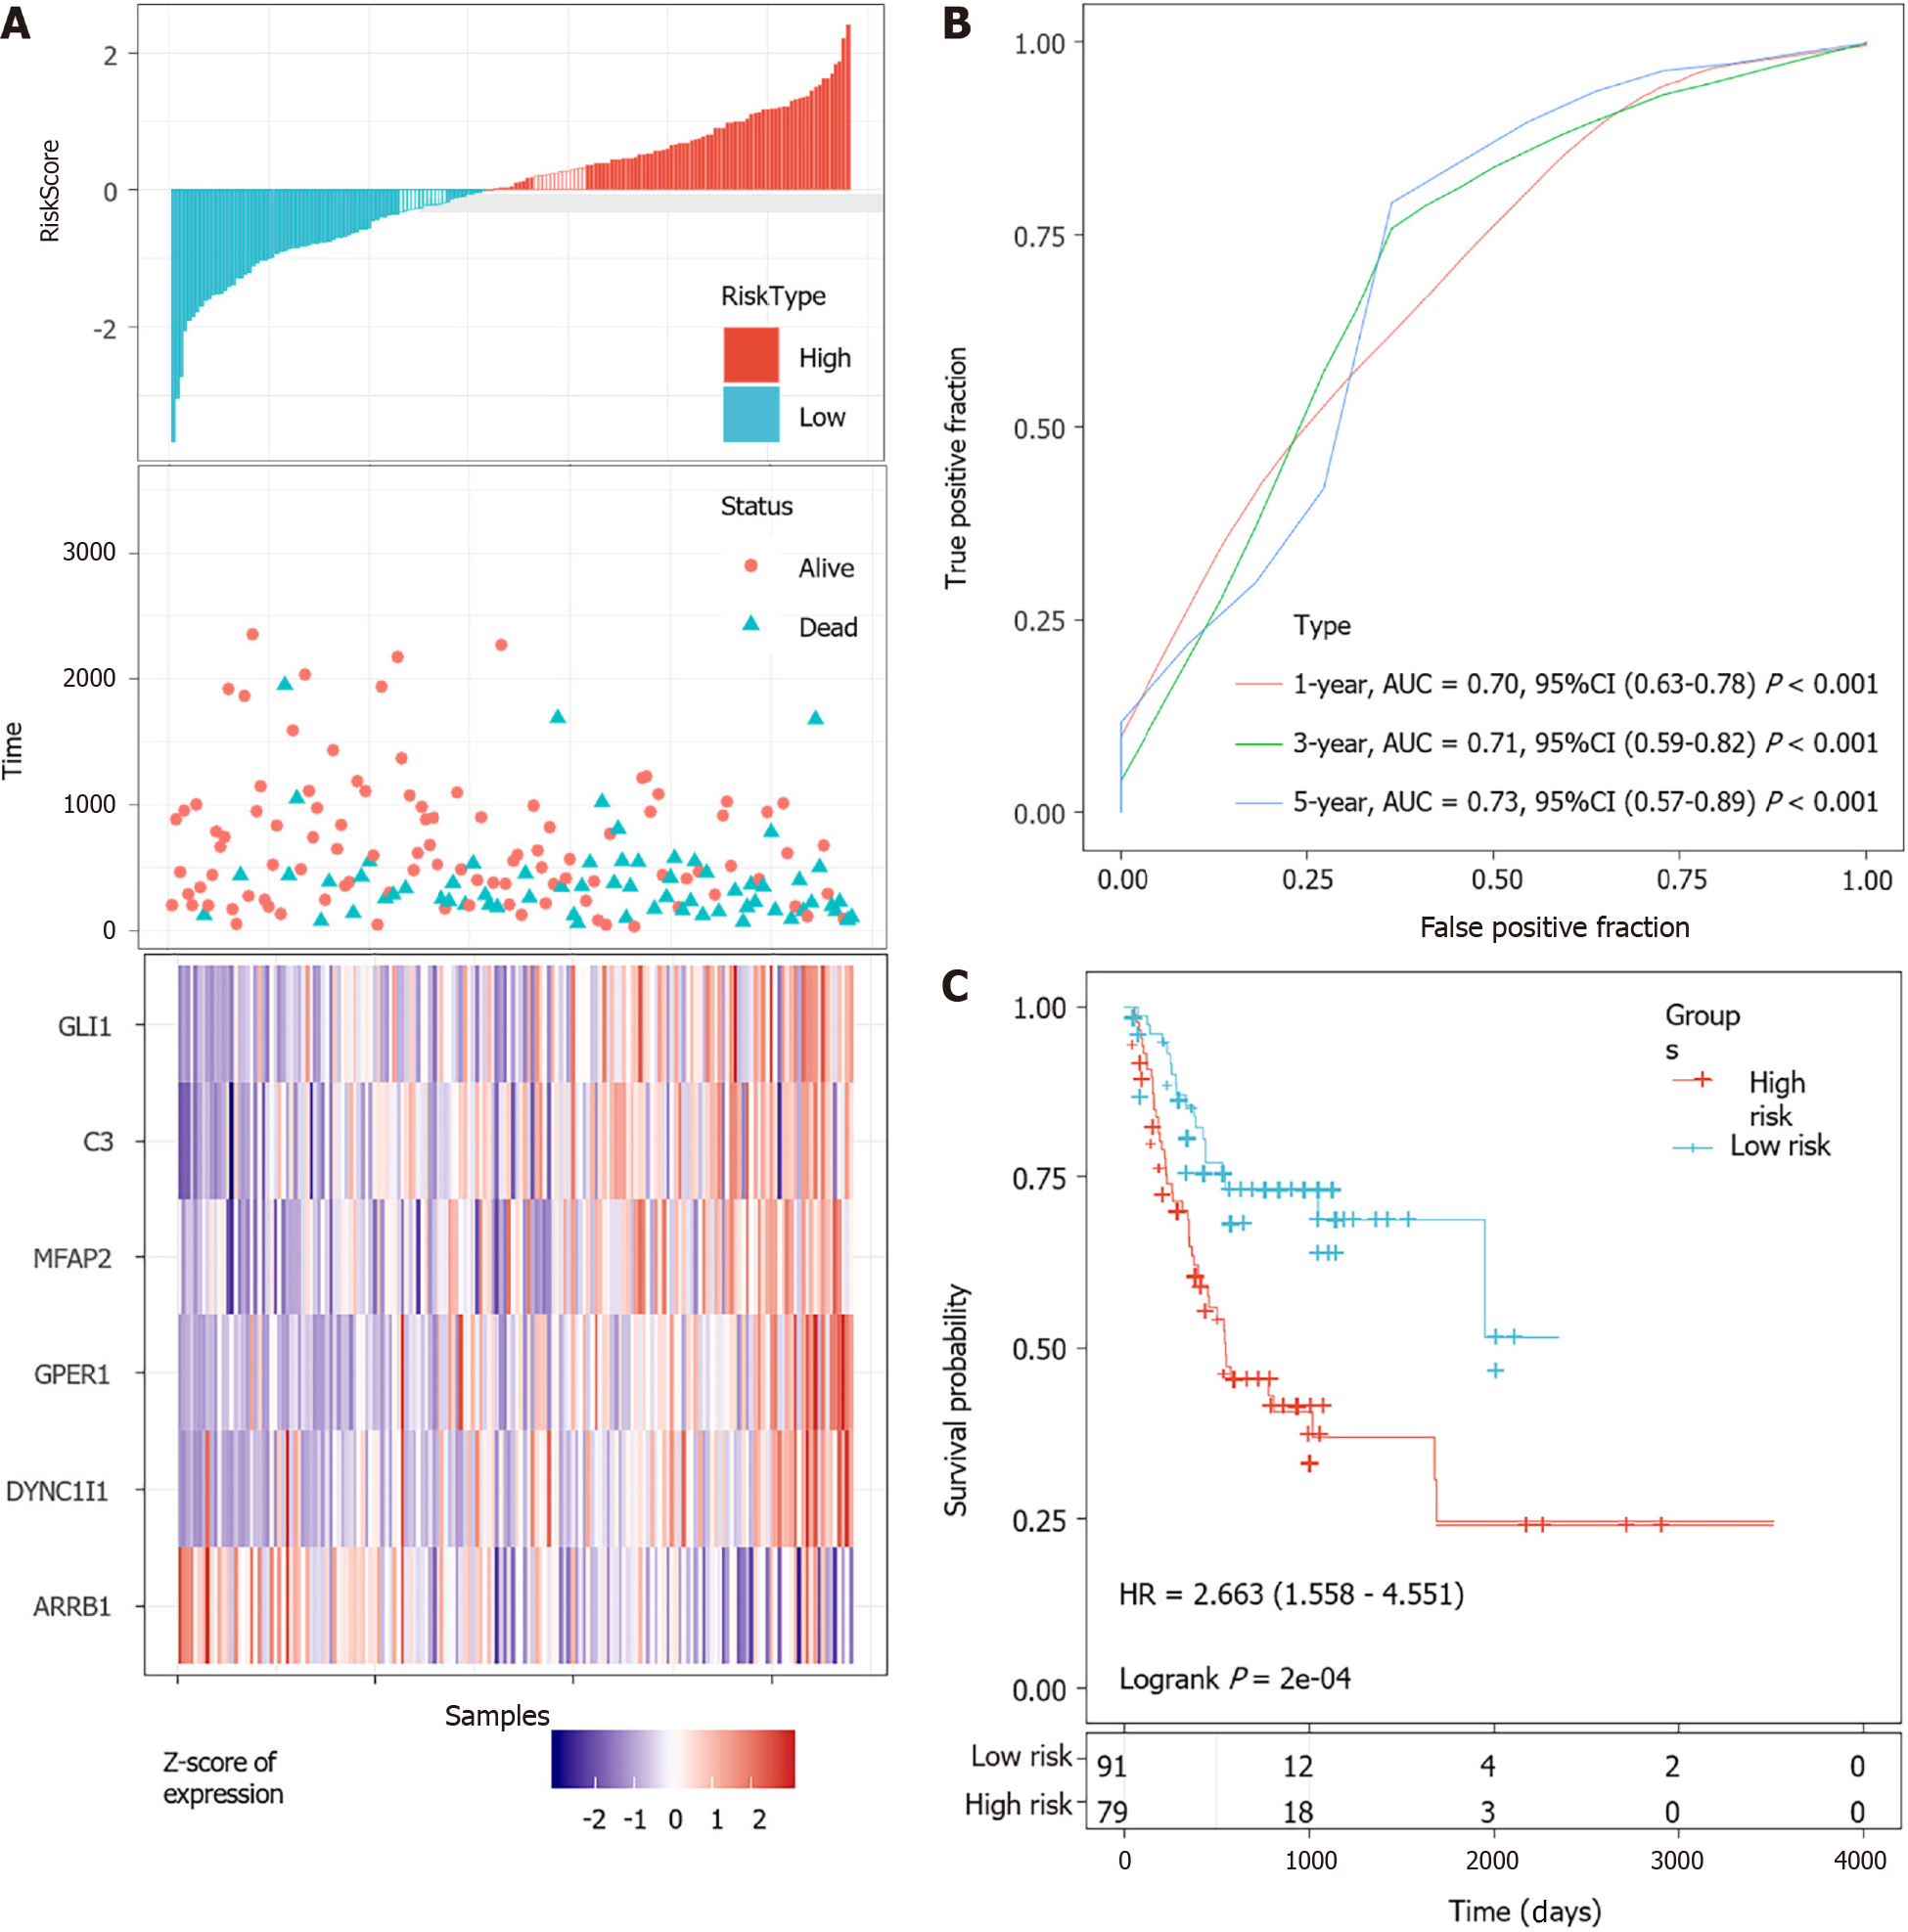
Figure 5 Evaluation of the performance of the 6-gene signature in the training dataset.
A: Risk score, survival time, survival status and expression of the 6-gene signature in the training set; B: Receiver operating characteristic (ROC) curve of the 6-gene signature for 1-year, 3-year and 5-year survival in the training set; C: Kaplan-Meier survival analysis of PFS for high-risk or low-risk group patients in the training set. AUC: Area under the curve; HR: Hazard ratio; CI: Confidence interval.
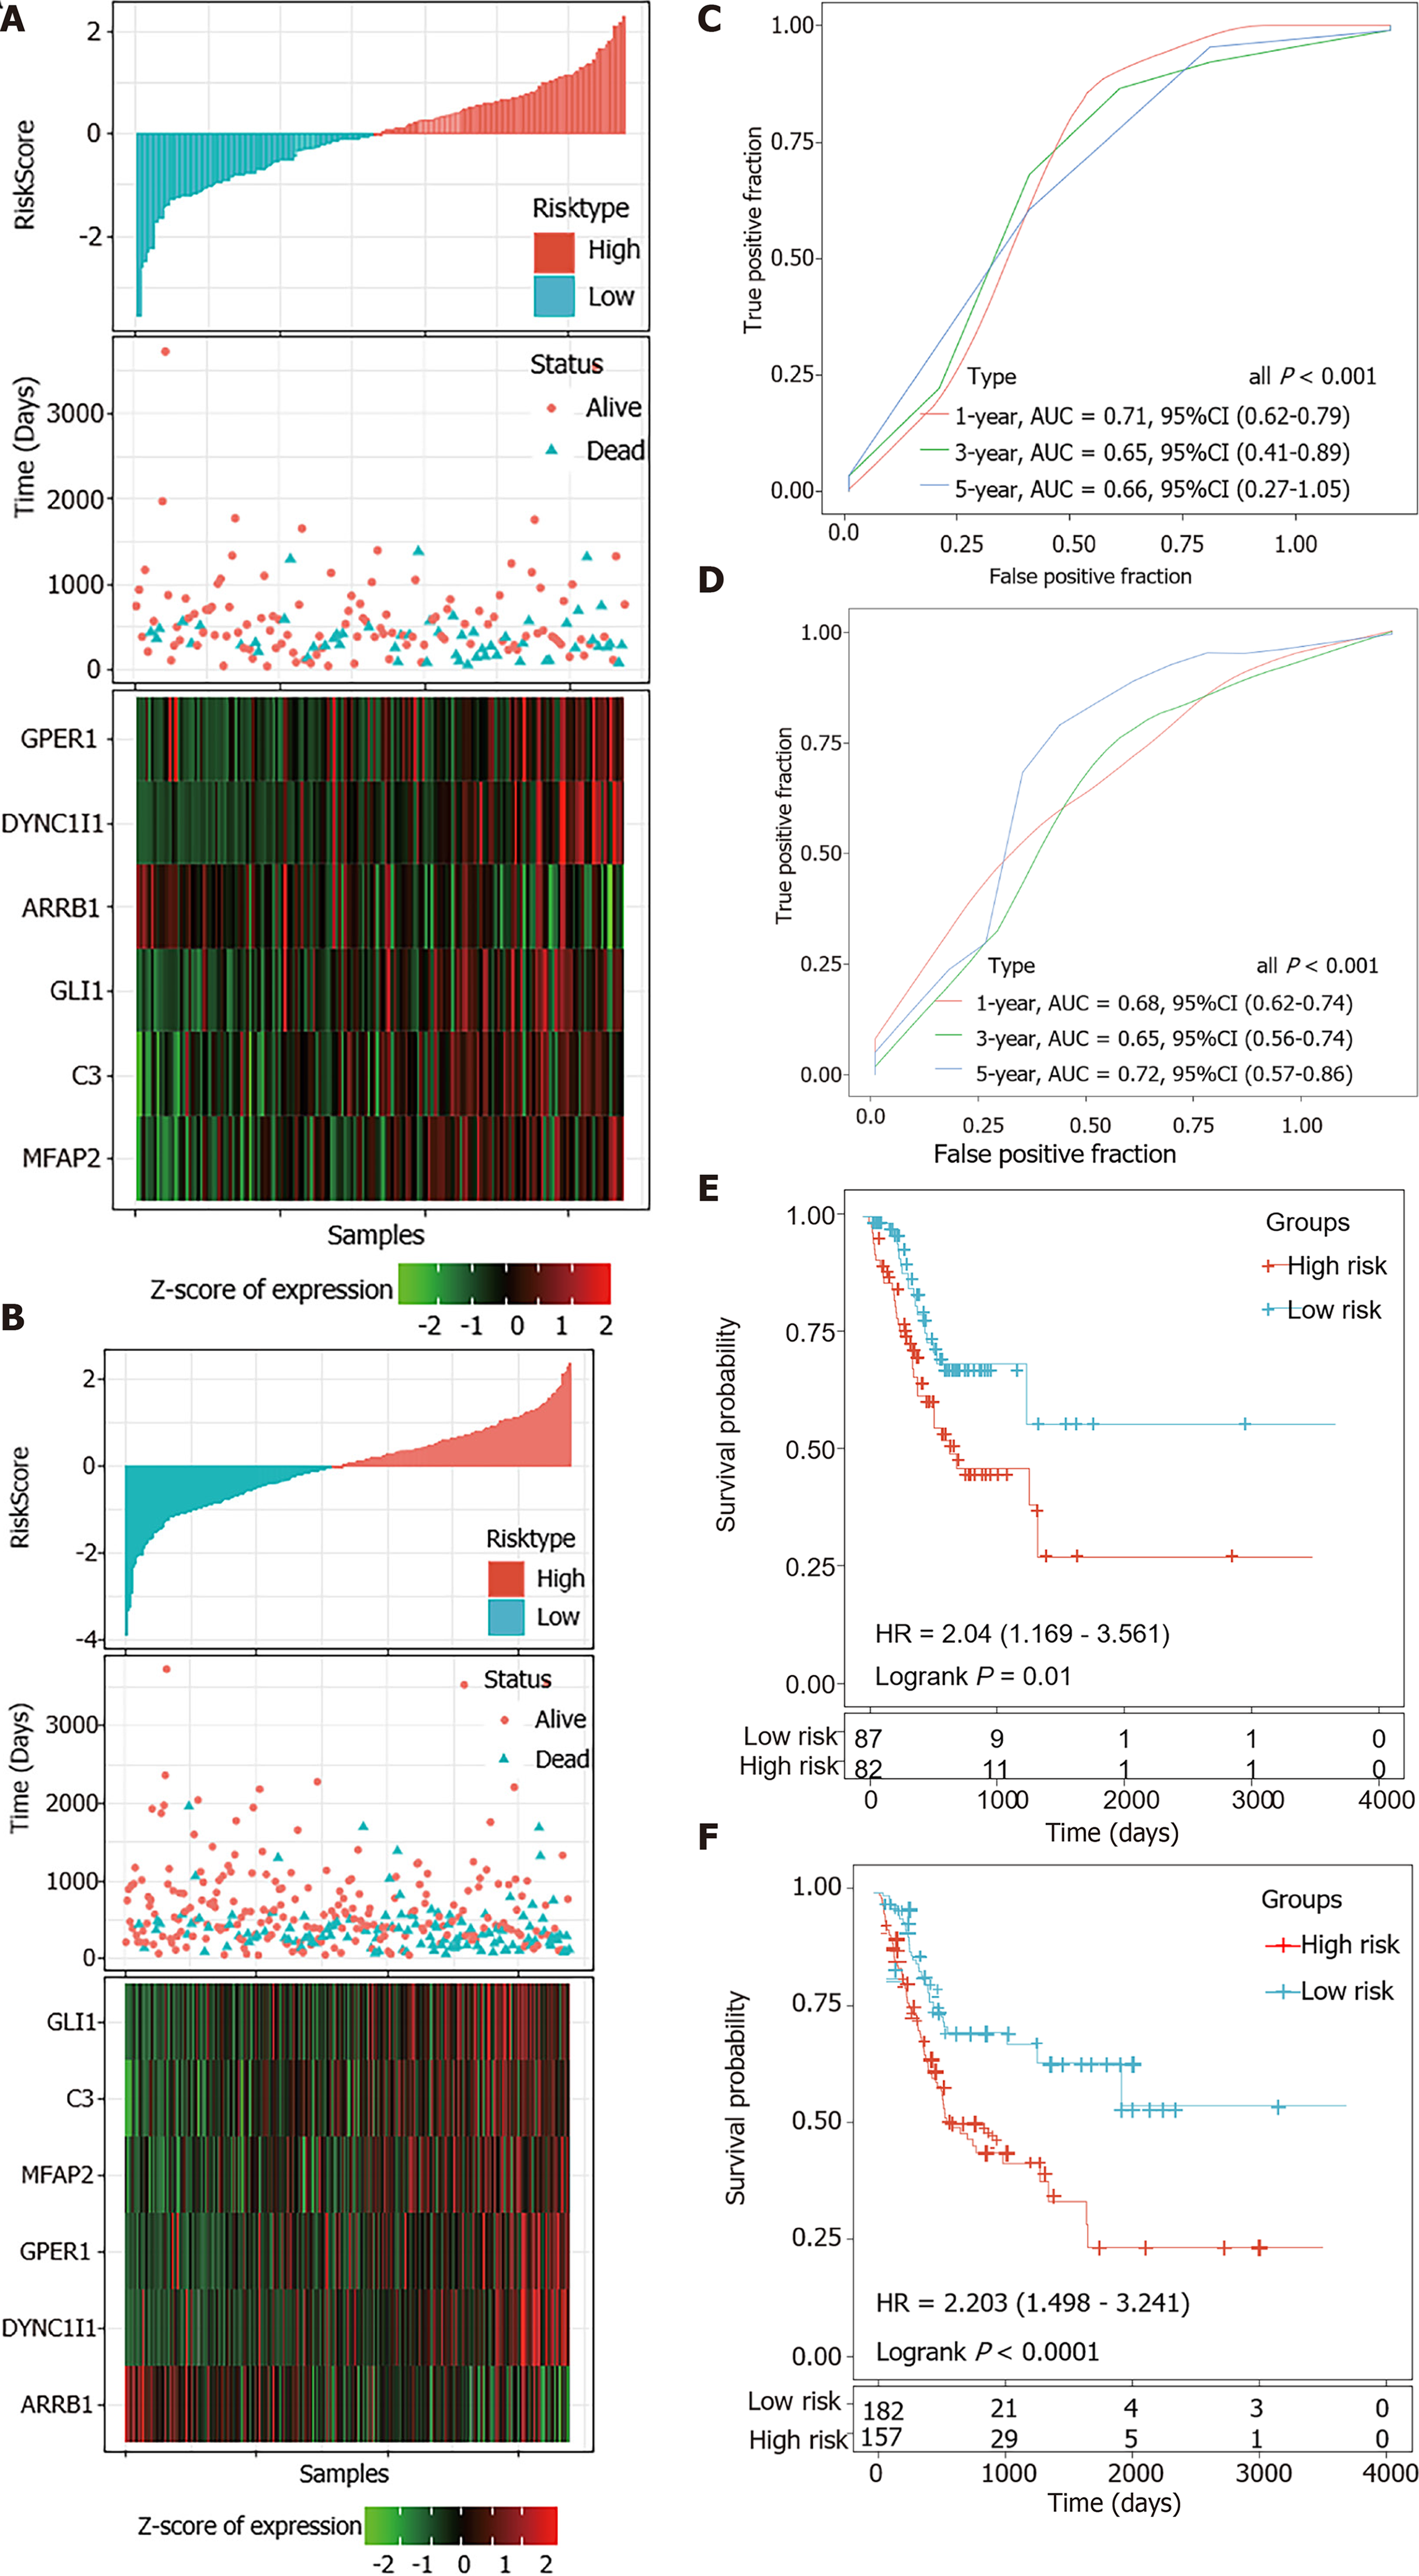
Figure 6 Internal validation of the 6-gene signature’s robustness in the internal validation set and entire The Cancer Genome Atlas cohort.
A and B: Risk score, survival time, survival status and expression of the 6-gene signature in the internal validation set (A) and the entire The Cancer Genome Atlas (TCGA) cohort (B); C and D: Receiver operating characteristic (ROC) curve of the 6-gene signature for 1-year, 3-year and 5-year survival in the internal validation set (C) and the entire TCGA cohort (D); E and F: Kaplan-Meier survival analysis of PFS for high-risk or low-risk group patients in the internal validation set (E) and the entire TCGA cohort (F). AUC: Area under the curve; HR: Hazard ratio; CI: Confidence interval.
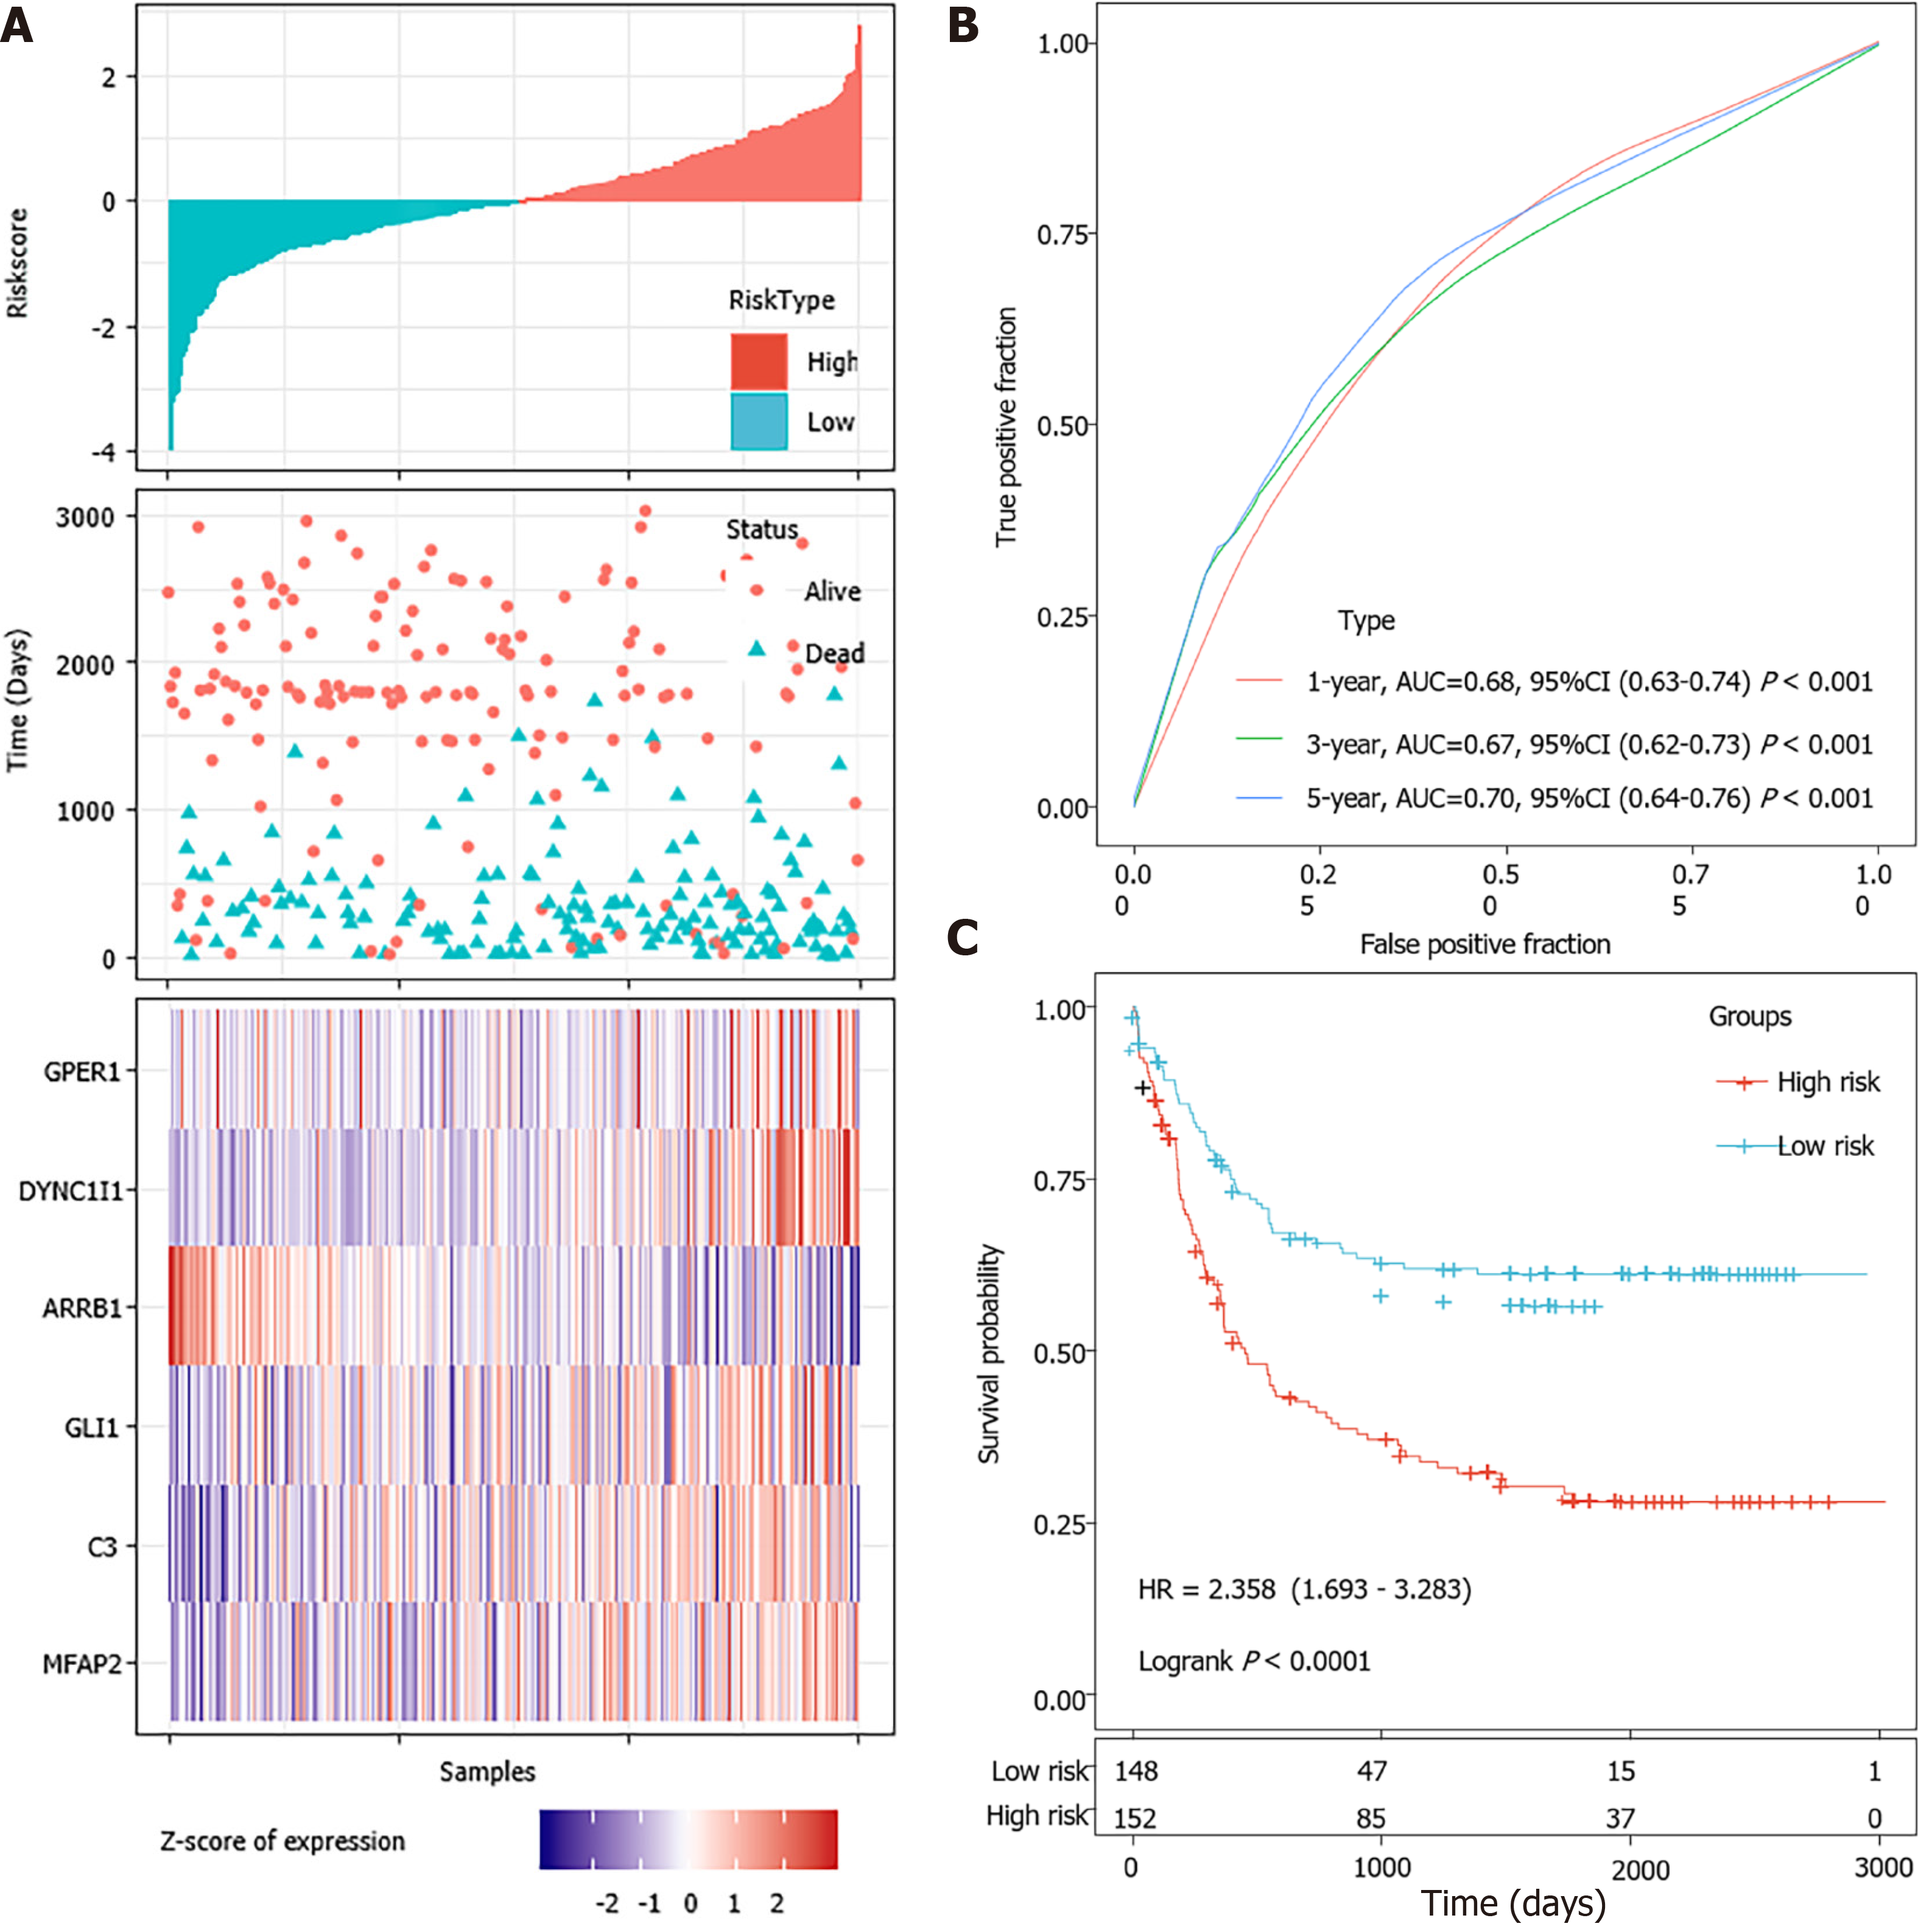
Figure 7 External validation of the 6-gene signature’s robustness in the GSE62254 cohorts.
A: Risk score, survival time, survival status and expression of the 6-gene signature in the GSE62254 cohort; B: Receiver operating characteristic (ROC) curve of the 6-gene signature for 1-year, 3-year and 5-year survival in the GSE62254 cohort; C: Kaplan-Meier survival curve based on the 6-gene signature in the GSE62254 cohort. AUC: Area under the curve; HR: Hazard ratio; CI: Confidence interval.
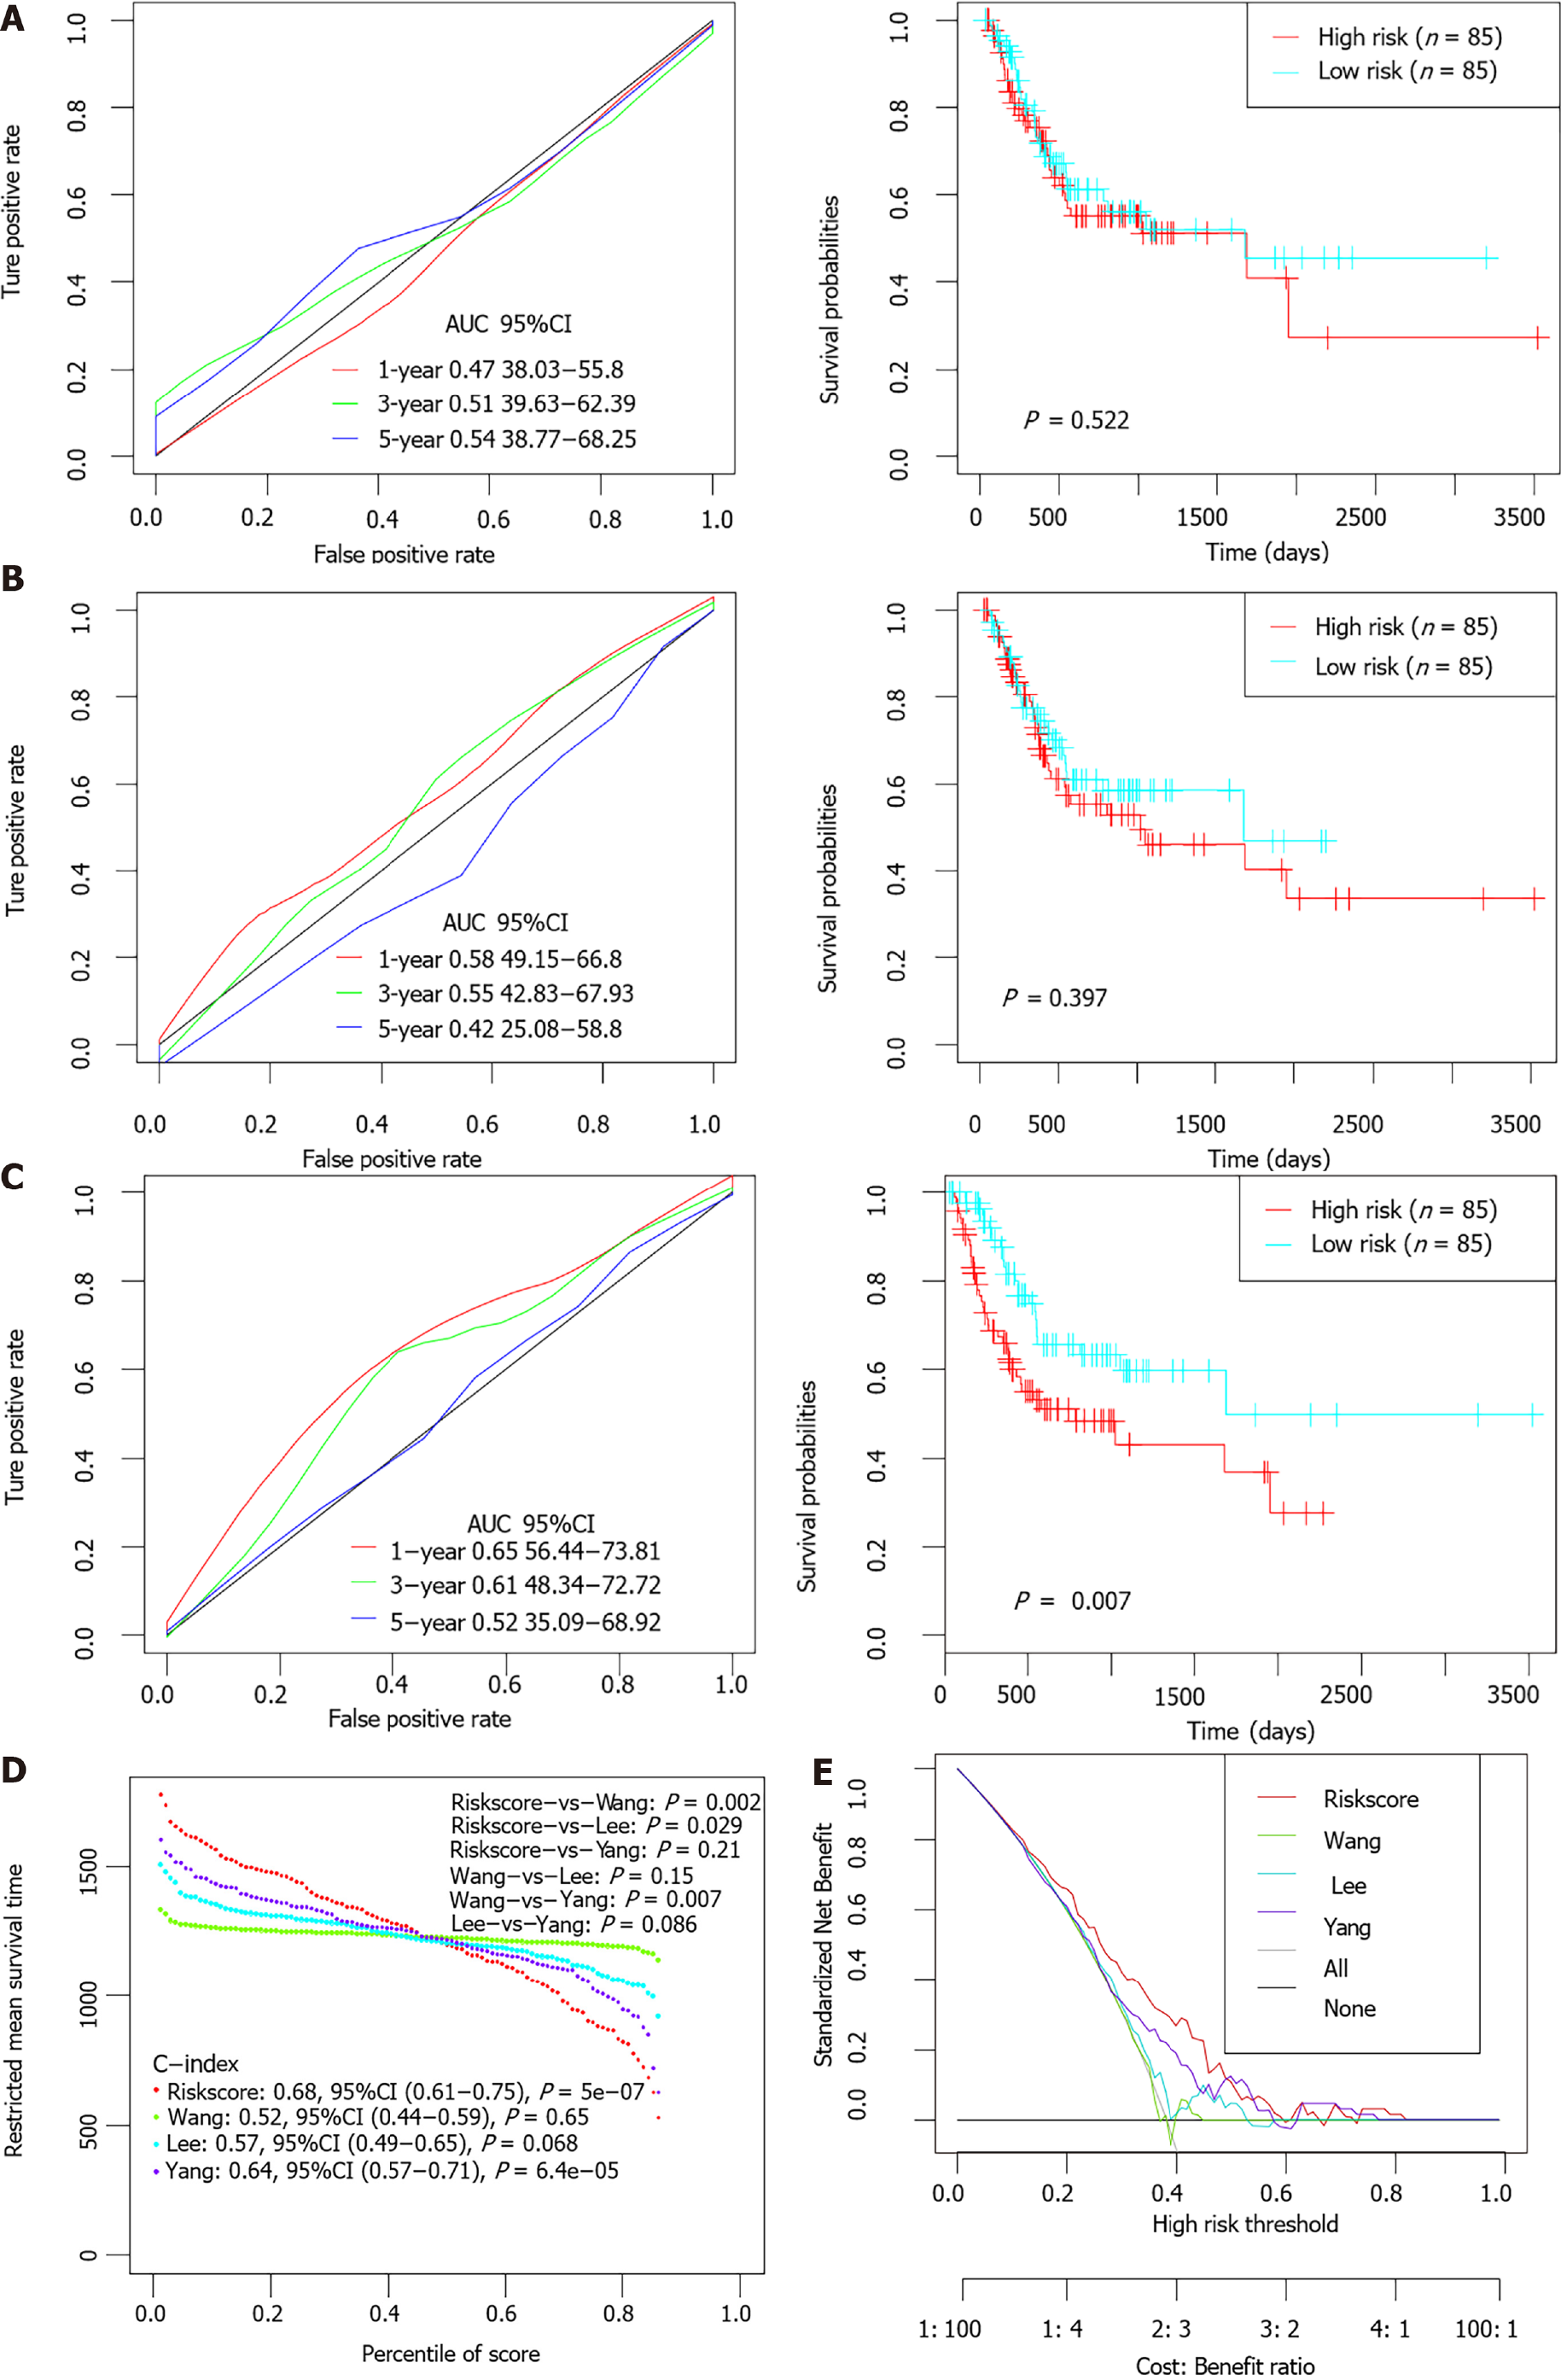
Figure 8 The performance of the 6-gene signature in comparison to previous signatures in The Cancer Genome Atlas stomach adenocarcinoma dataset.
A-C: Receiver operating characteristic (ROC) and Kaplan-Meier curves of the Wang’s (A), Lee’s (B) and Yang’s (C) gene signature for survival in The Cancer Genome Atlas stomach adenocarcinoma dataset cohort; D: Restricted mean survival time curve developed by integrating the indicated 4 signatures; E: DCA plots developed by integrating the indicated 4 signatures. AUC: Area under the curve; HR: Hazard ratio; CI: Confidence interval.
- Citation: Chang JJ, Wang XY, Zhang W, Tan C, Sheng WQ, Xu MD. Comprehensive molecular characterization and identification of prognostic signature in stomach adenocarcinoma on the basis of energy-metabolism-related genes. World J Gastrointest Oncol 2022; 14(2): 478-497
- URL: https://www.wjgnet.com/1948-5204/full/v14/i2/478.htm
- DOI: https://dx.doi.org/10.4251/wjgo.v14.i2.478


