Copyright
©The Author(s) 2022.
World J Gastrointest Oncol. Feb 15, 2022; 14(2): 450-477
Published online Feb 15, 2022. doi: 10.4251/wjgo.v14.i2.450
Published online Feb 15, 2022. doi: 10.4251/wjgo.v14.i2.450
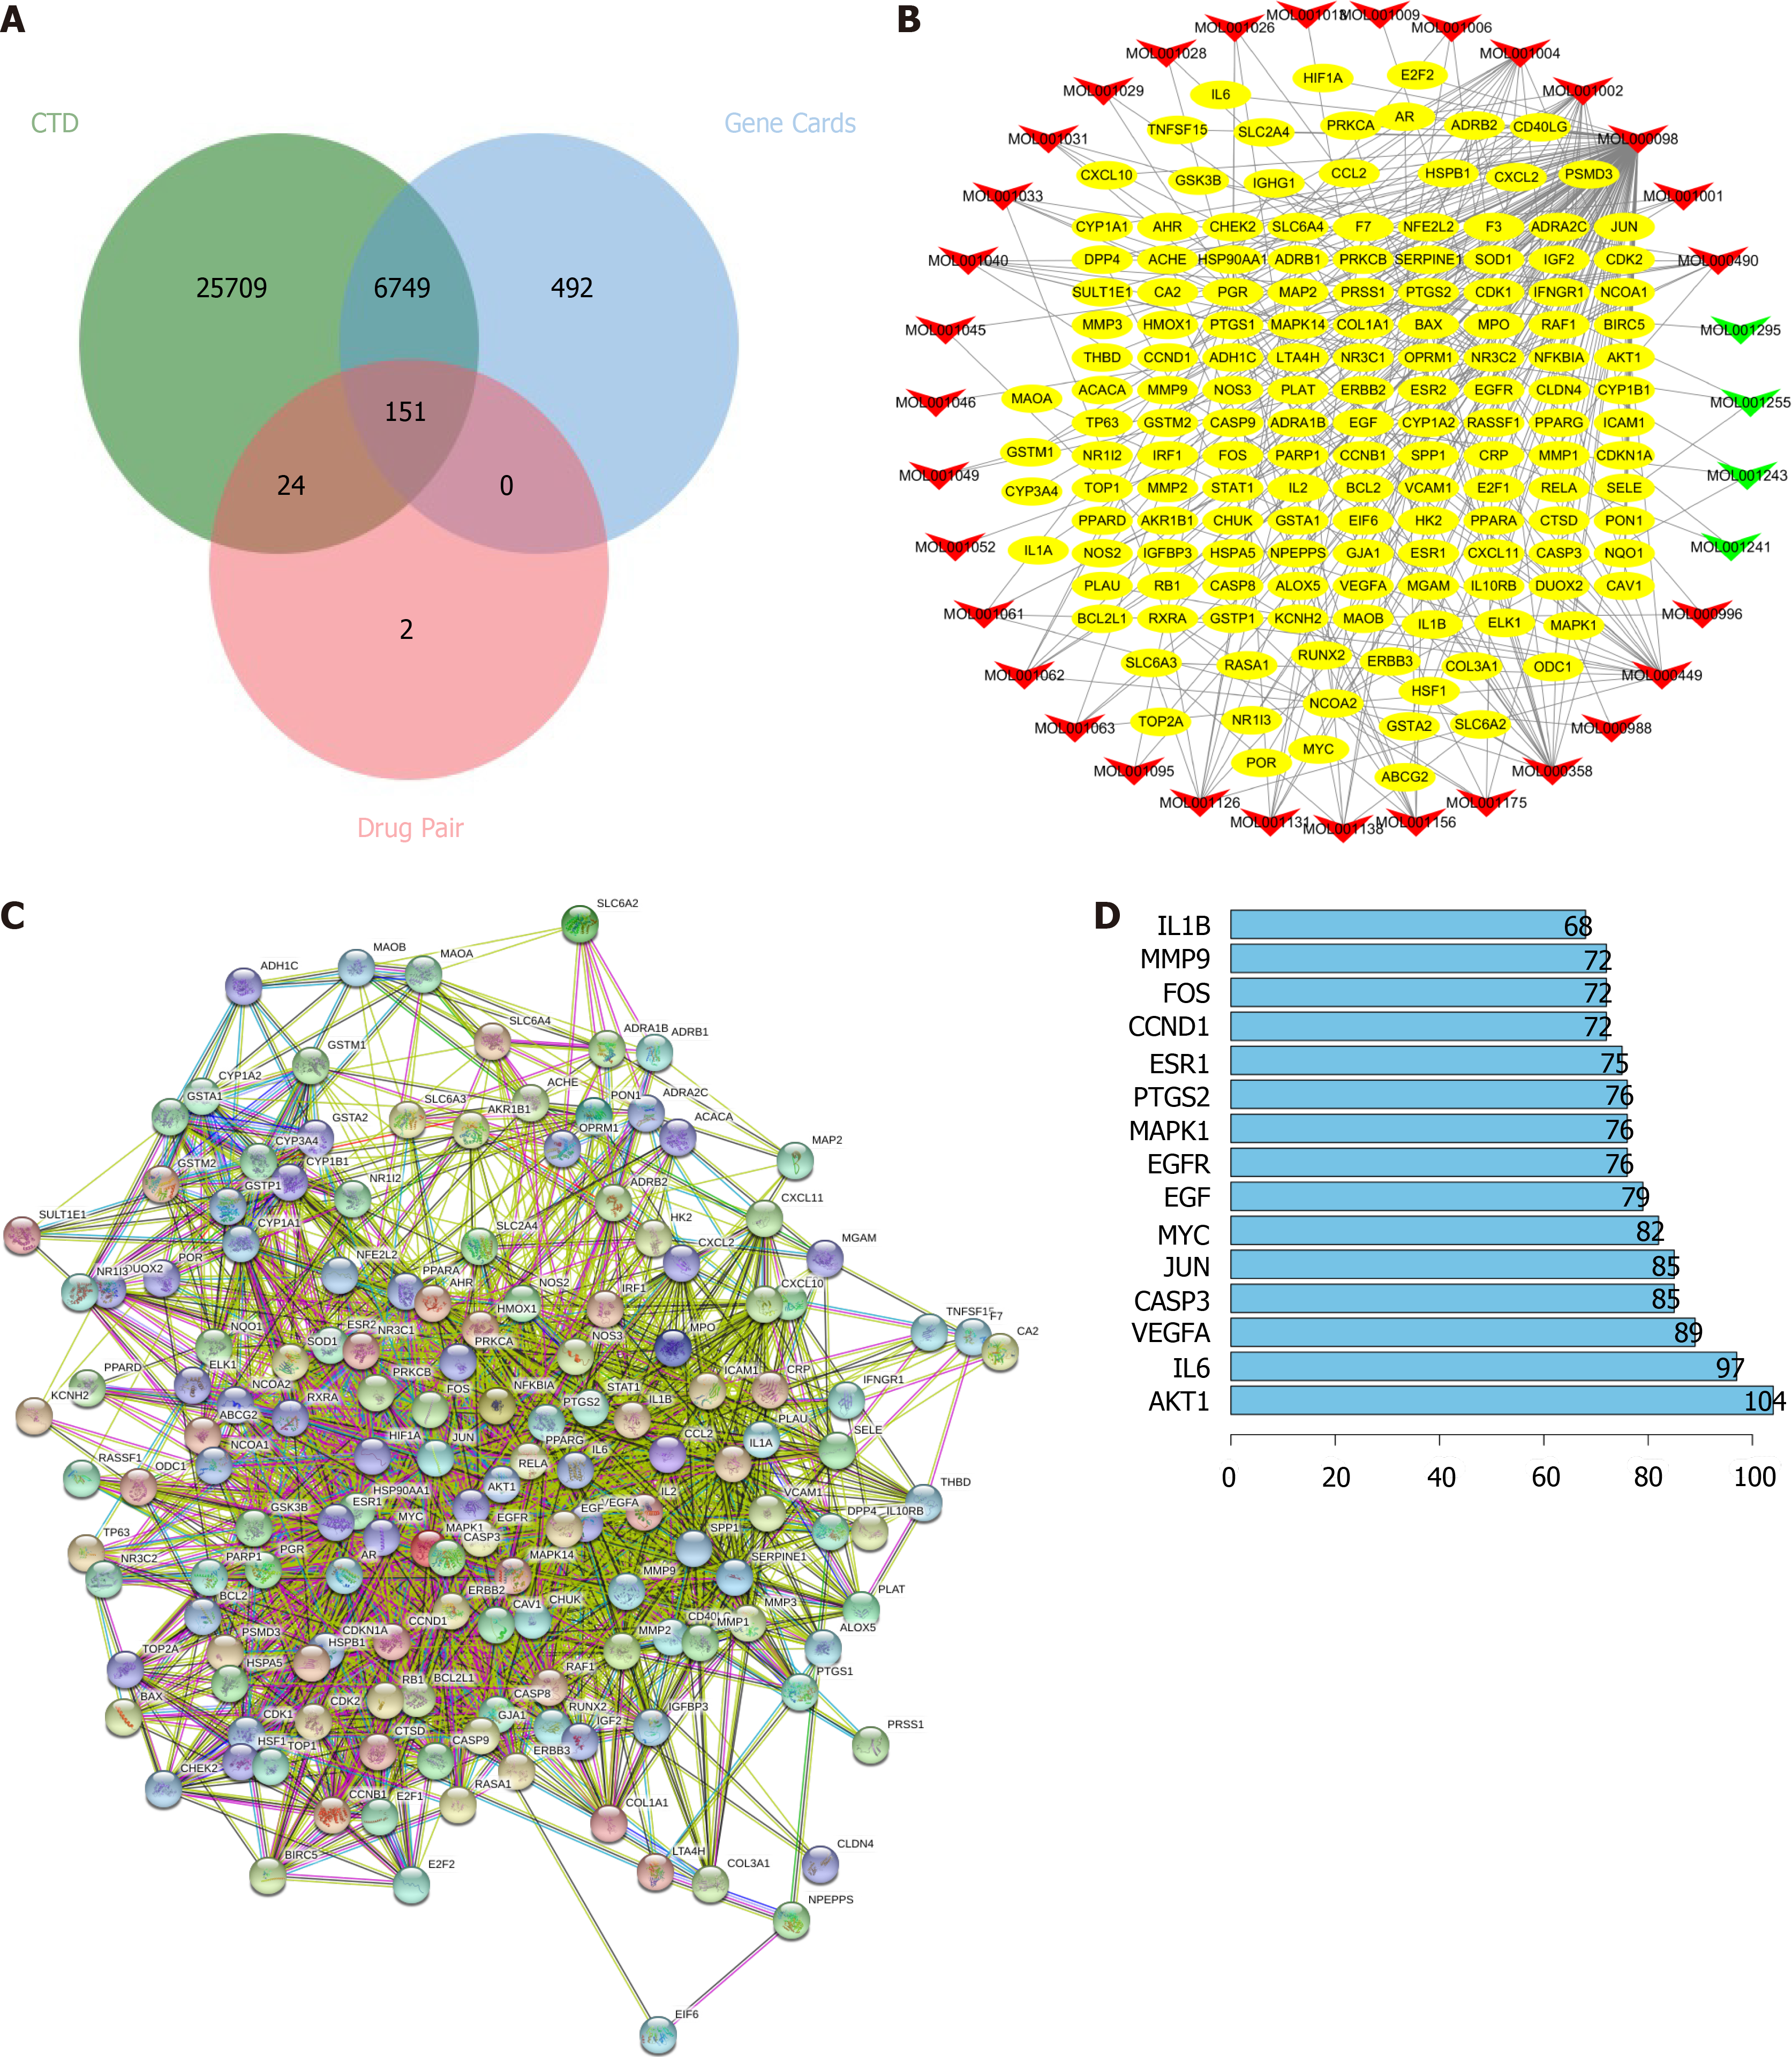
Figure 1 Active component target network and protein-protein interaction network of frankincense and myrrh in the treatment of hepatocellular carcinoma.
A: Wayne diagram of the targets; B: Compound-target network. Yellow oval node represents the key target, the green node represents the active ingredient of frankincense, and the red node represents the active ingredient of myrrh, The edges represent the interactions between them; C: Protein-protein interaction network. Circular nodes represent targets and edges represent interactions; D: The bar chart of the sorting of the core target. The abscissa represents the number of nodes, and the ordinate is the name of the core target.
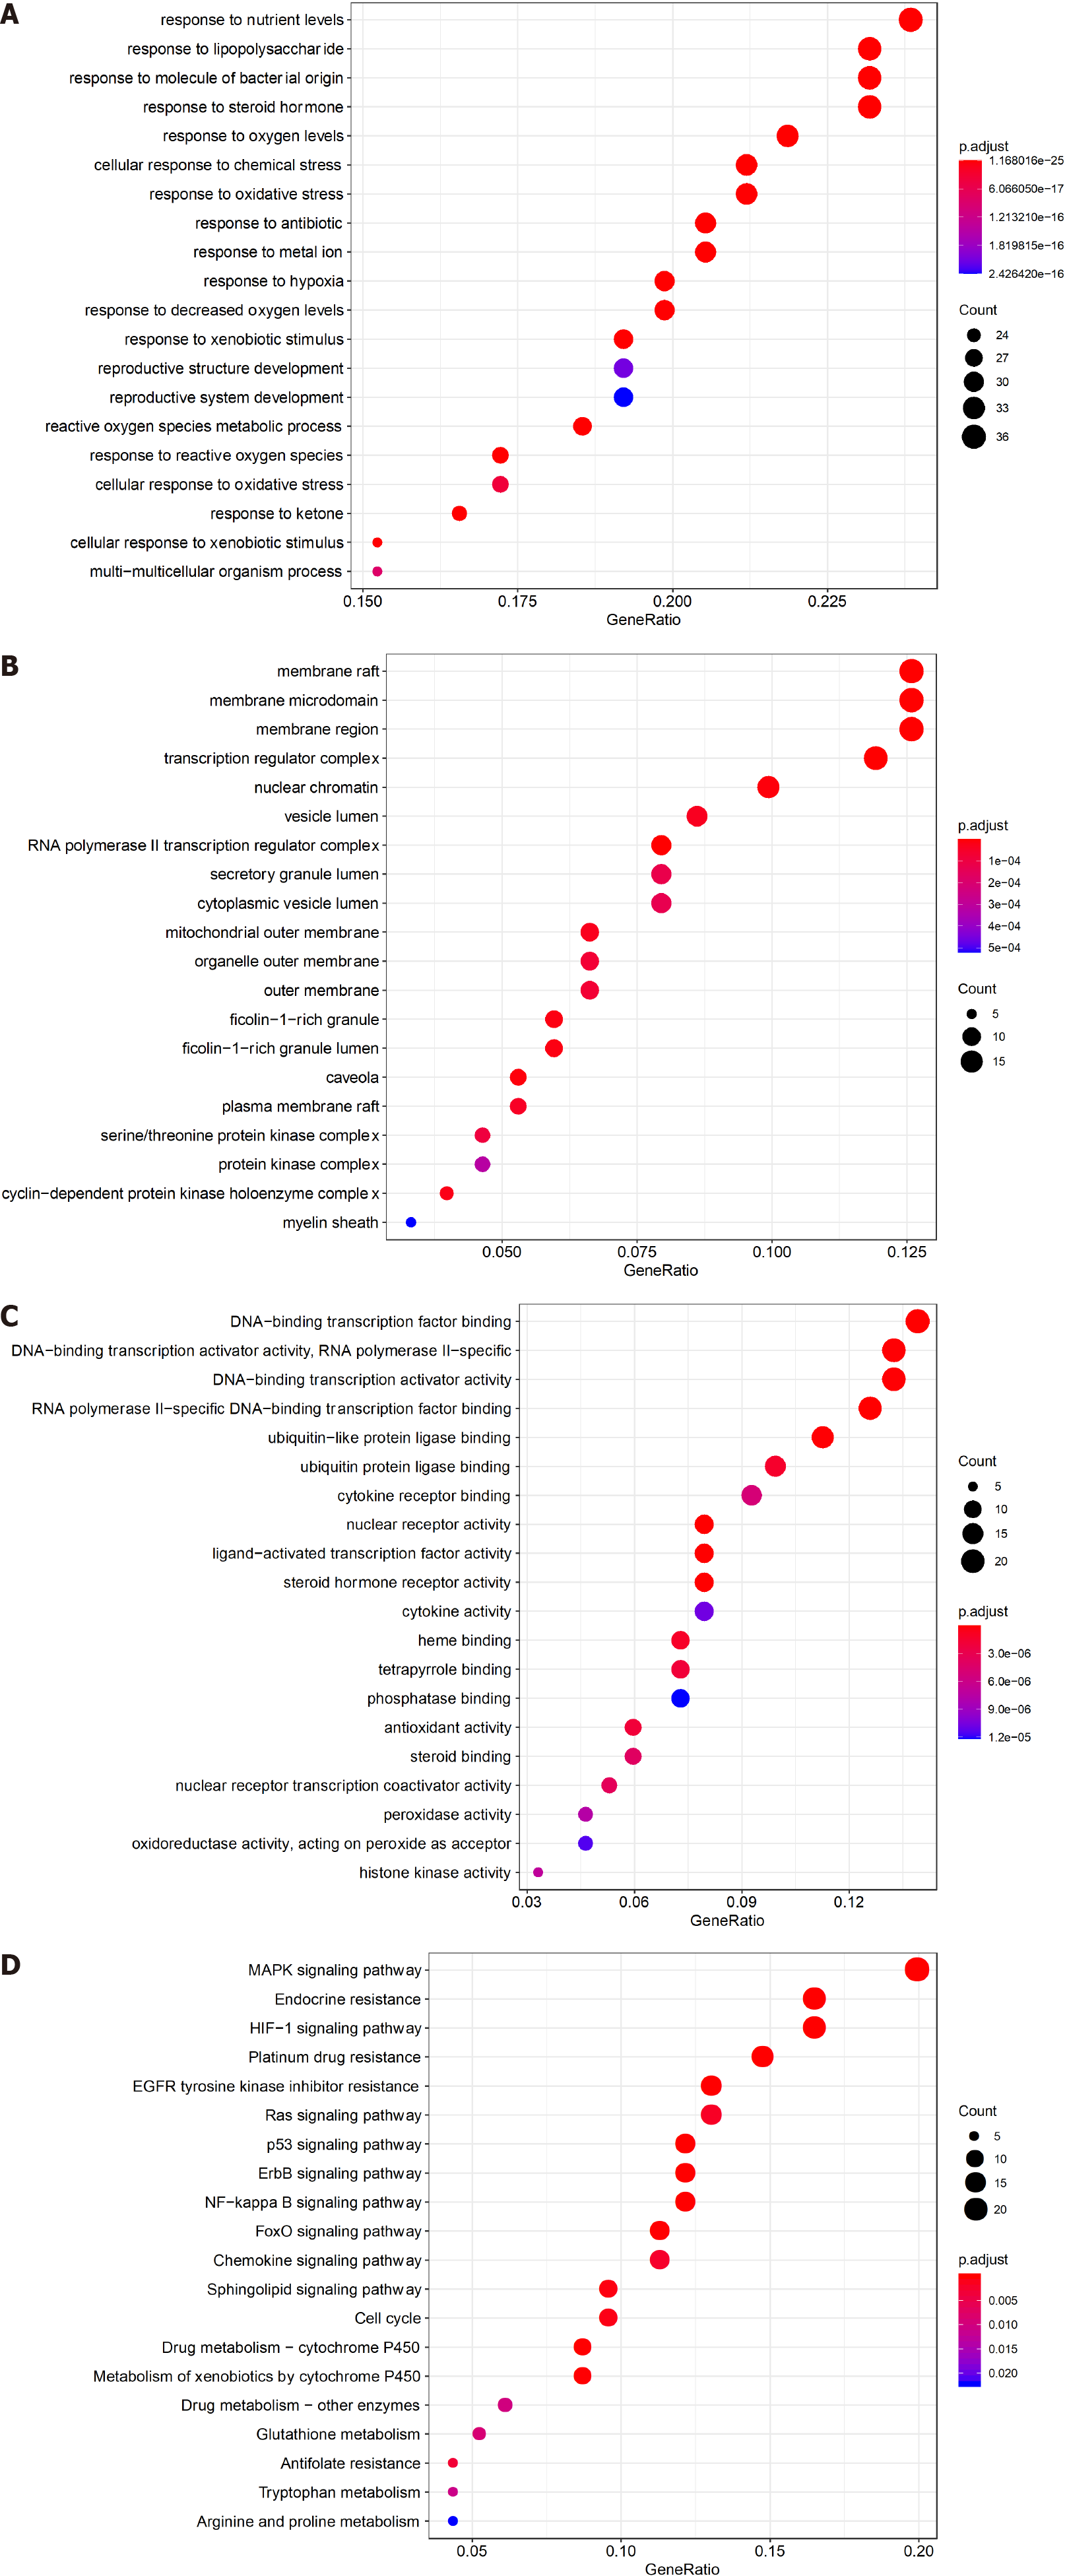
Figure 2 Enrichment analysis of frankincense and myrrh key targets on hepatocellular carcinoma.
A-C: GO analysis; A: Biological process; B: Cellular component; C: Molecular function; D: KEGG analysis.
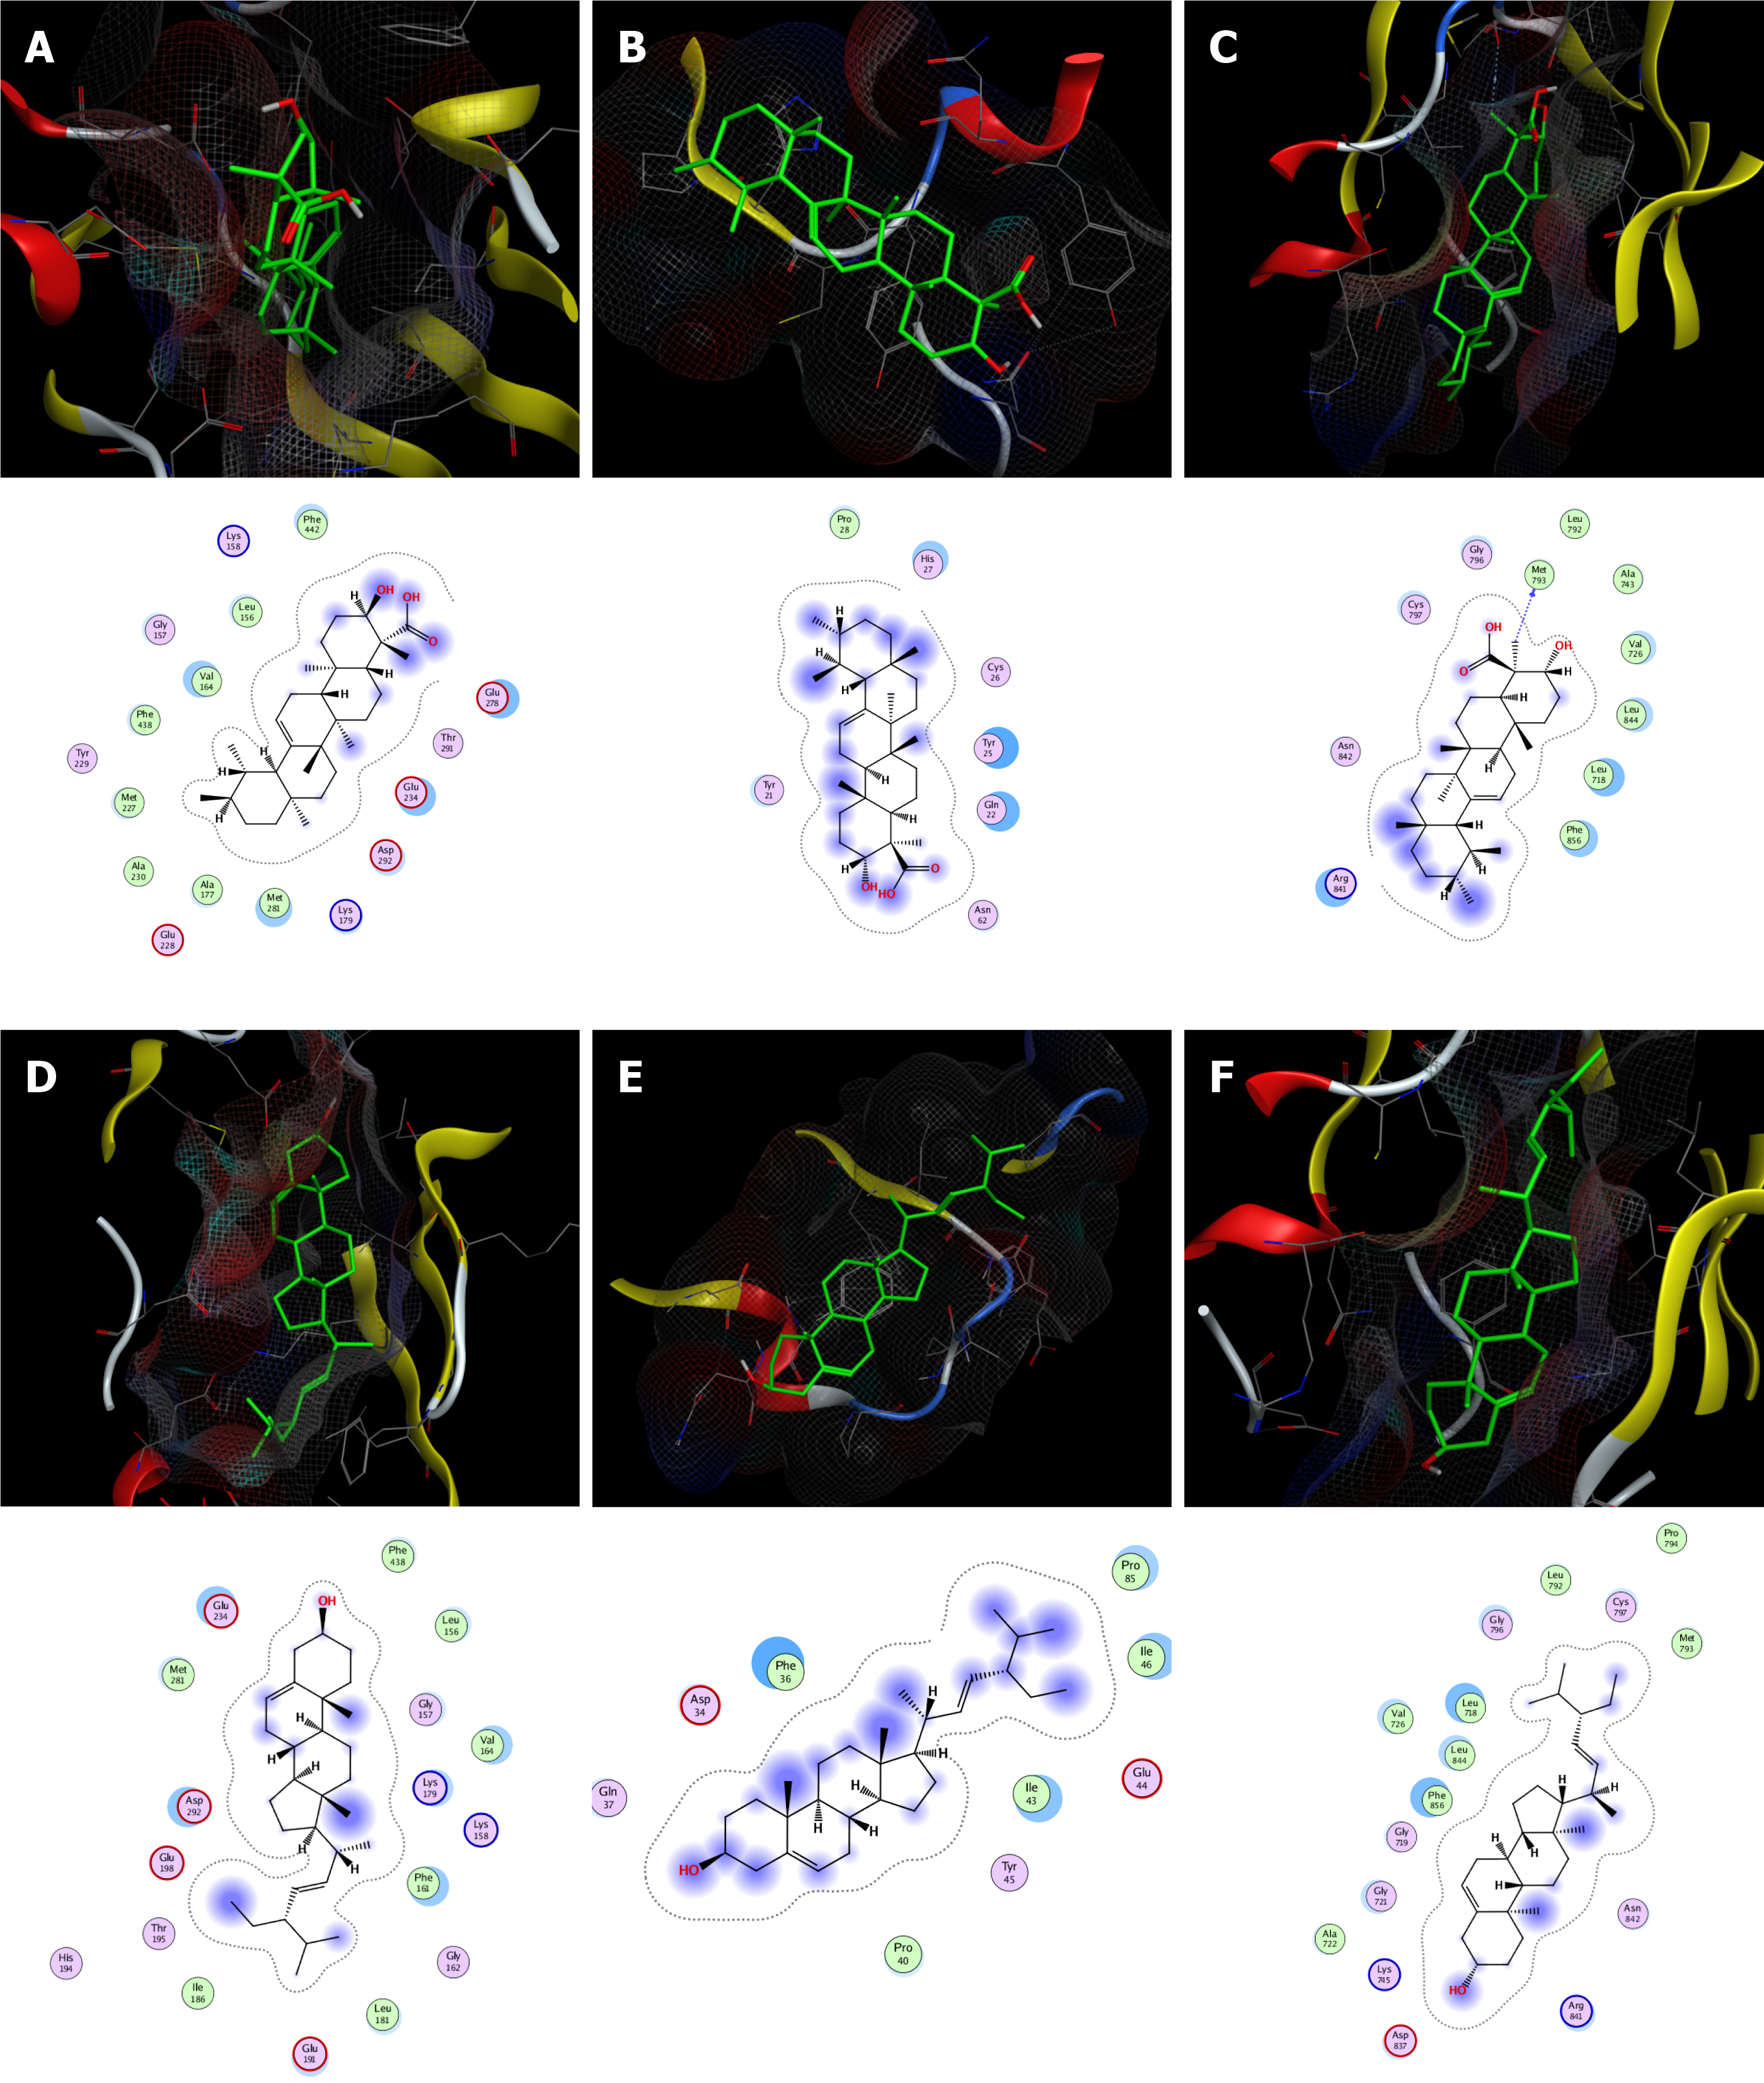
Figure 3 The docking model of boswellic acid and stigmasterol with key targets.
A: Boswellic acid with AKT1; B: Boswellic acid with VEGFA; C: Boswellic acid with EGFR; D: Stigmasterol with AKT1; E: Stigmasterol with VEGFA; F: Stigmasterol with EGFR.
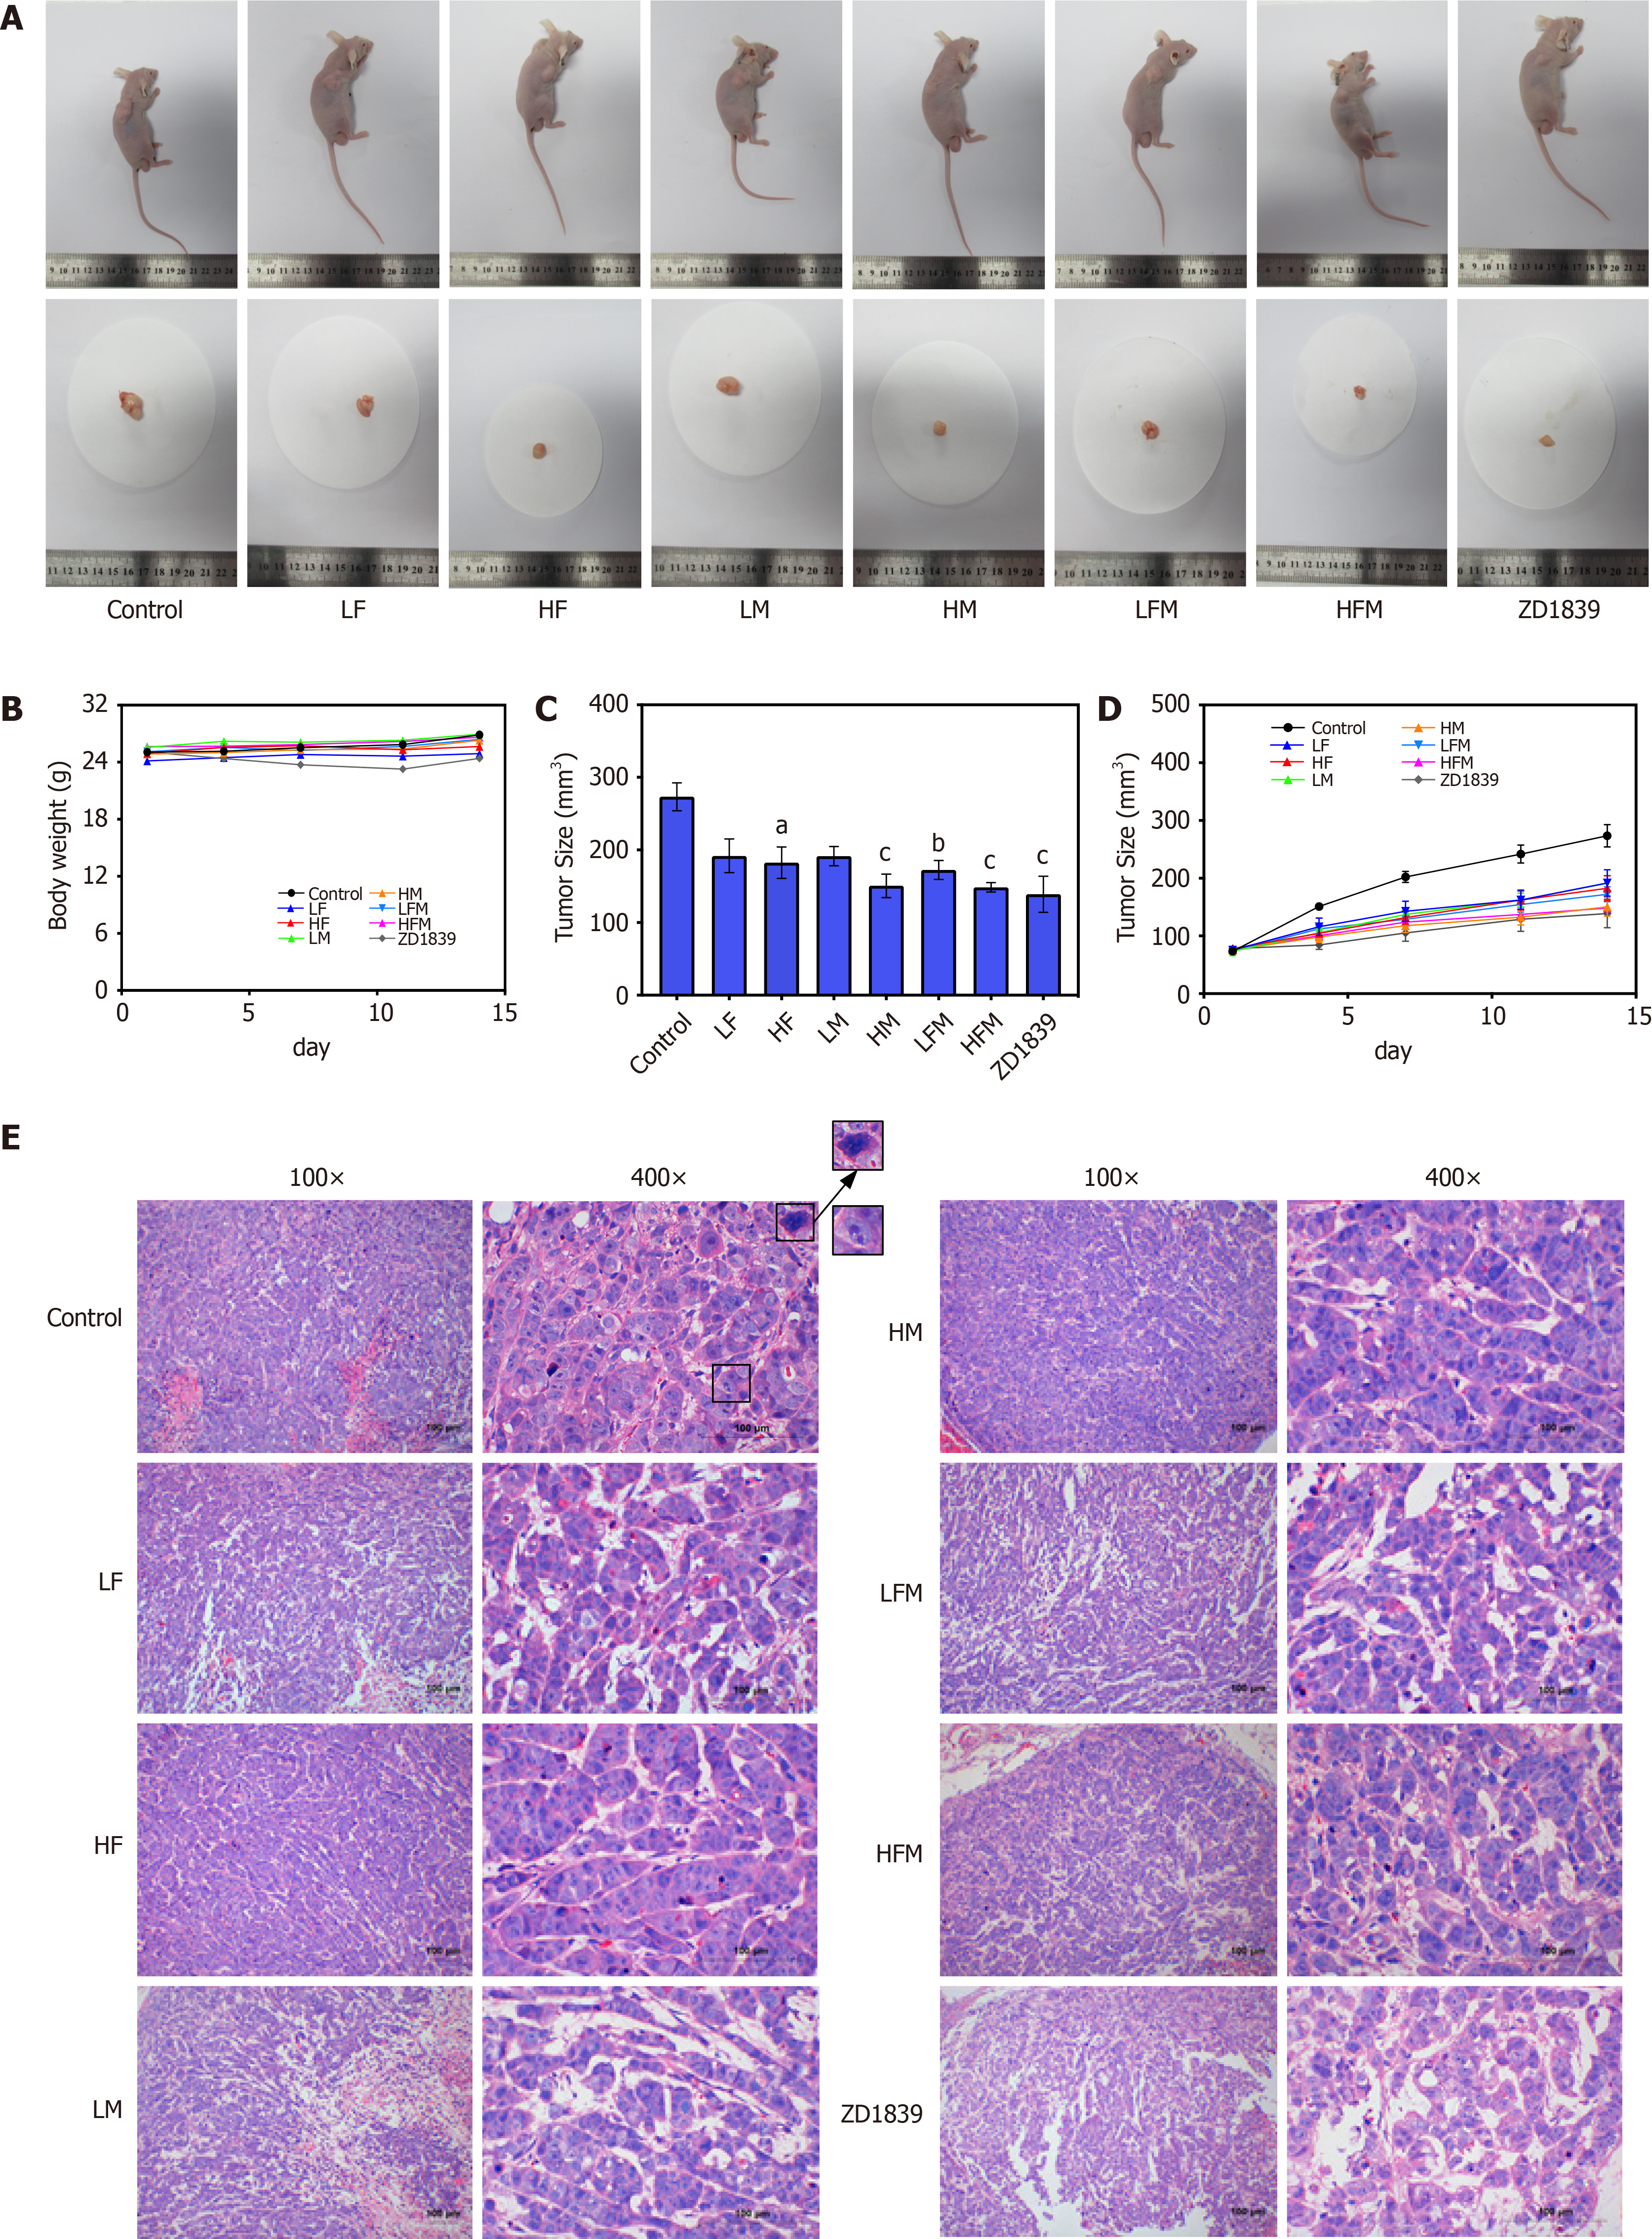
Figure 4 The effect of frankincense and/or myrrh in the tumor growth of human hepatocellular carcinoma subcutaneously transplanted tumor models.
A: Representative images of tumor size at the end of the experiment; B: Animal weight during the entire oral treatment process; C: Statistical graph of tumor size at the end of the experiment; D: Changes in tumor size during the entire oral treatment process; E: H-E staining of tumors in each group (100×, 400×), scale bars: 100 μm. LF: Low dose of frankincense extract; HF: High dose of frankincense extract; LM: Low dose of myrrh extract; HM: High dose of myrrh extract; LFM: Low dose of frankincense + myrrh extracts; HFM: High dose of frankincense + myrrh extracts. Data represents the mean ± SE. Compared with the model control, aP < 0.05, bP < 0.01, cP < 0.001.
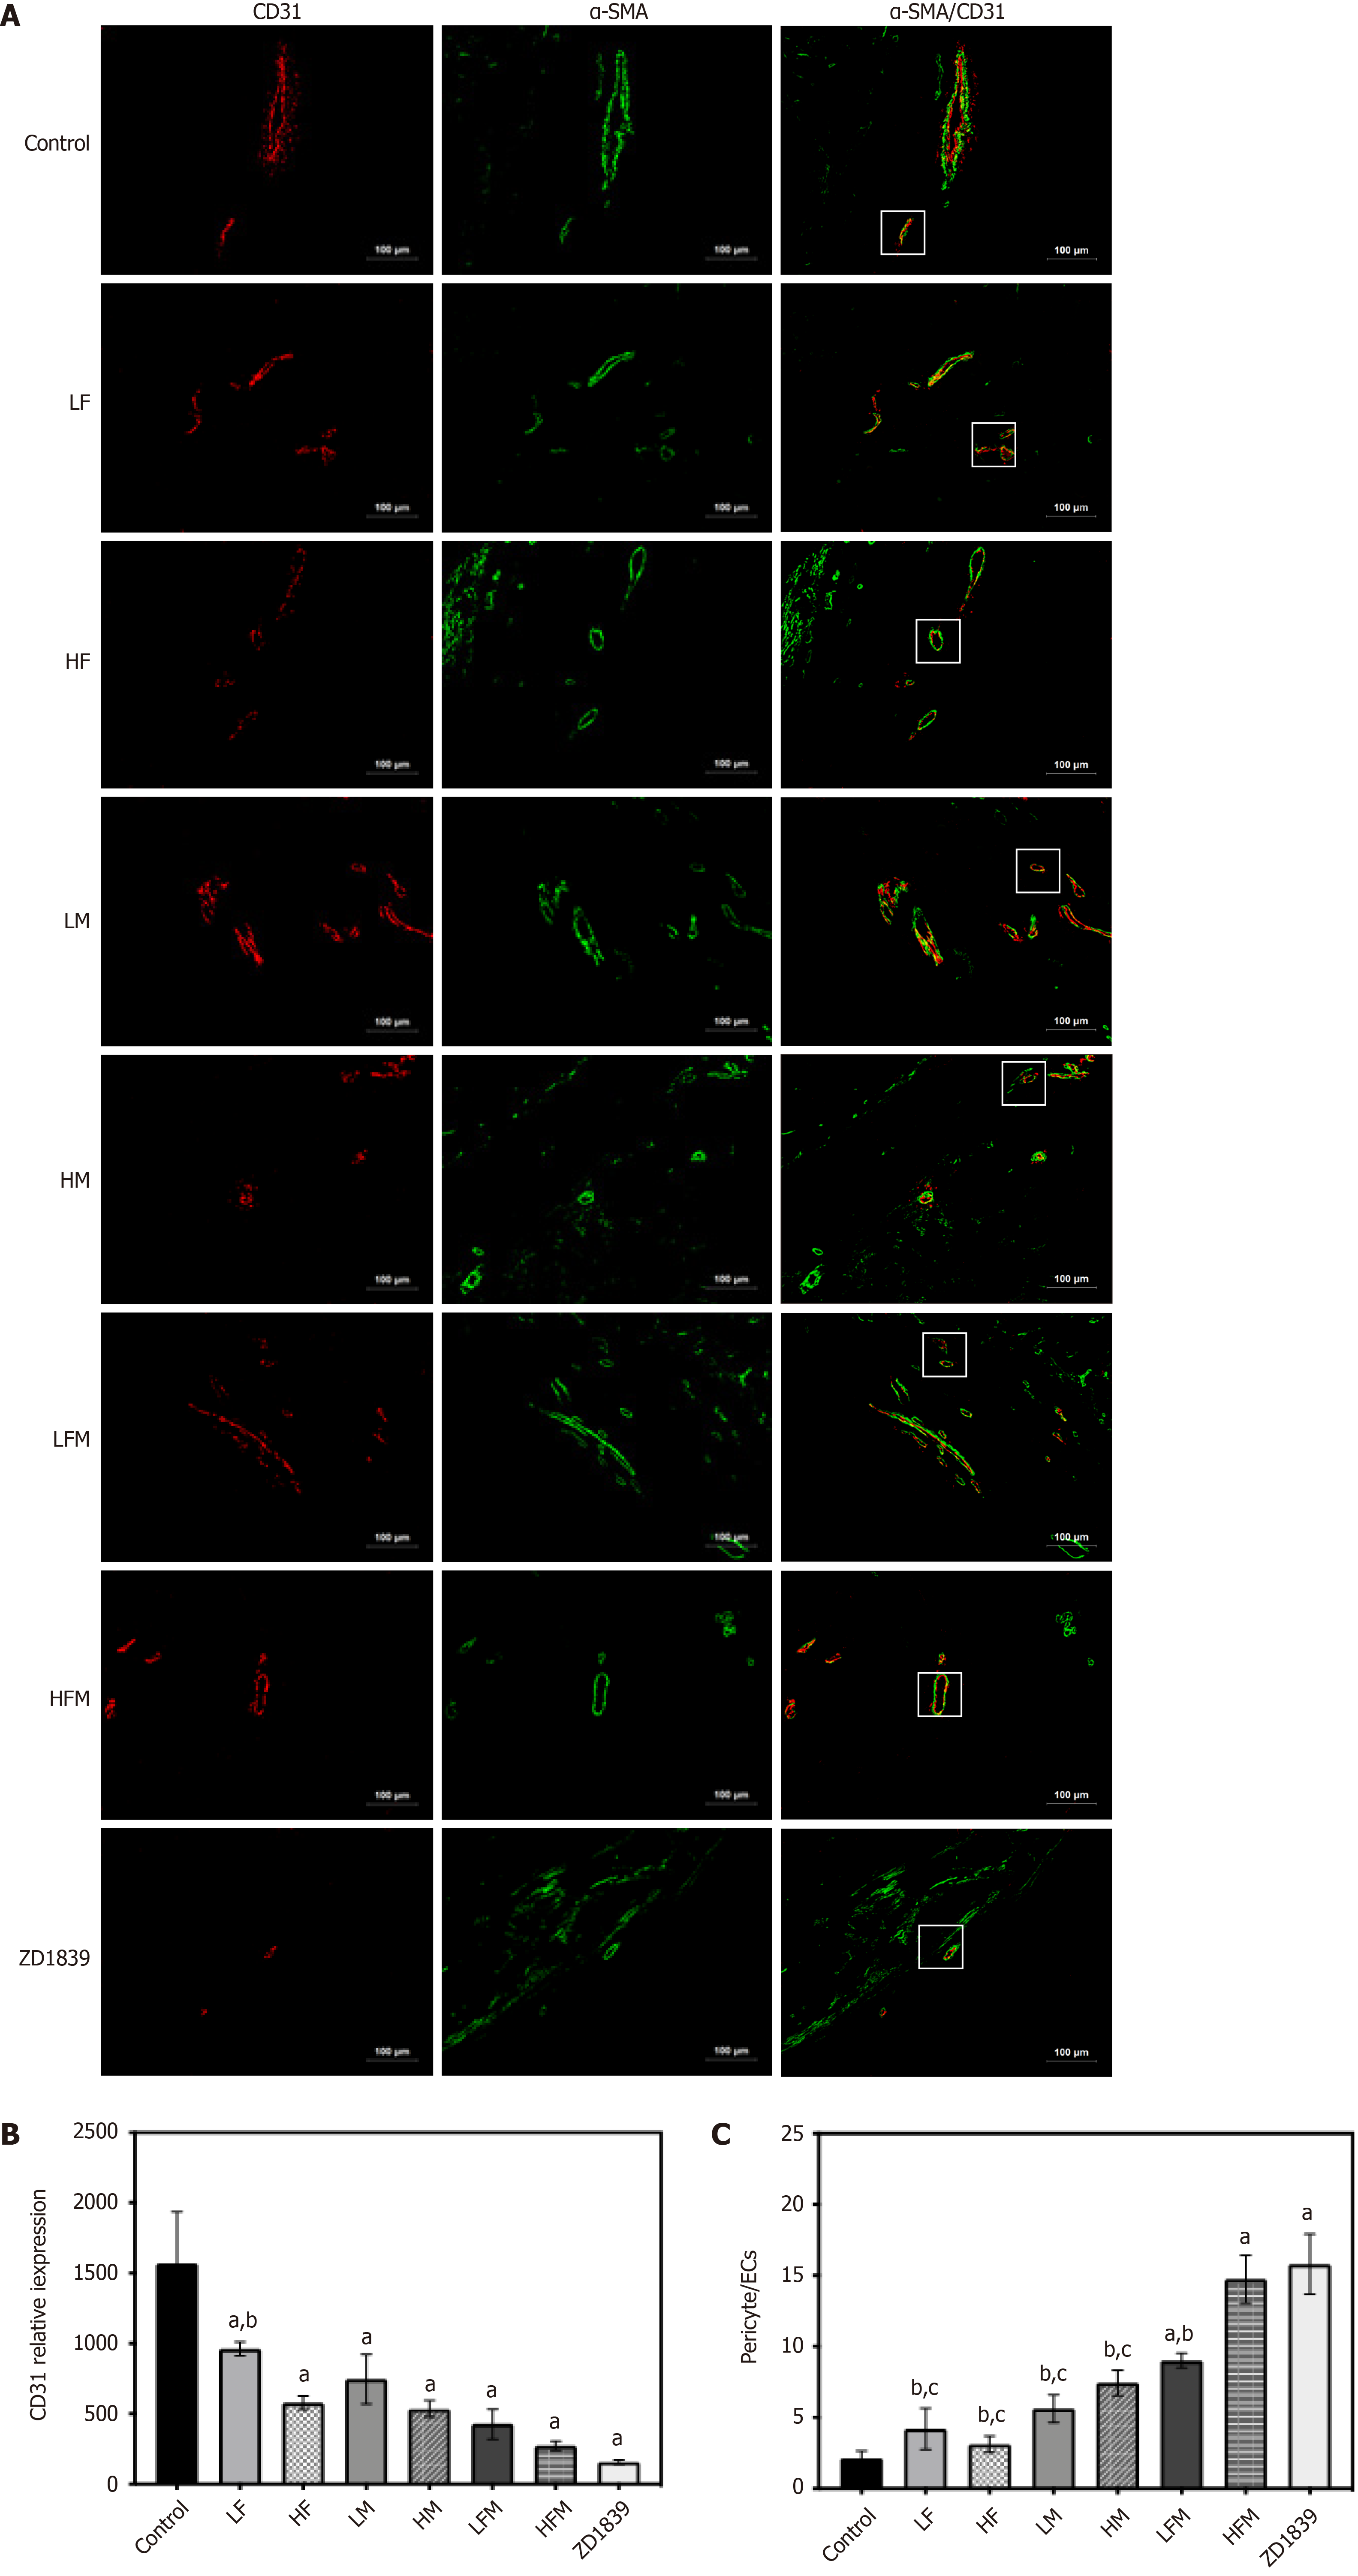
Figure 5 The effect of frankincense and/or myrrh on CD31 and α-SMA (200×).
A: Immunofluorescence staining of the tumor was indicated by CD31 antibody (red) and α-SMA antibody (green); B: The relative expression of CD31; C: The expression of α-SMA/CD31. Scale bars: 100 μm. LF: Low dose of frankincense extract; HF: High dose of frankincense extract; LM: Low dose of myrrh extract; HM: High dose of myrrh extract; LFM: Low dose of frankincense + myrrh extracts; HFM: High dose of frankincense + myrrh extracts. Data represents the mean ± SE. aP < 0.05 vs the model control; bP < 0.05 vs ZD1839; cP < 0.05 vs high dose of frankincense + myrrh extracts.
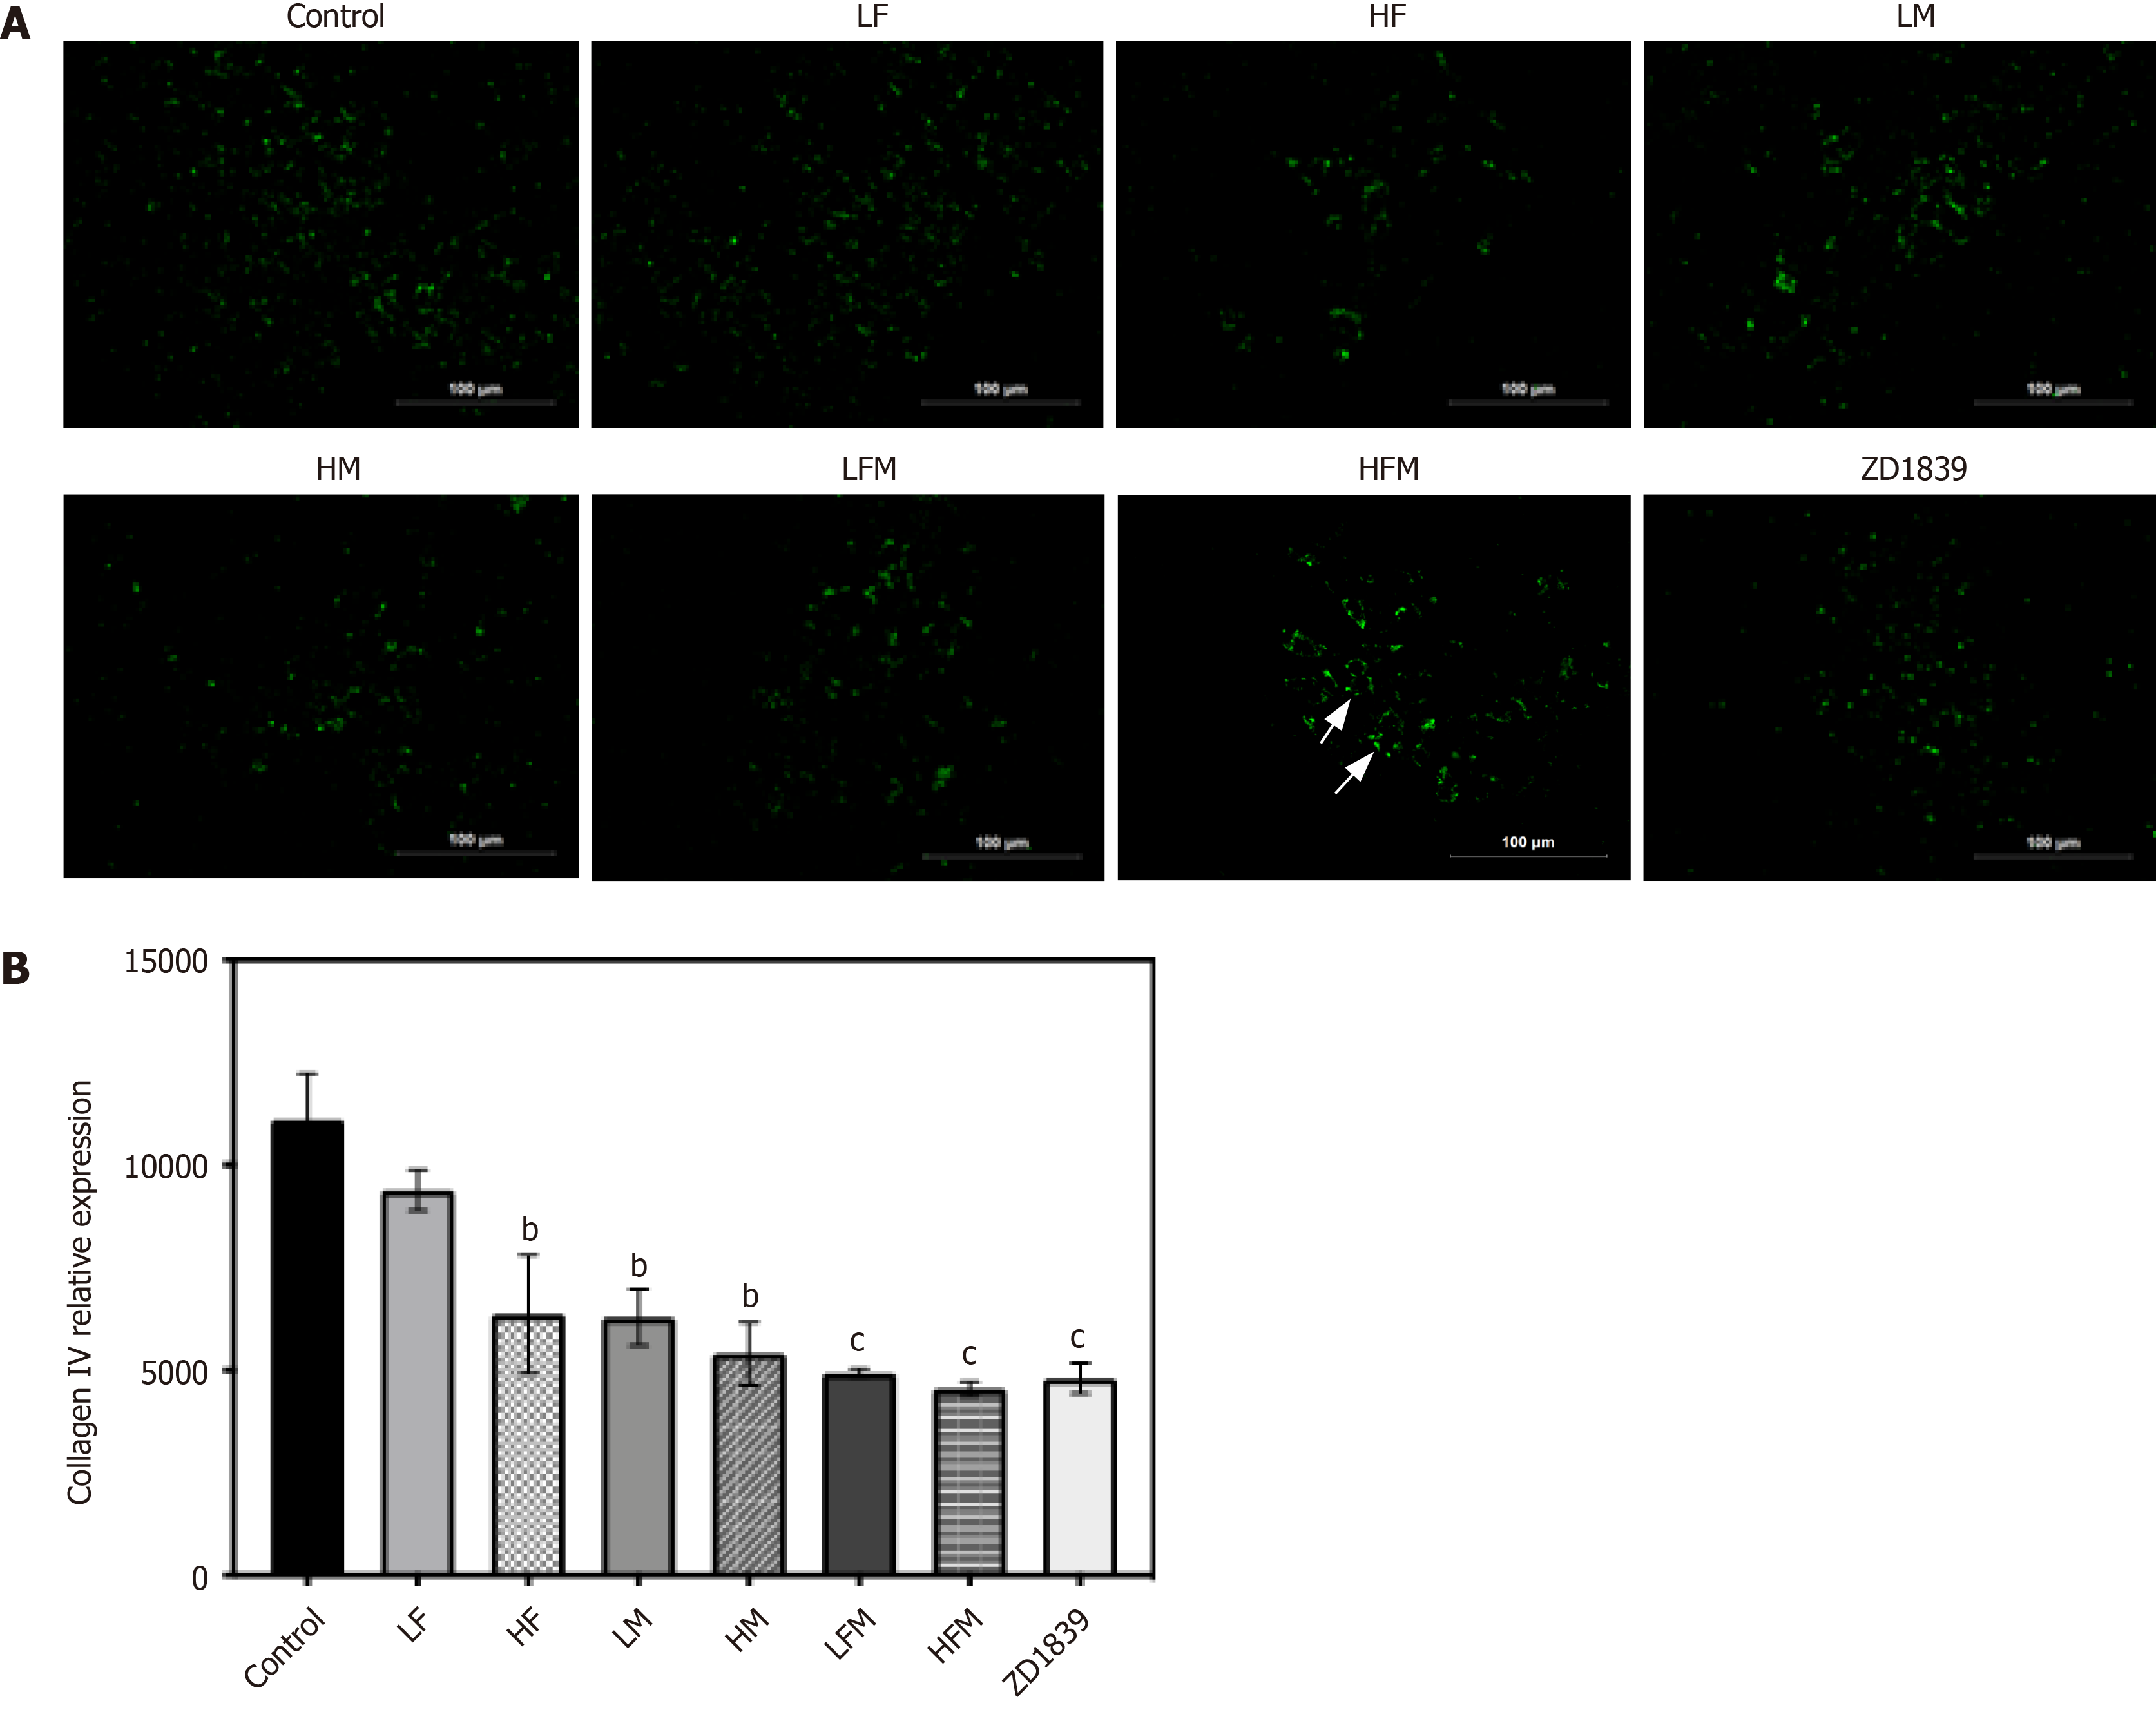
Figure 6 The effect of frankincense and/or myrrh on collagen IV (400×).
A: Immunofluorescence staining of the tumor was indicated by collagen IV antibody (green); B: The relative expression of collagen IV. Scale bars: 100 μm. LF: Low dose of frankincense extract; HF: High dose of frankincense extract; LM: Low dose of myrrh extract; HM: High dose of myrrh extract; LFM: Low dose of frankincense + myrrh extracts; HFM: High dose of frankincense + myrrh extracts. Data represents the mean ± SE. Compared with the model control, aP < 0.05, bP < 0.01, cP < 0.001.
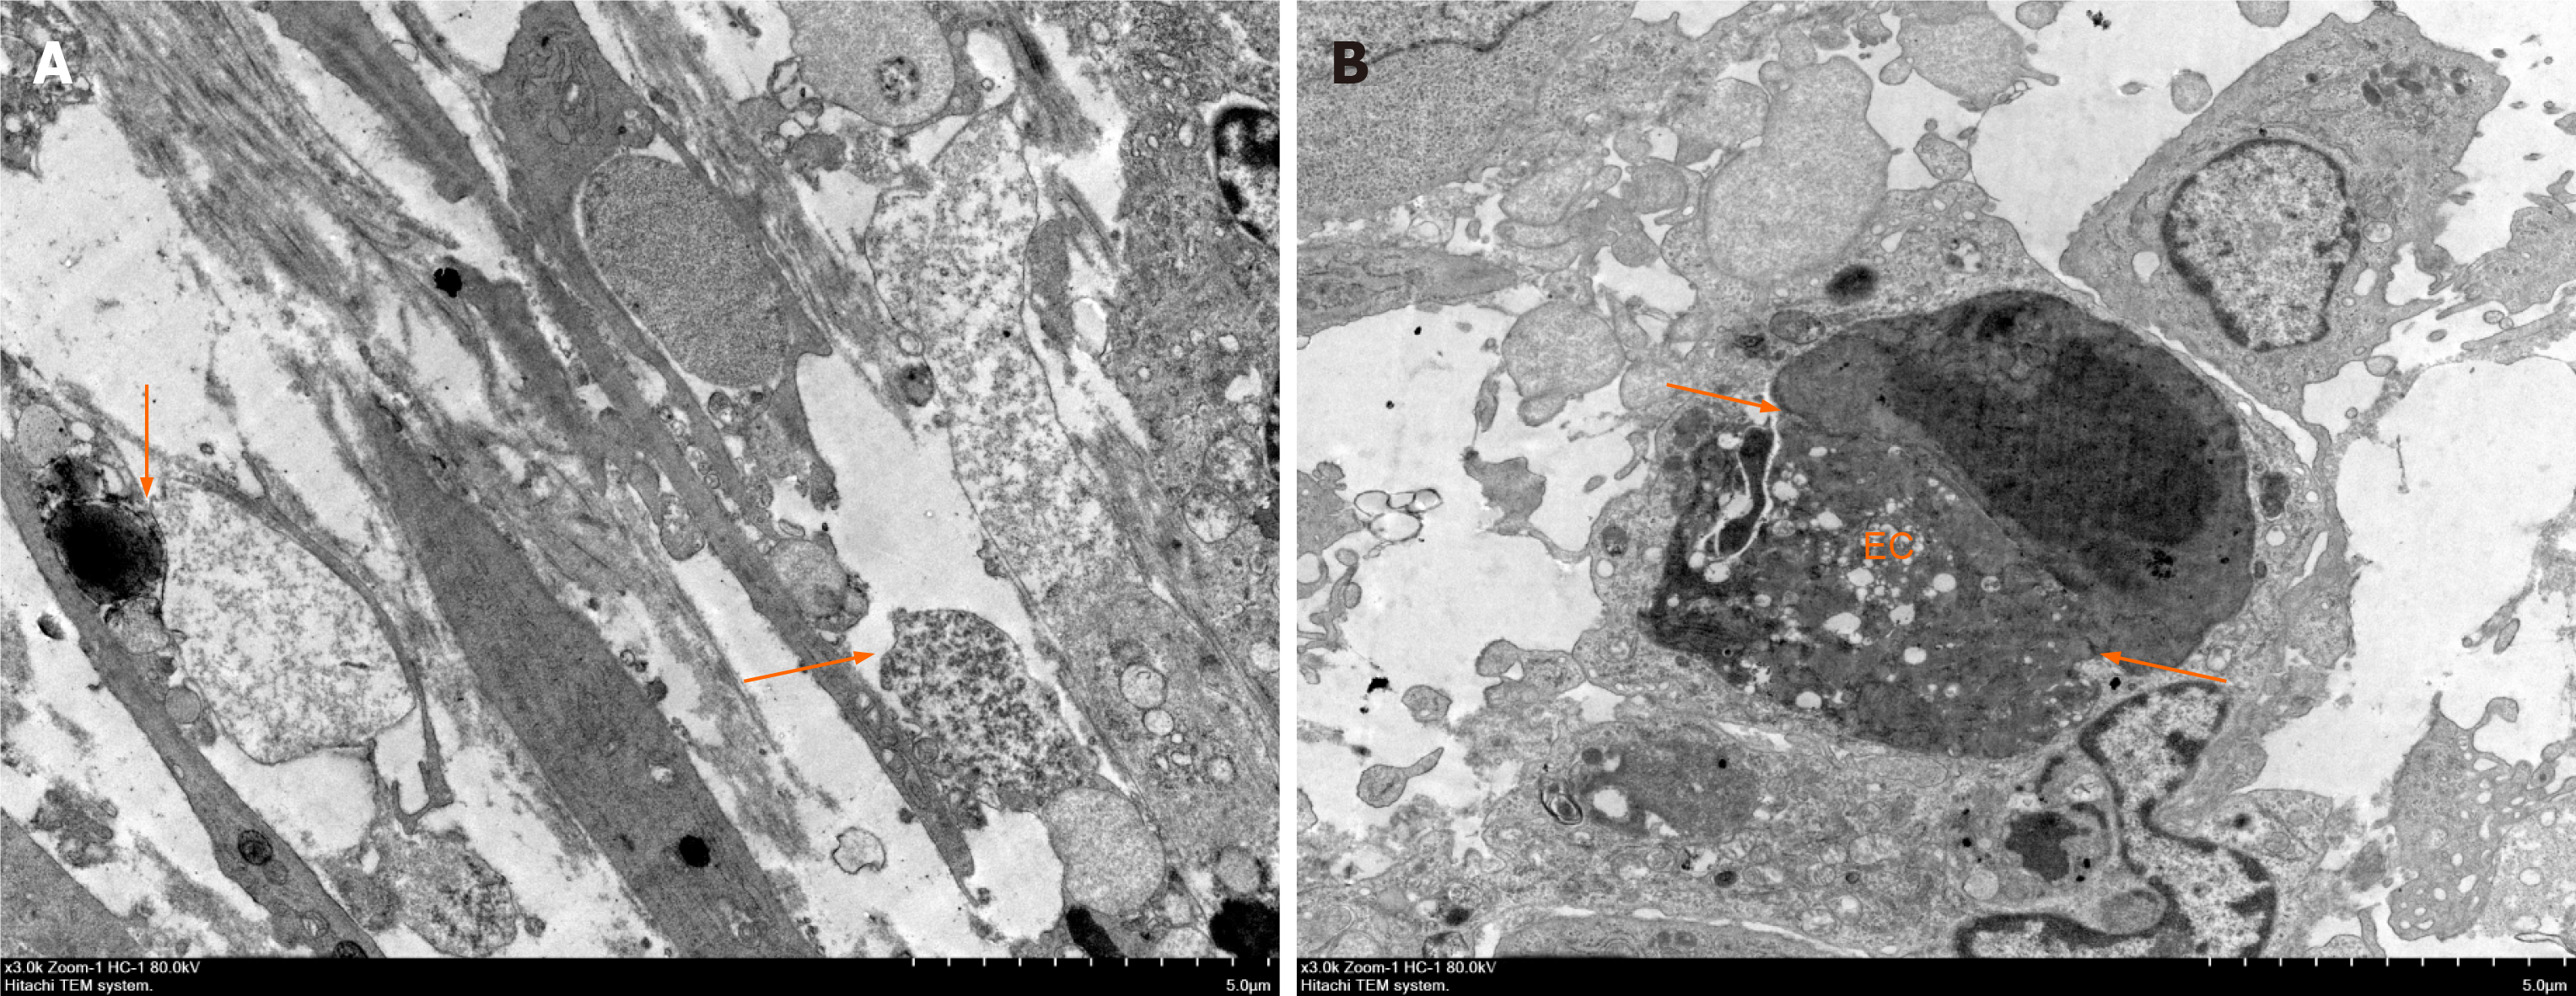
Figure 7 The effect of frankincense and myrrh on tumor vascular cell ultrastructure (10000×).
A: The model control group; B: High dose of frankincense + myrrh extracts group; EC: Endothelial cells; P: Pericytes; →: Connection between cells.
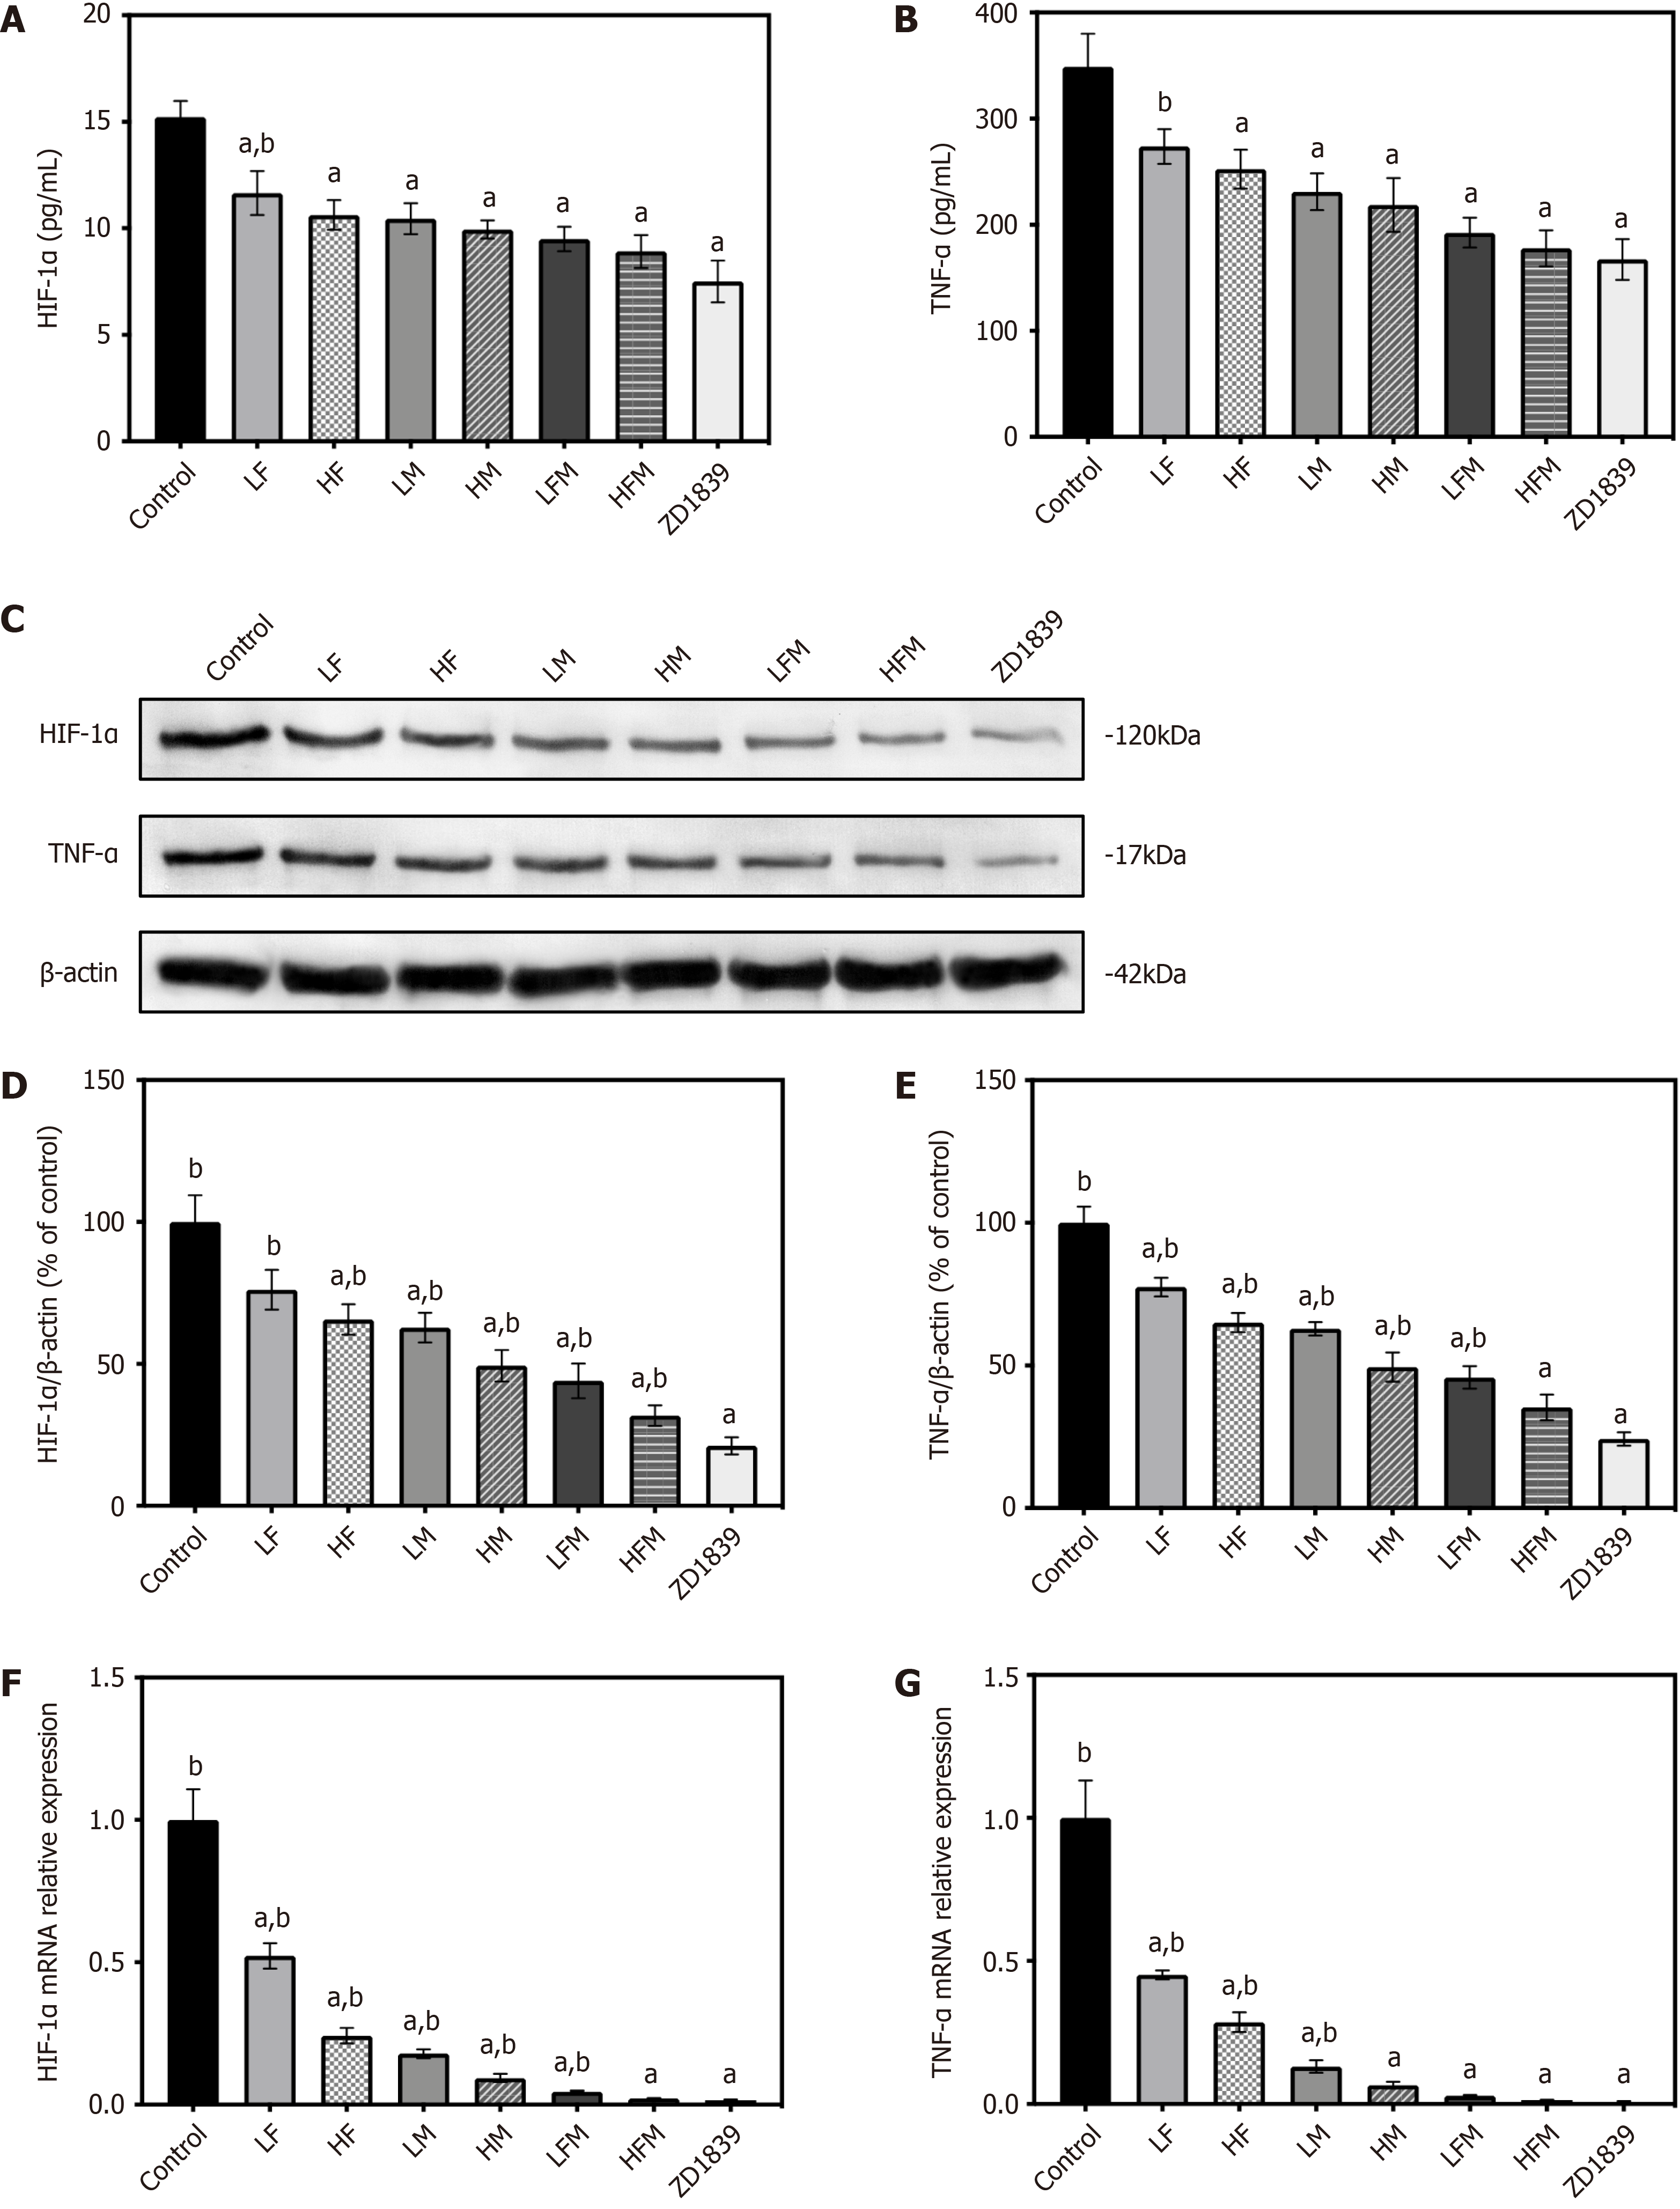
Figure 8 The effect of frankincense and/or myrrh on HIF-1α and TNF-α.
A and B: The secretion of HIF-1α and TNF-α in tumor body was detected by enzyme-linked immunosorbent assay; C-E: The protein levels of HIF-1α and TNF-α in tumor body, the protein expression indicated with Western blot, and β-actin was used as internal control; F and G: The mRNA levels of HIF-1α and TNF-α in tumor body, the mRNA expression was analyzed using reverse transcription-polymerase chain reaction, with GAPDH was reference gene. LF: Low dose of frankincense extract; HF: High dose of frankincense extract; LM: Low dose of myrrh extract; HM: High dose of myrrh extract; LFM: Low dose of frankincense + myrrh extracts; HFM: High dose of frankincense + myrrh extracts. Data represents the mean ± SE. aP < 0.05 vs the model control; bP < 0.05 vs ZD1839.
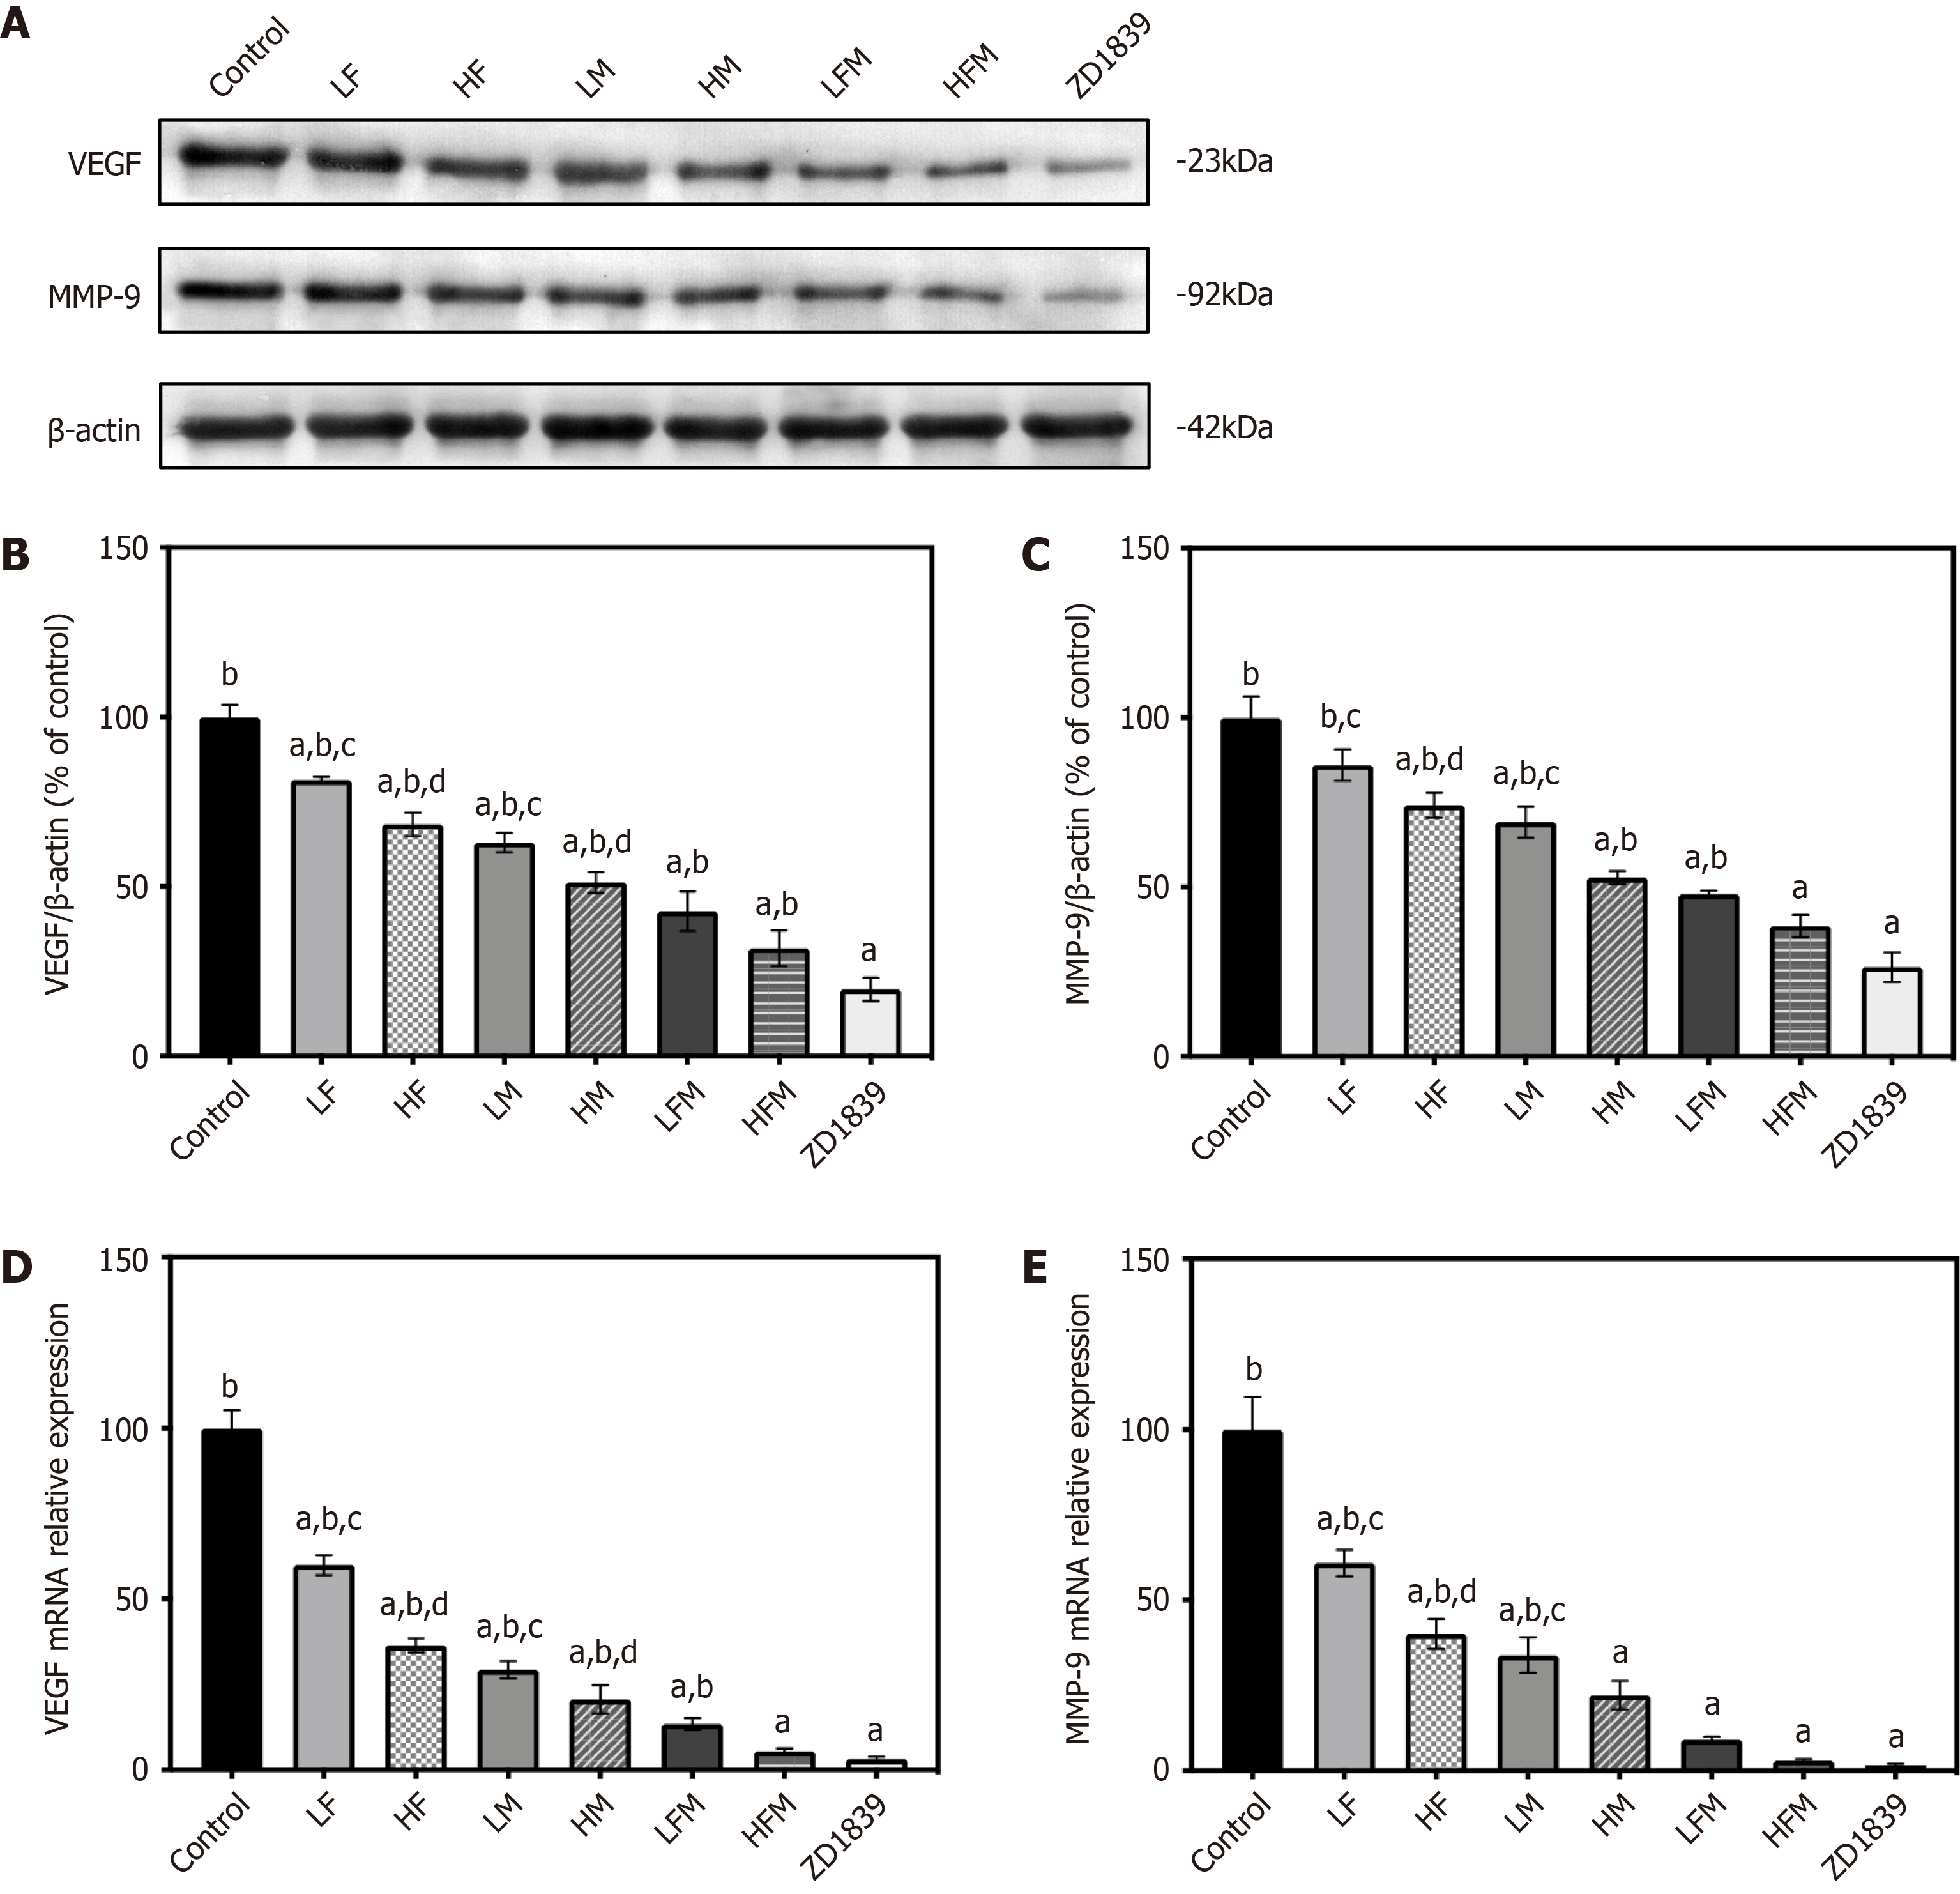
Figure 9 The effect of frankincense and/or myrrh on VEGF and MMP-9.
A-C: The protein levels of VEGF and MMP-9 in tumor body, the protein expression indicated with Western blot, and β-actin was used as internal control; D and E: The mRNA levels of VEGF and MMP-9 in tumor body, the mRNA expression was analyzed using reverse transcription-polymerase chain reaction, with GAPDH was reference gene. LF: Low dose of frankincense extract; HF: High dose of frankincense extract; LM: Low dose of myrrh extract; HM: High dose of myrrh extract; LFM: Low dose of frankincense + myrrh extracts; HFM: High dose of frankincense + myrrh extracts. Data represents the mean ± SE. aP < 0.05 vs the model control; bP < 0.05 vs ZD1839; cP < 0.05 vs low dose of frankincense + myrrh extracts; dP < 0.05 vs high dose of frankincense + myrrh extracts.
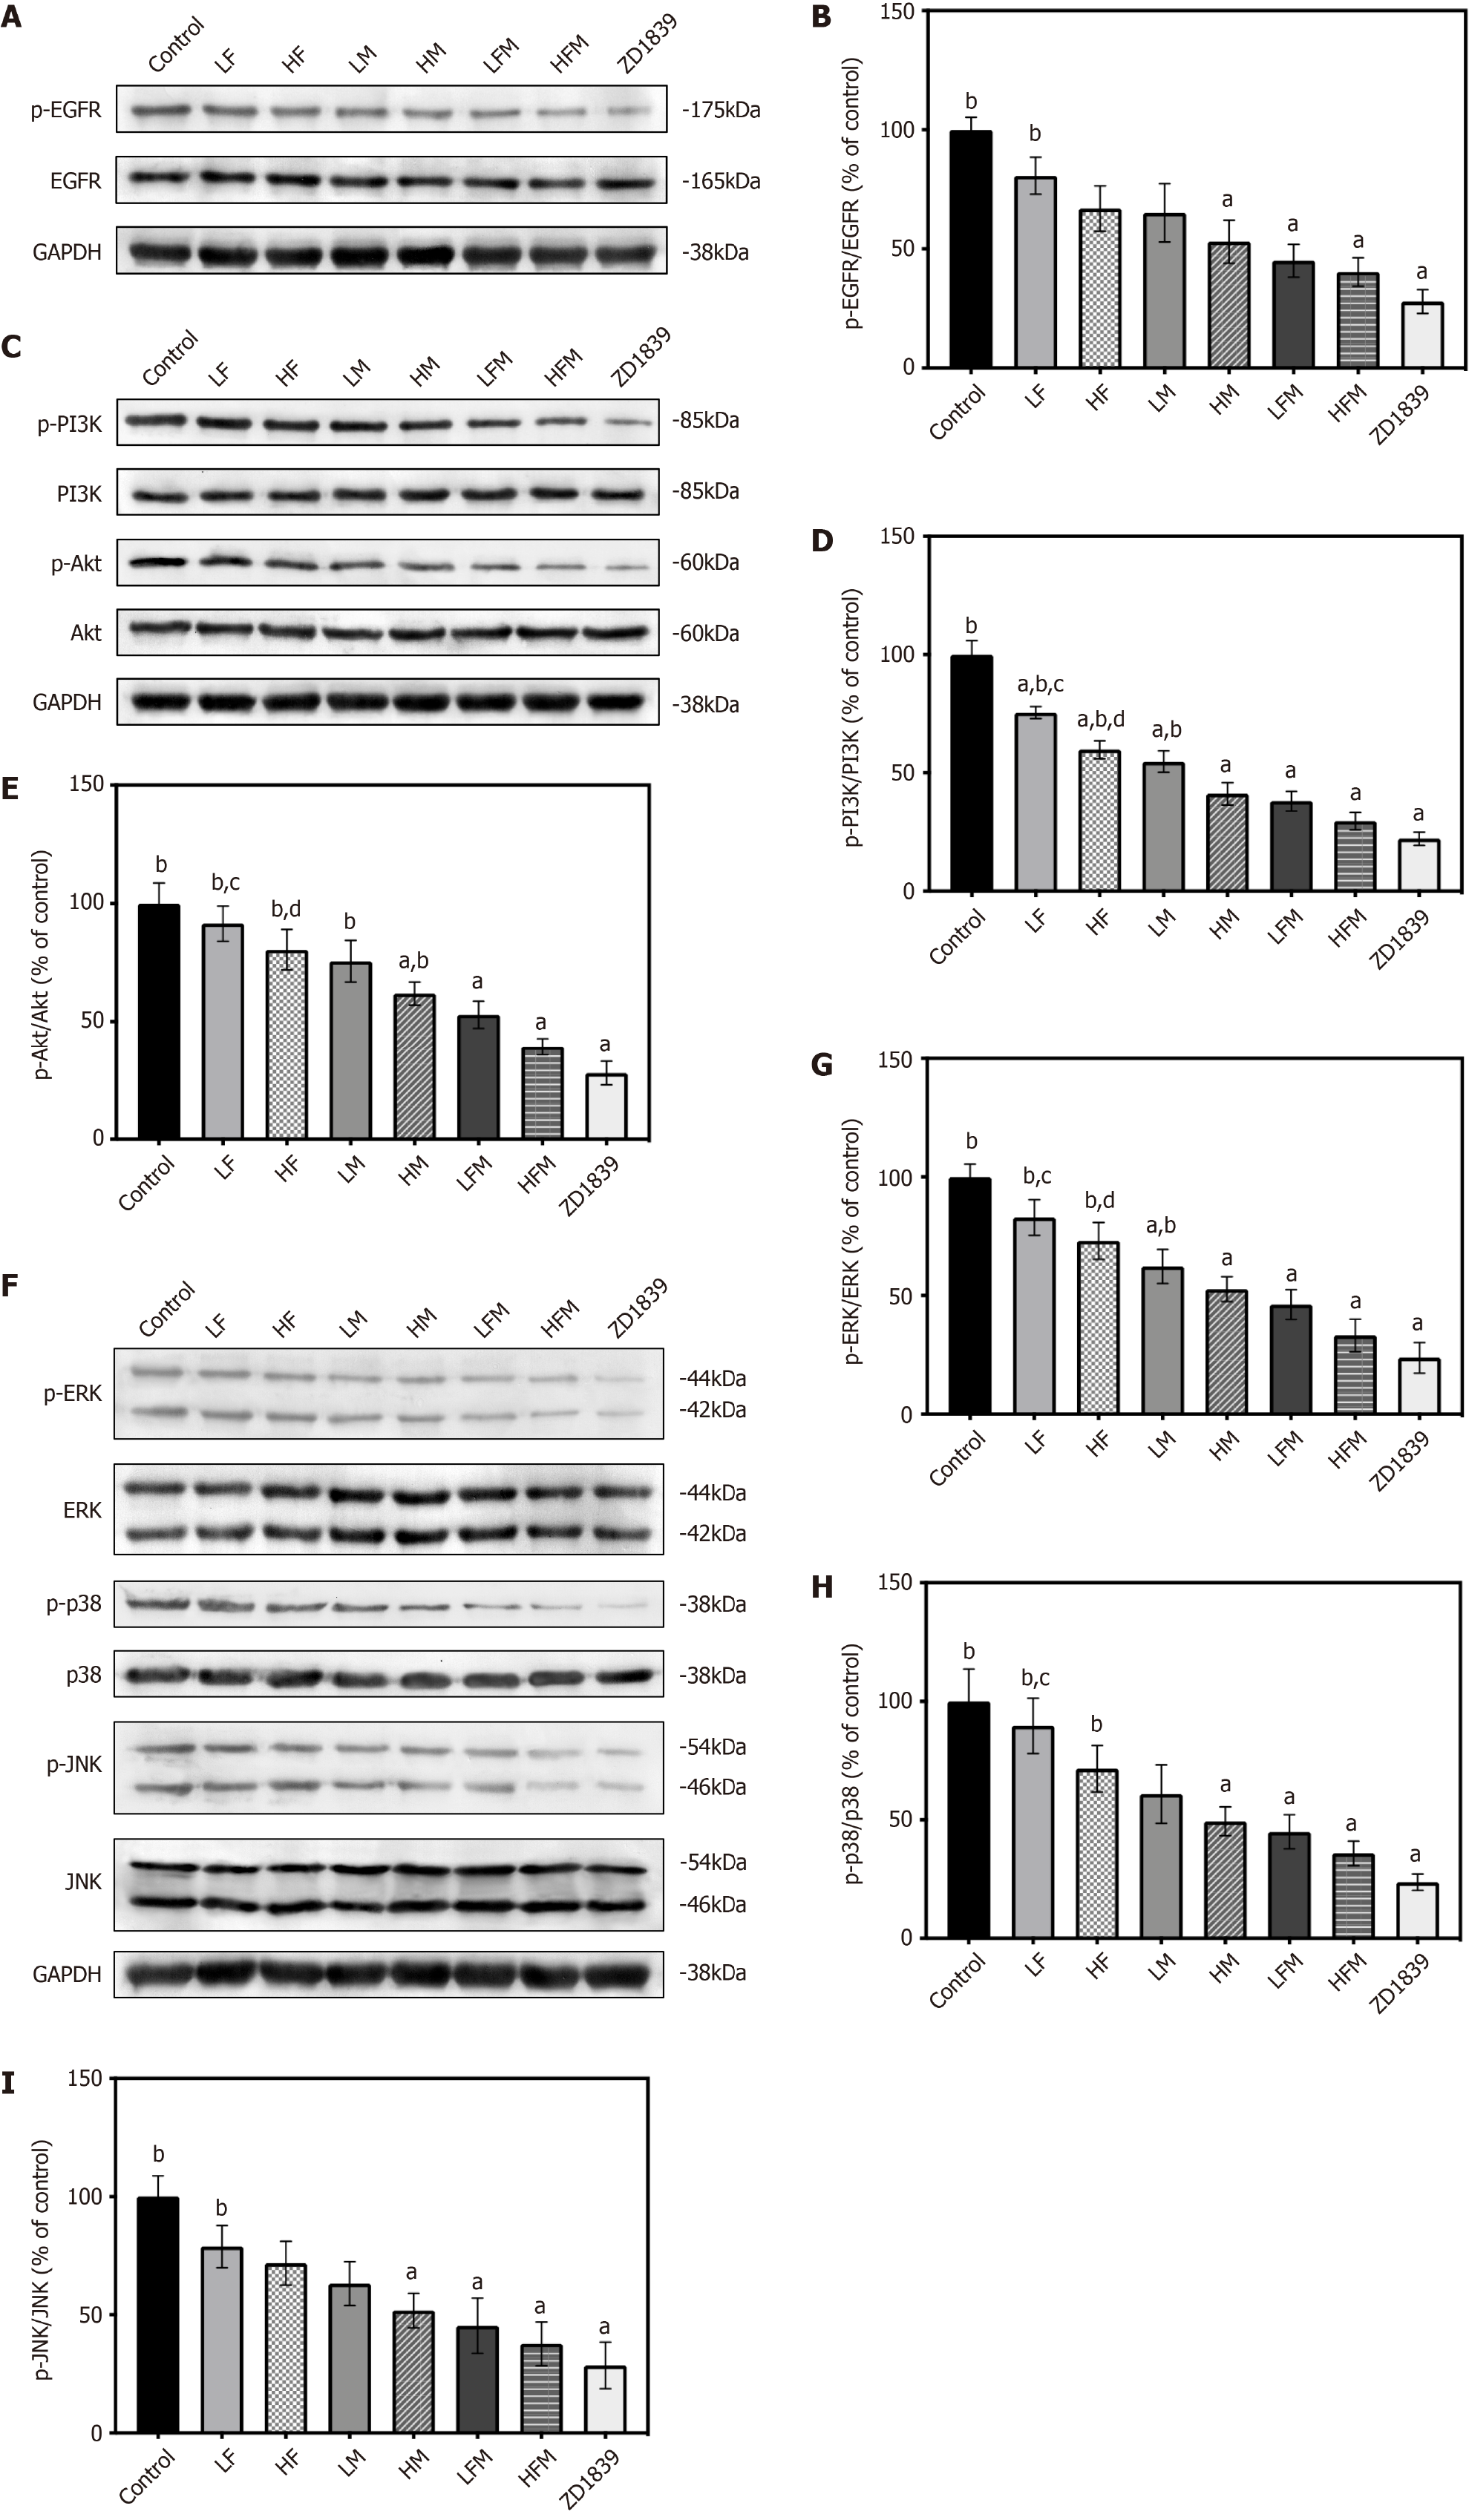
Figure 10 The effect of frankincense and/or myrrh on EGFR, PI3K/Akt and MAPK (ERK, p38, JNK) pathway components.
A and B: The protein levels of EGFR, p-EGFR in tumor body; C-E: The protein levels of PI3K, p-PI3K, Akt, p-Akt in tumor body; F-I: The protein levels of EKR, p-ERK, p38, p-p38, JNK, p-JNK. The protein expression indicated with Western blot, and GAPDH was used as internal control. Data represents the mean ± SE. LF: Low dose of frankincense extract; HF: High dose of frankincense extract; LM: Low dose of myrrh extract; HM: High dose of myrrh extract; LFM: Low dose of frankincense + myrrh extracts; HFM: High dose of frankincense + myrrh extracts. Data represents the mean ± SE. aP < 0.05 vs the model control; bP < 0.05 vs ZD1839; cP < 0.05 vs low dose of frankincense + myrrh extracts; dP < 0.05 vs high dose of frankincense + myrrh extracts.
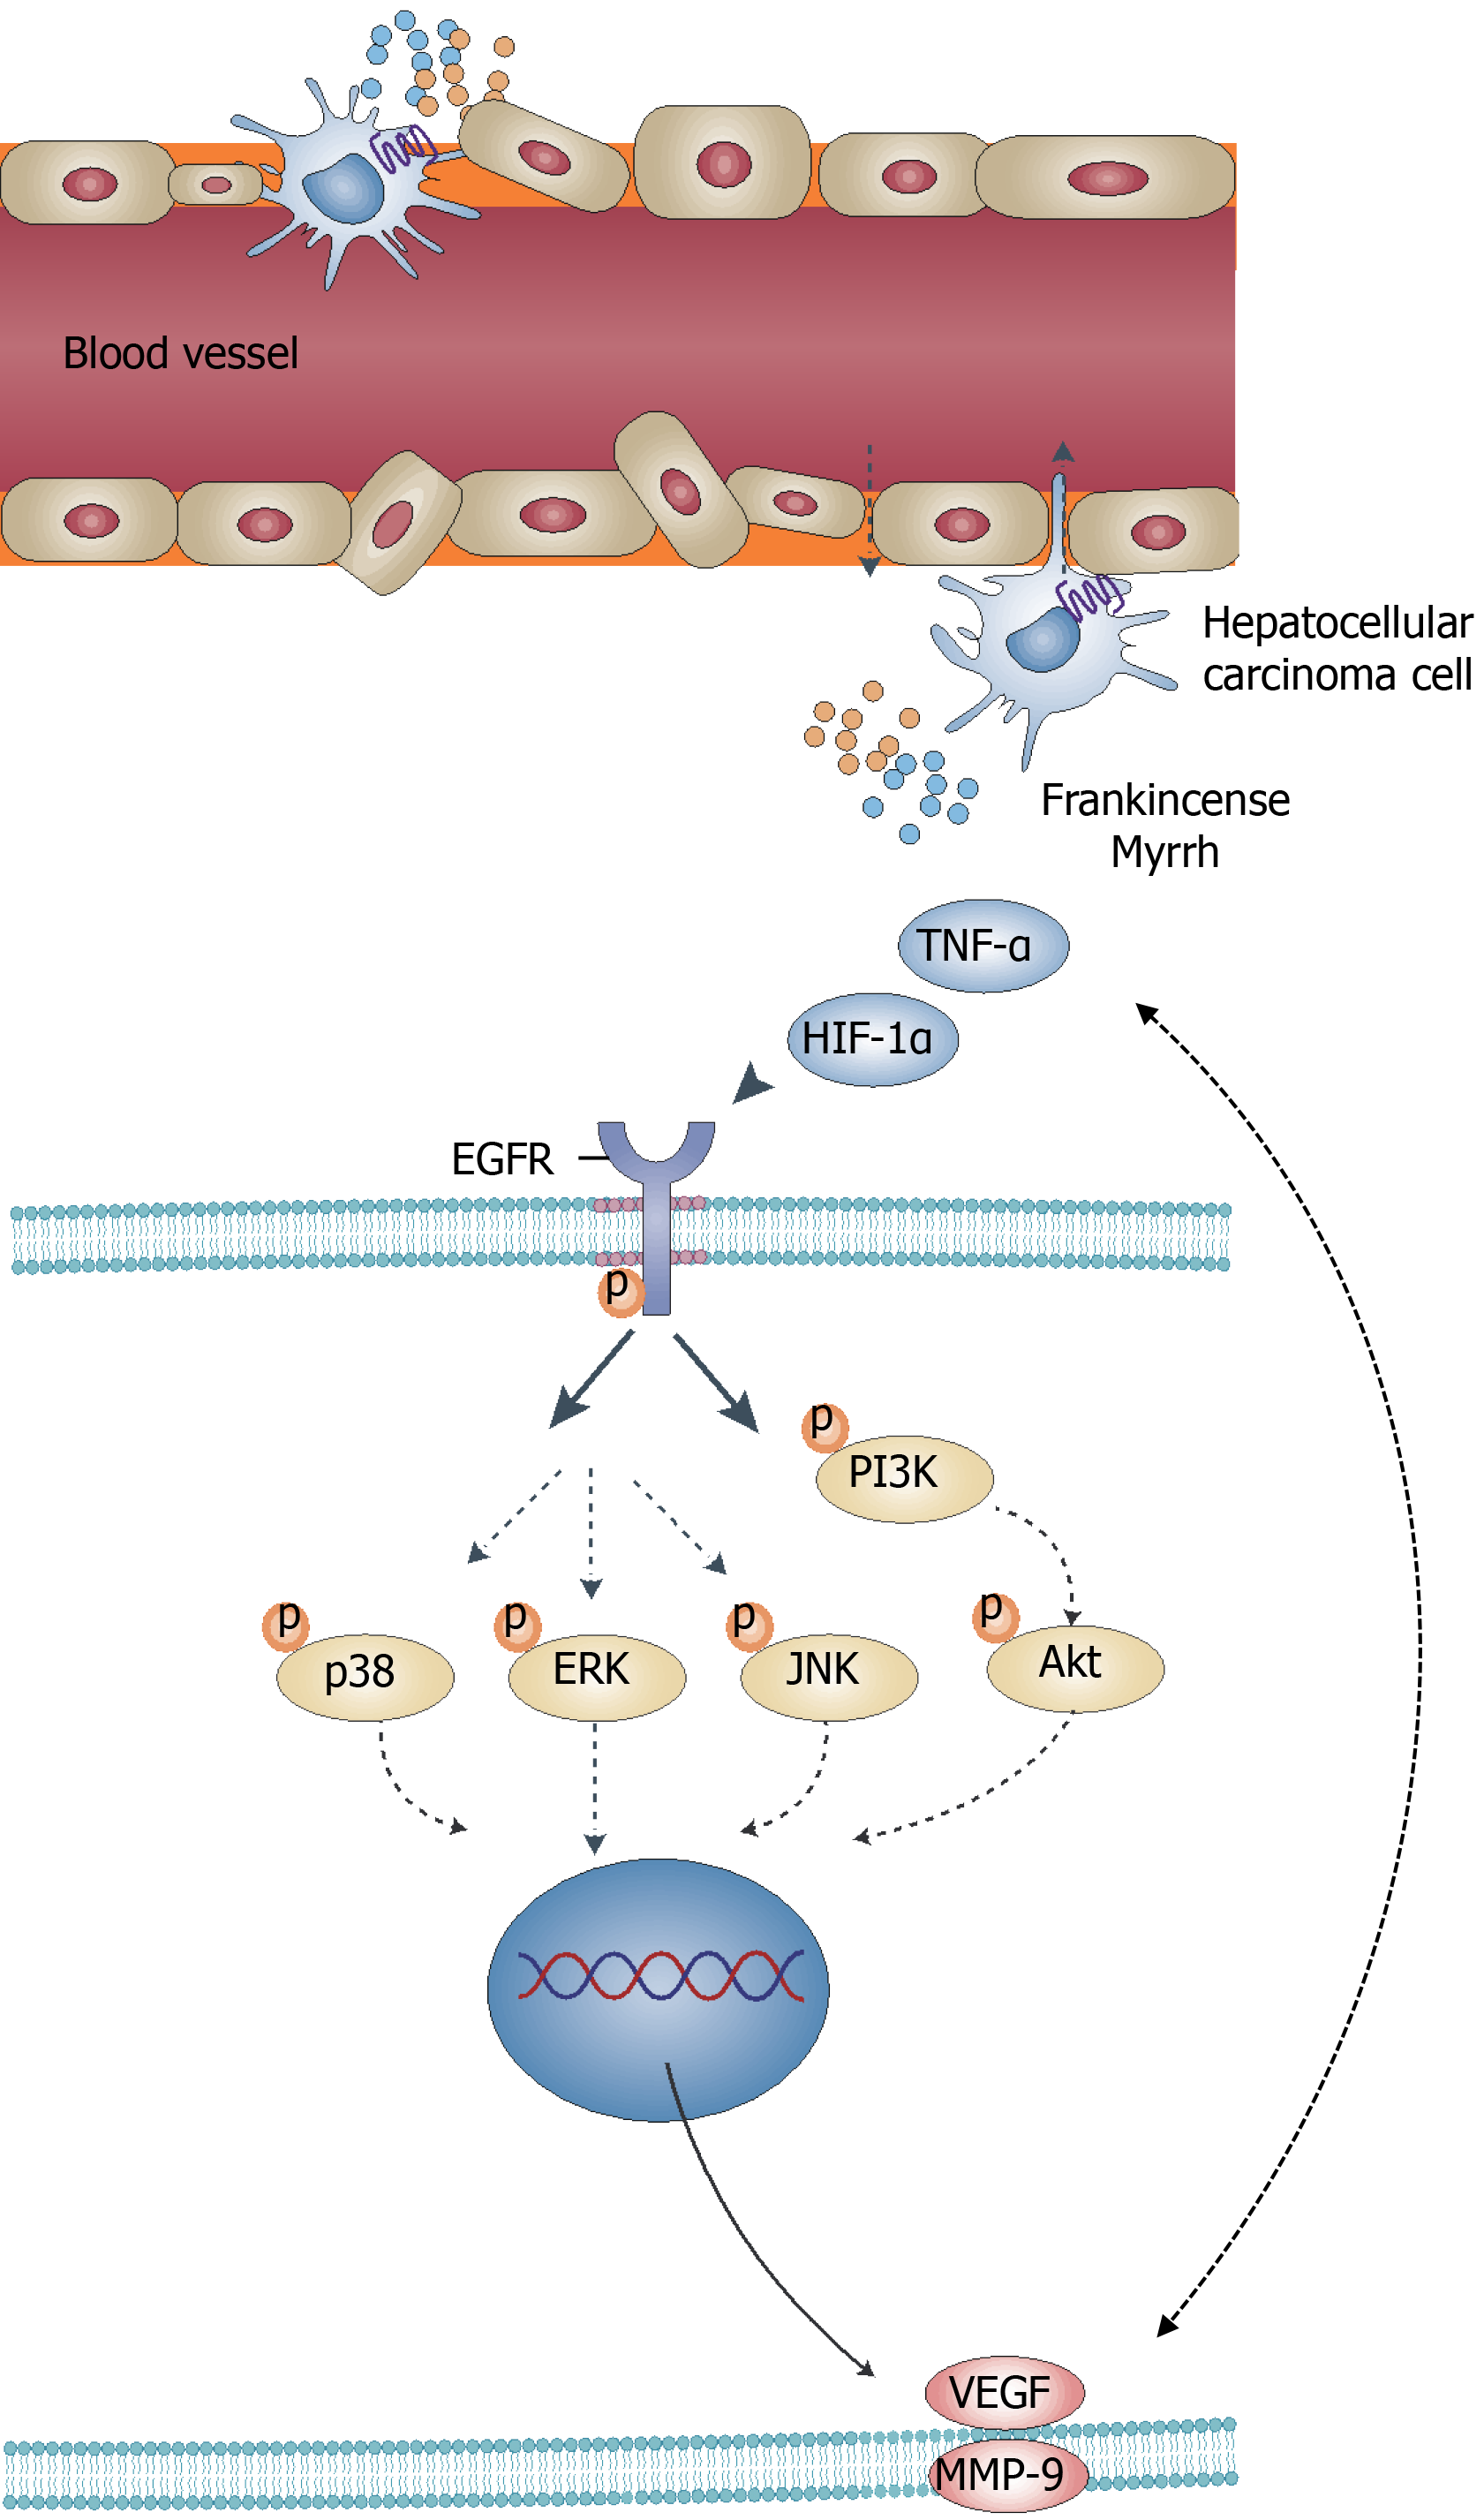
Figure 11 Schematic of frankincense and myrrh as potential anti hepatocellular carcinoma therapeutic agents.
- Citation: Zheng P, Huang Z, Tong DC, Zhou Q, Tian S, Chen BW, Ning DM, Guo YM, Zhu WH, Long Y, Xiao W, Deng Z, Lei YC, Tian XF. Frankincense myrrh attenuates hepatocellular carcinoma by regulating tumor blood vessel development through multiple epidermal growth factor receptor-mediated signaling pathways. World J Gastrointest Oncol 2022; 14(2): 450-477
- URL: https://www.wjgnet.com/1948-5204/full/v14/i2/450.htm
- DOI: https://dx.doi.org/10.4251/wjgo.v14.i2.450


