Copyright
©The Author(s) 2022.
World J Gastrointest Oncol. Oct 15, 2022; 14(10): 1981-2003
Published online Oct 15, 2022. doi: 10.4251/wjgo.v14.i10.1981
Published online Oct 15, 2022. doi: 10.4251/wjgo.v14.i10.1981
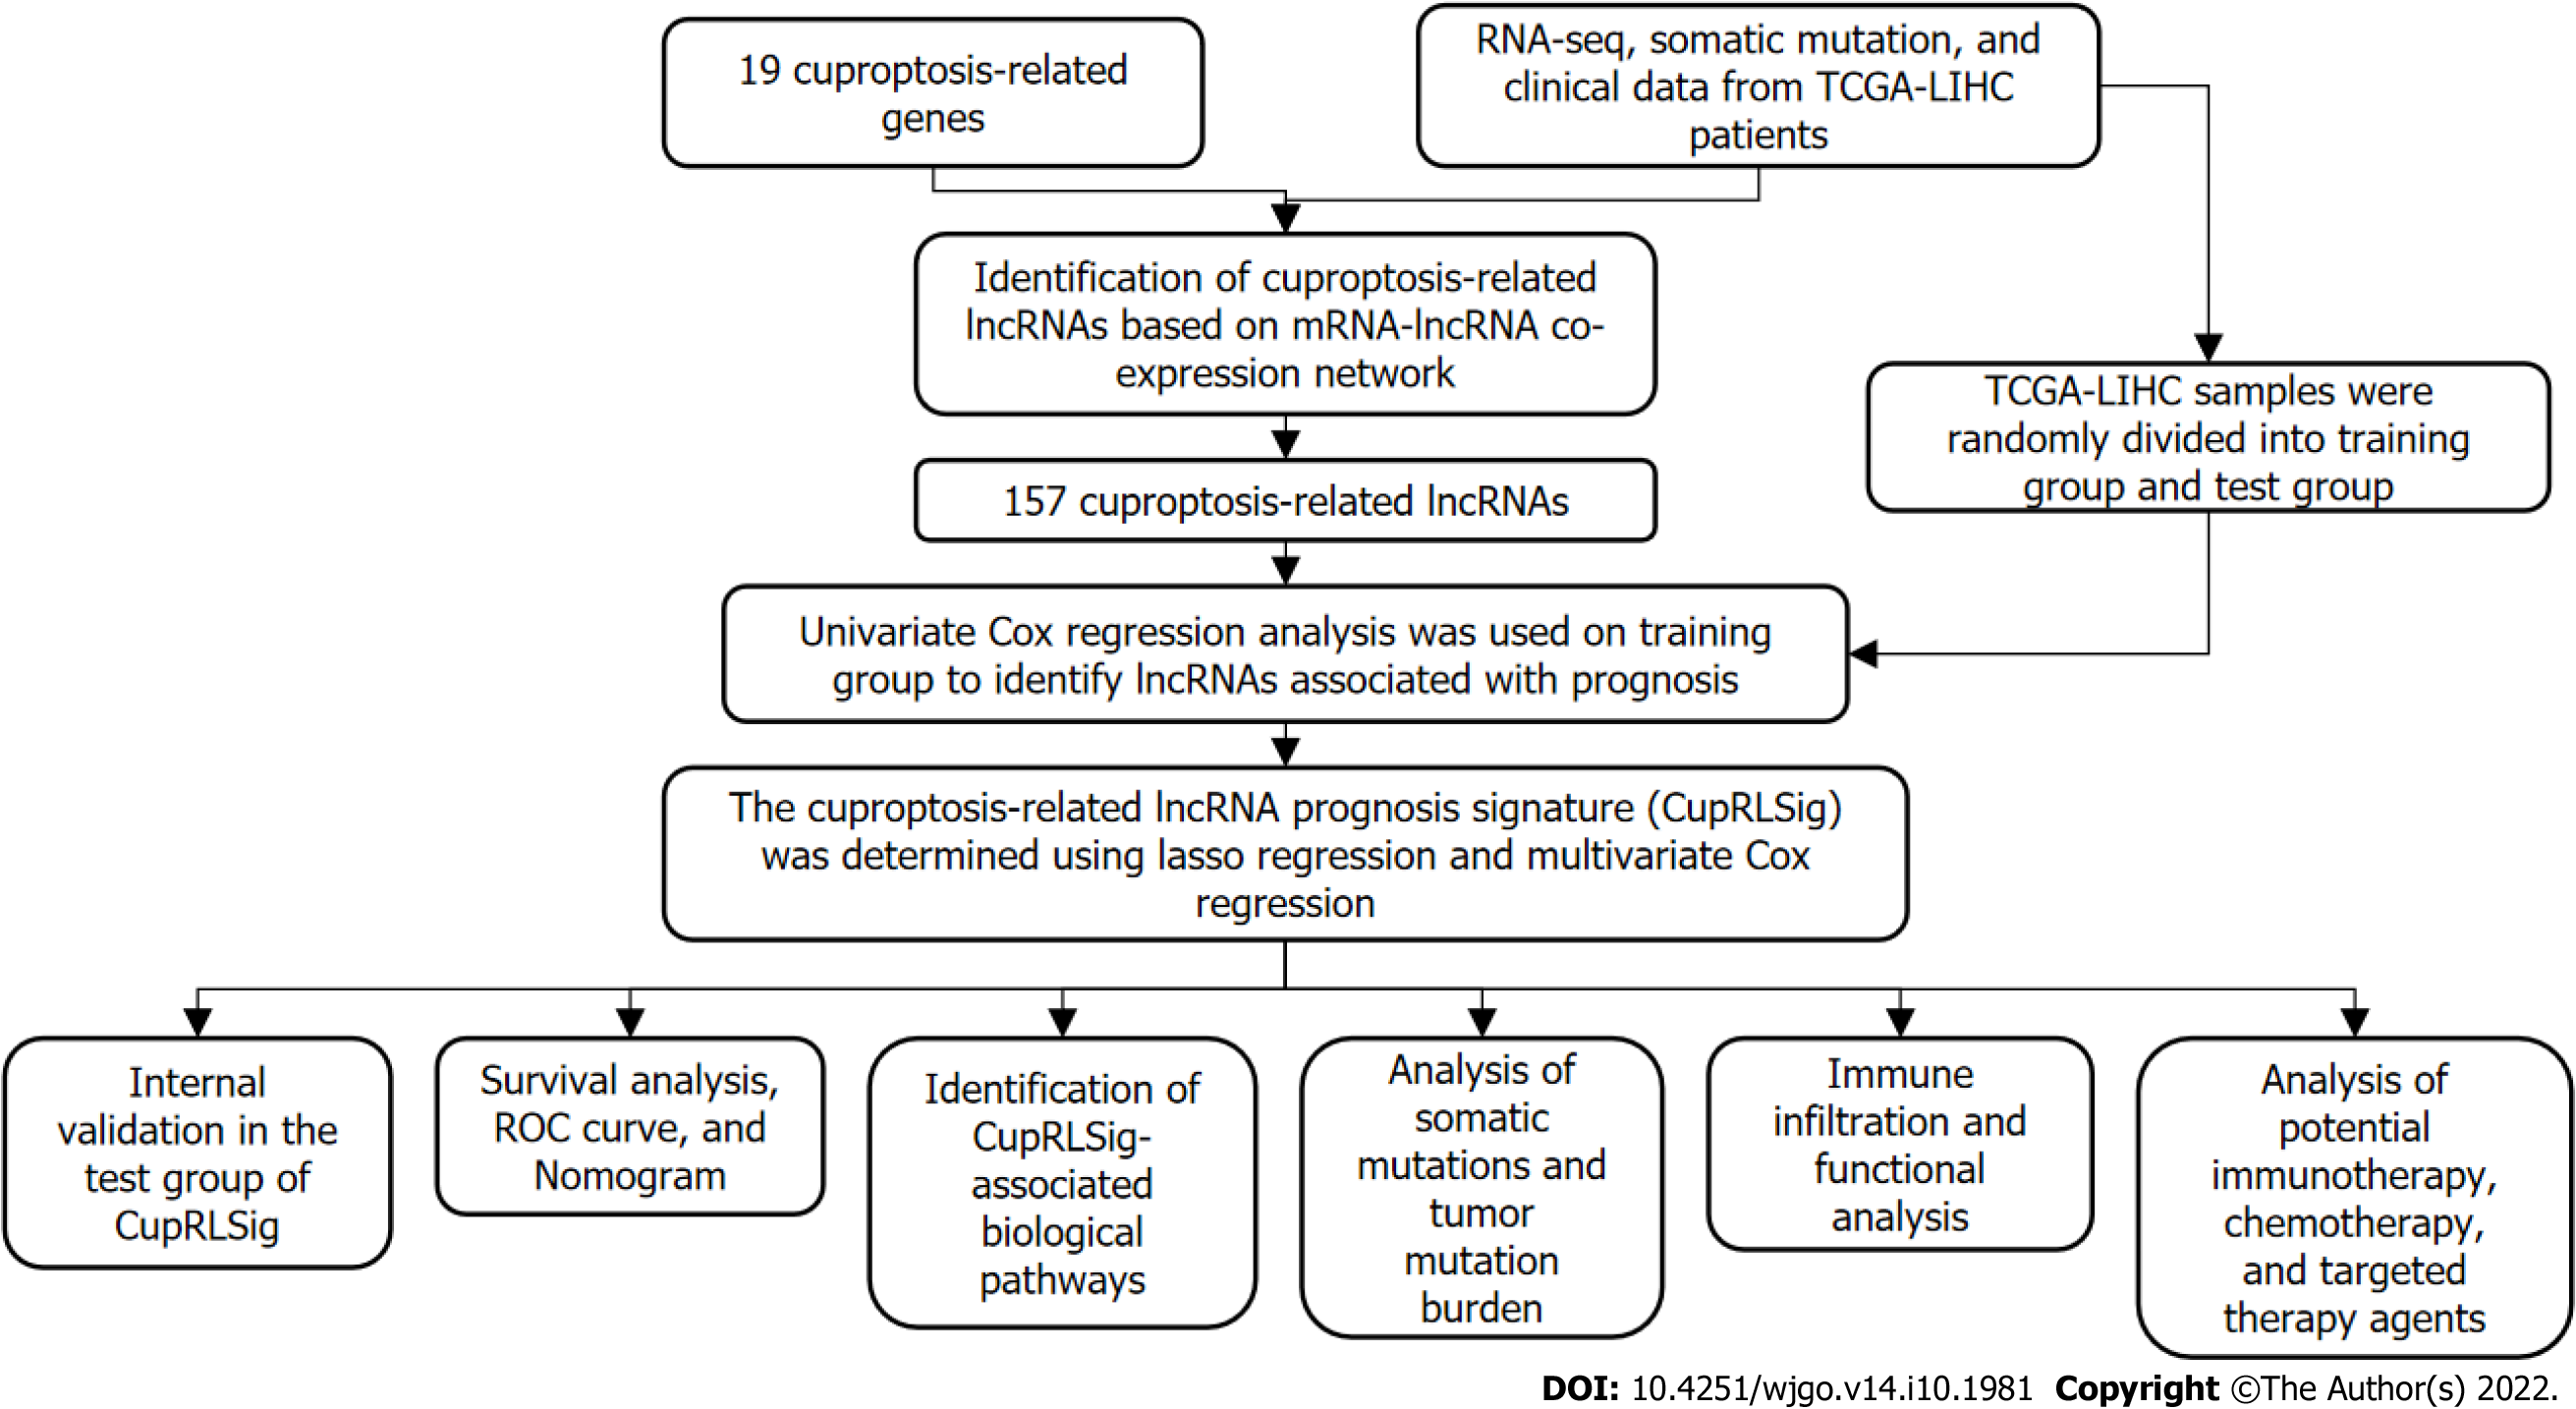
Figure 1 Study flowchart.
RNA-seq: RNA sequencing; TCGA-LIHC: The Cancer Genome Atlas-Live Hepatocellular Carcinoma; lncRNAs: Long non-coding RNAs; ROC: Receiver operating characteristic.
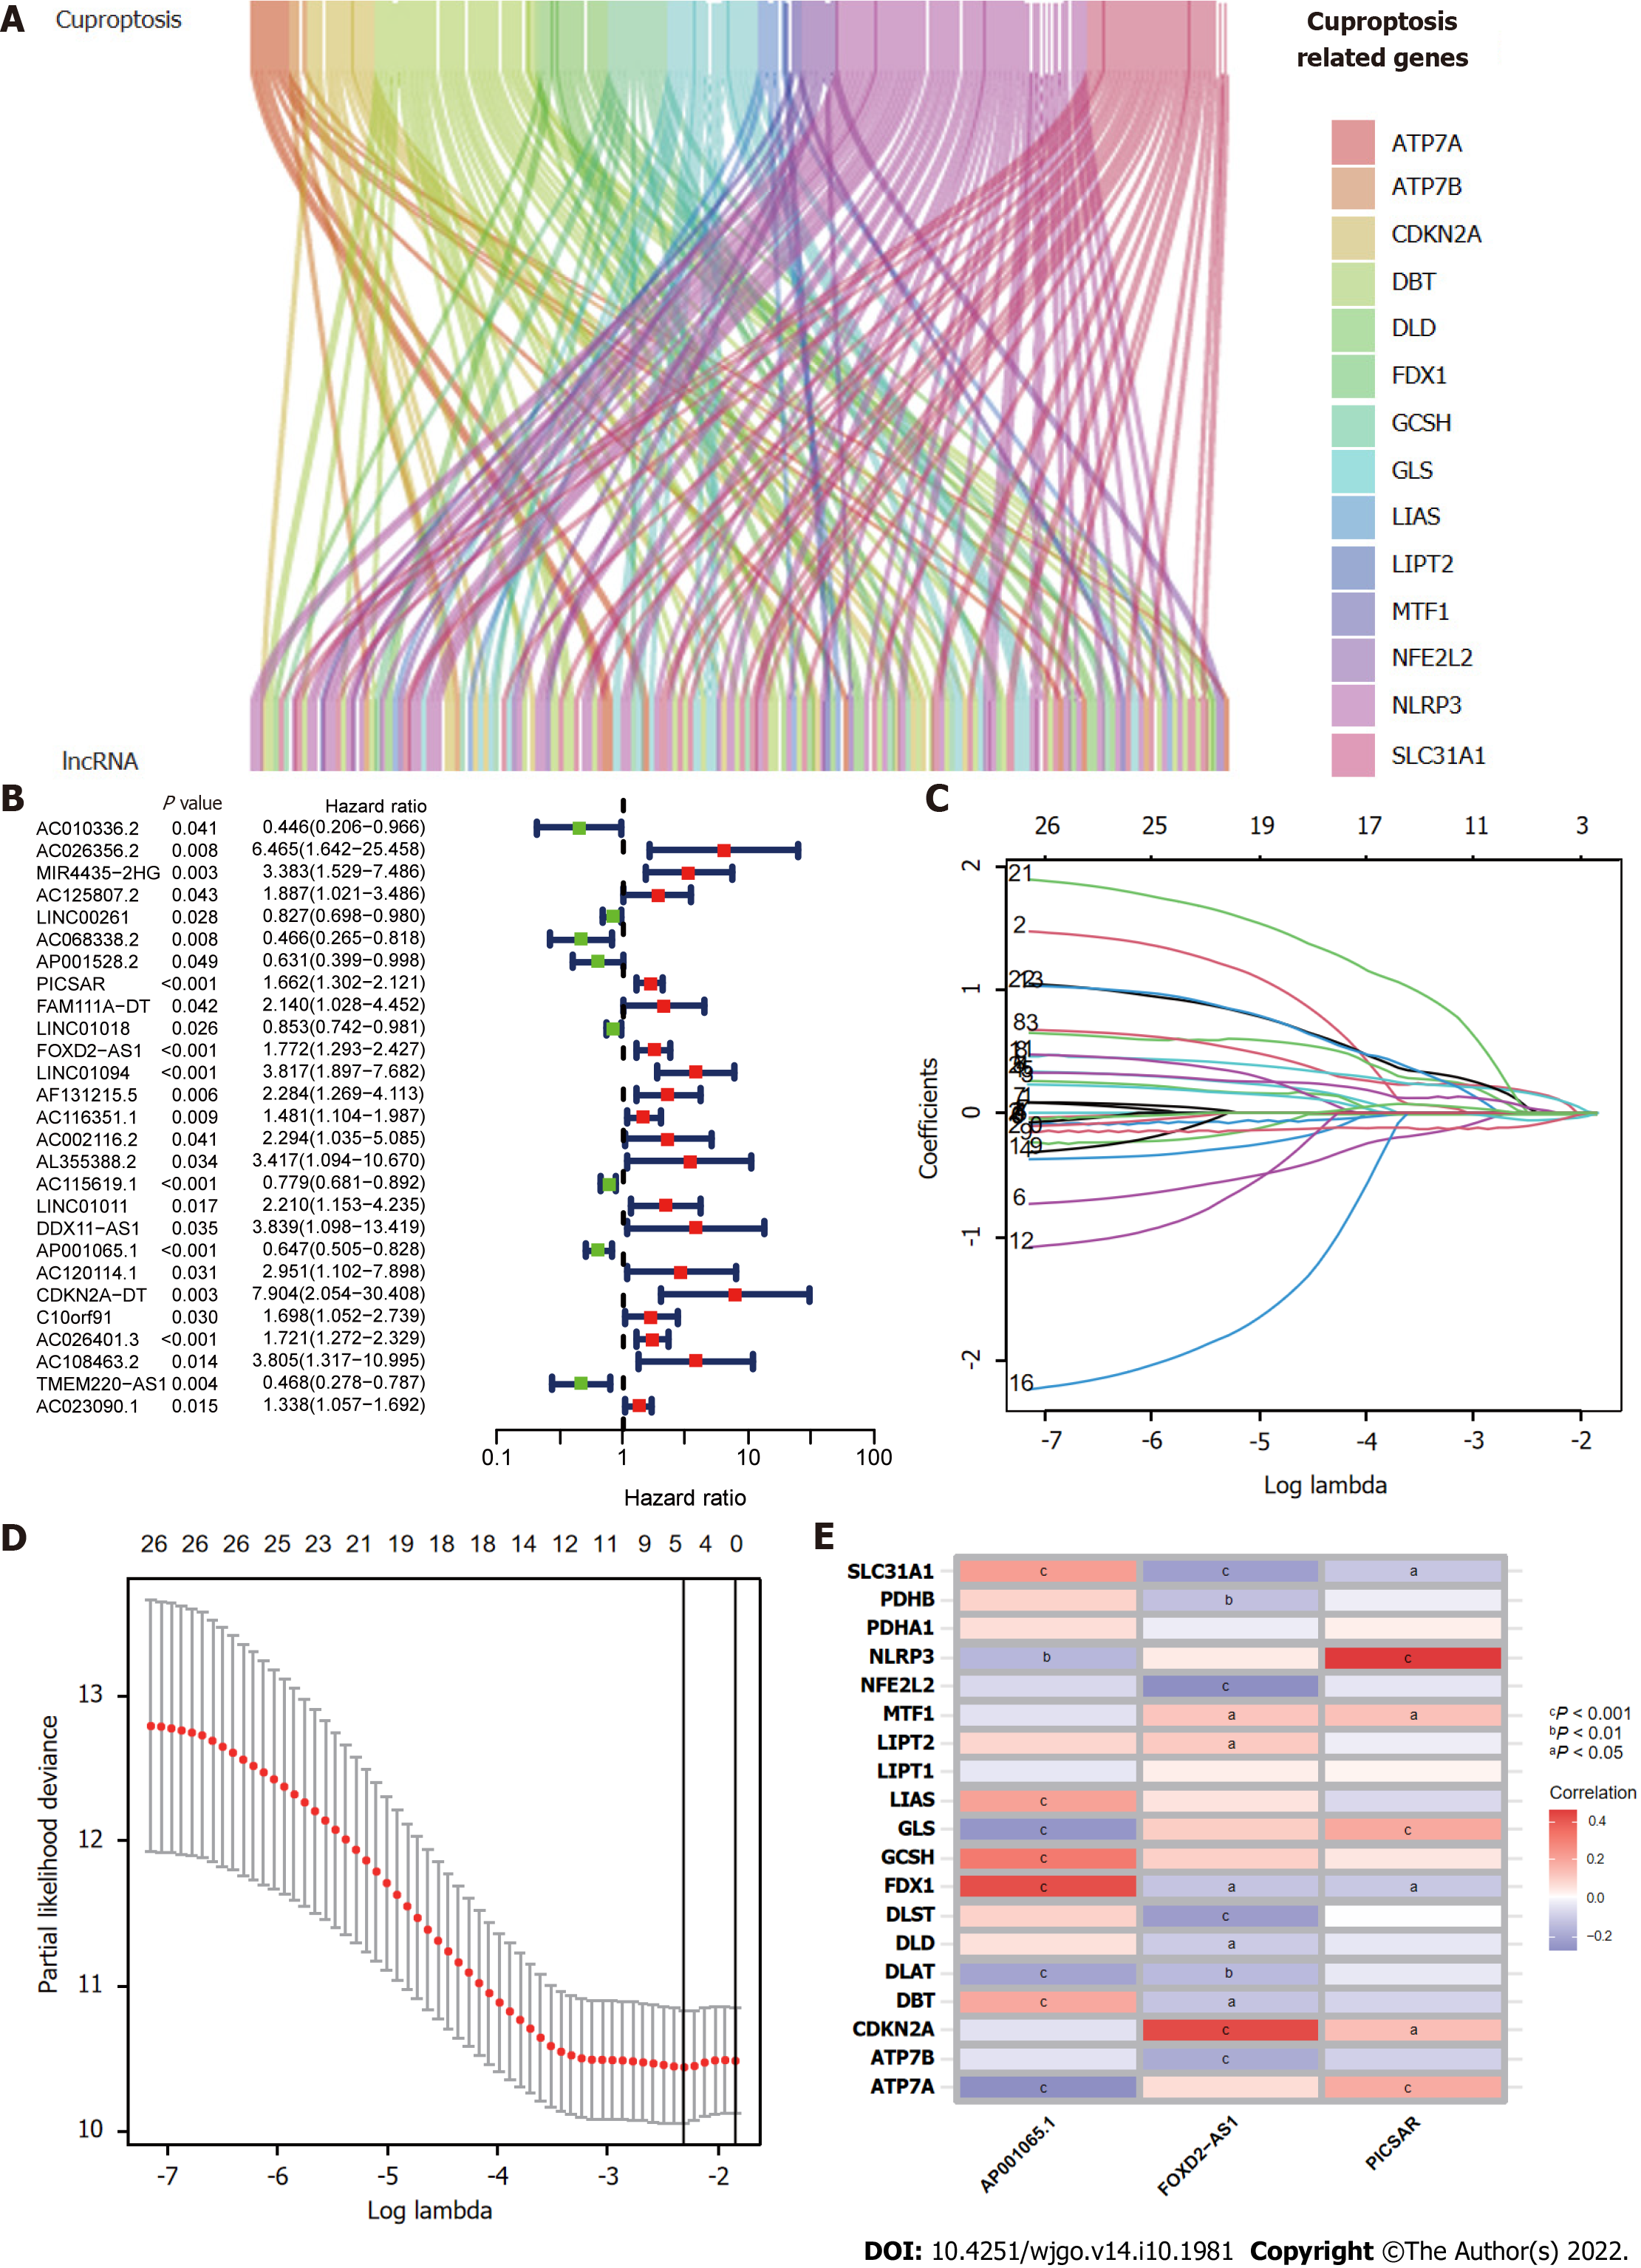
Figure 2 Construction of the cuproptosis-related long-chain non-coding RNA signature (CupRLSig) model.
A: Sankey diagram showing the associations between cuproptosis-related long-chain non-coding RNAs (lncRNAs) and mRNAs; B: Forest plot showing 27 LncRNAs with hazard ratios (95% confidence intervals) and P values for association with HCC prognosis based on univariate Cox proportional-hazards analysis; C: Lasso coefficient profiles; D: Selection of the tuning parameter (lambda) in the Lasso model by ten-fold cross-validation based on minimum criteria for overall survival; E: Heatmap showing the correlations of the three lncRNAs incorporated into the cuproptosis-related long-chain non-coding RNA signature model (CupRLSig) model and 19 cuproptosis-related genes. aP < 0.05; bP < 0.01; cP < 0.001.
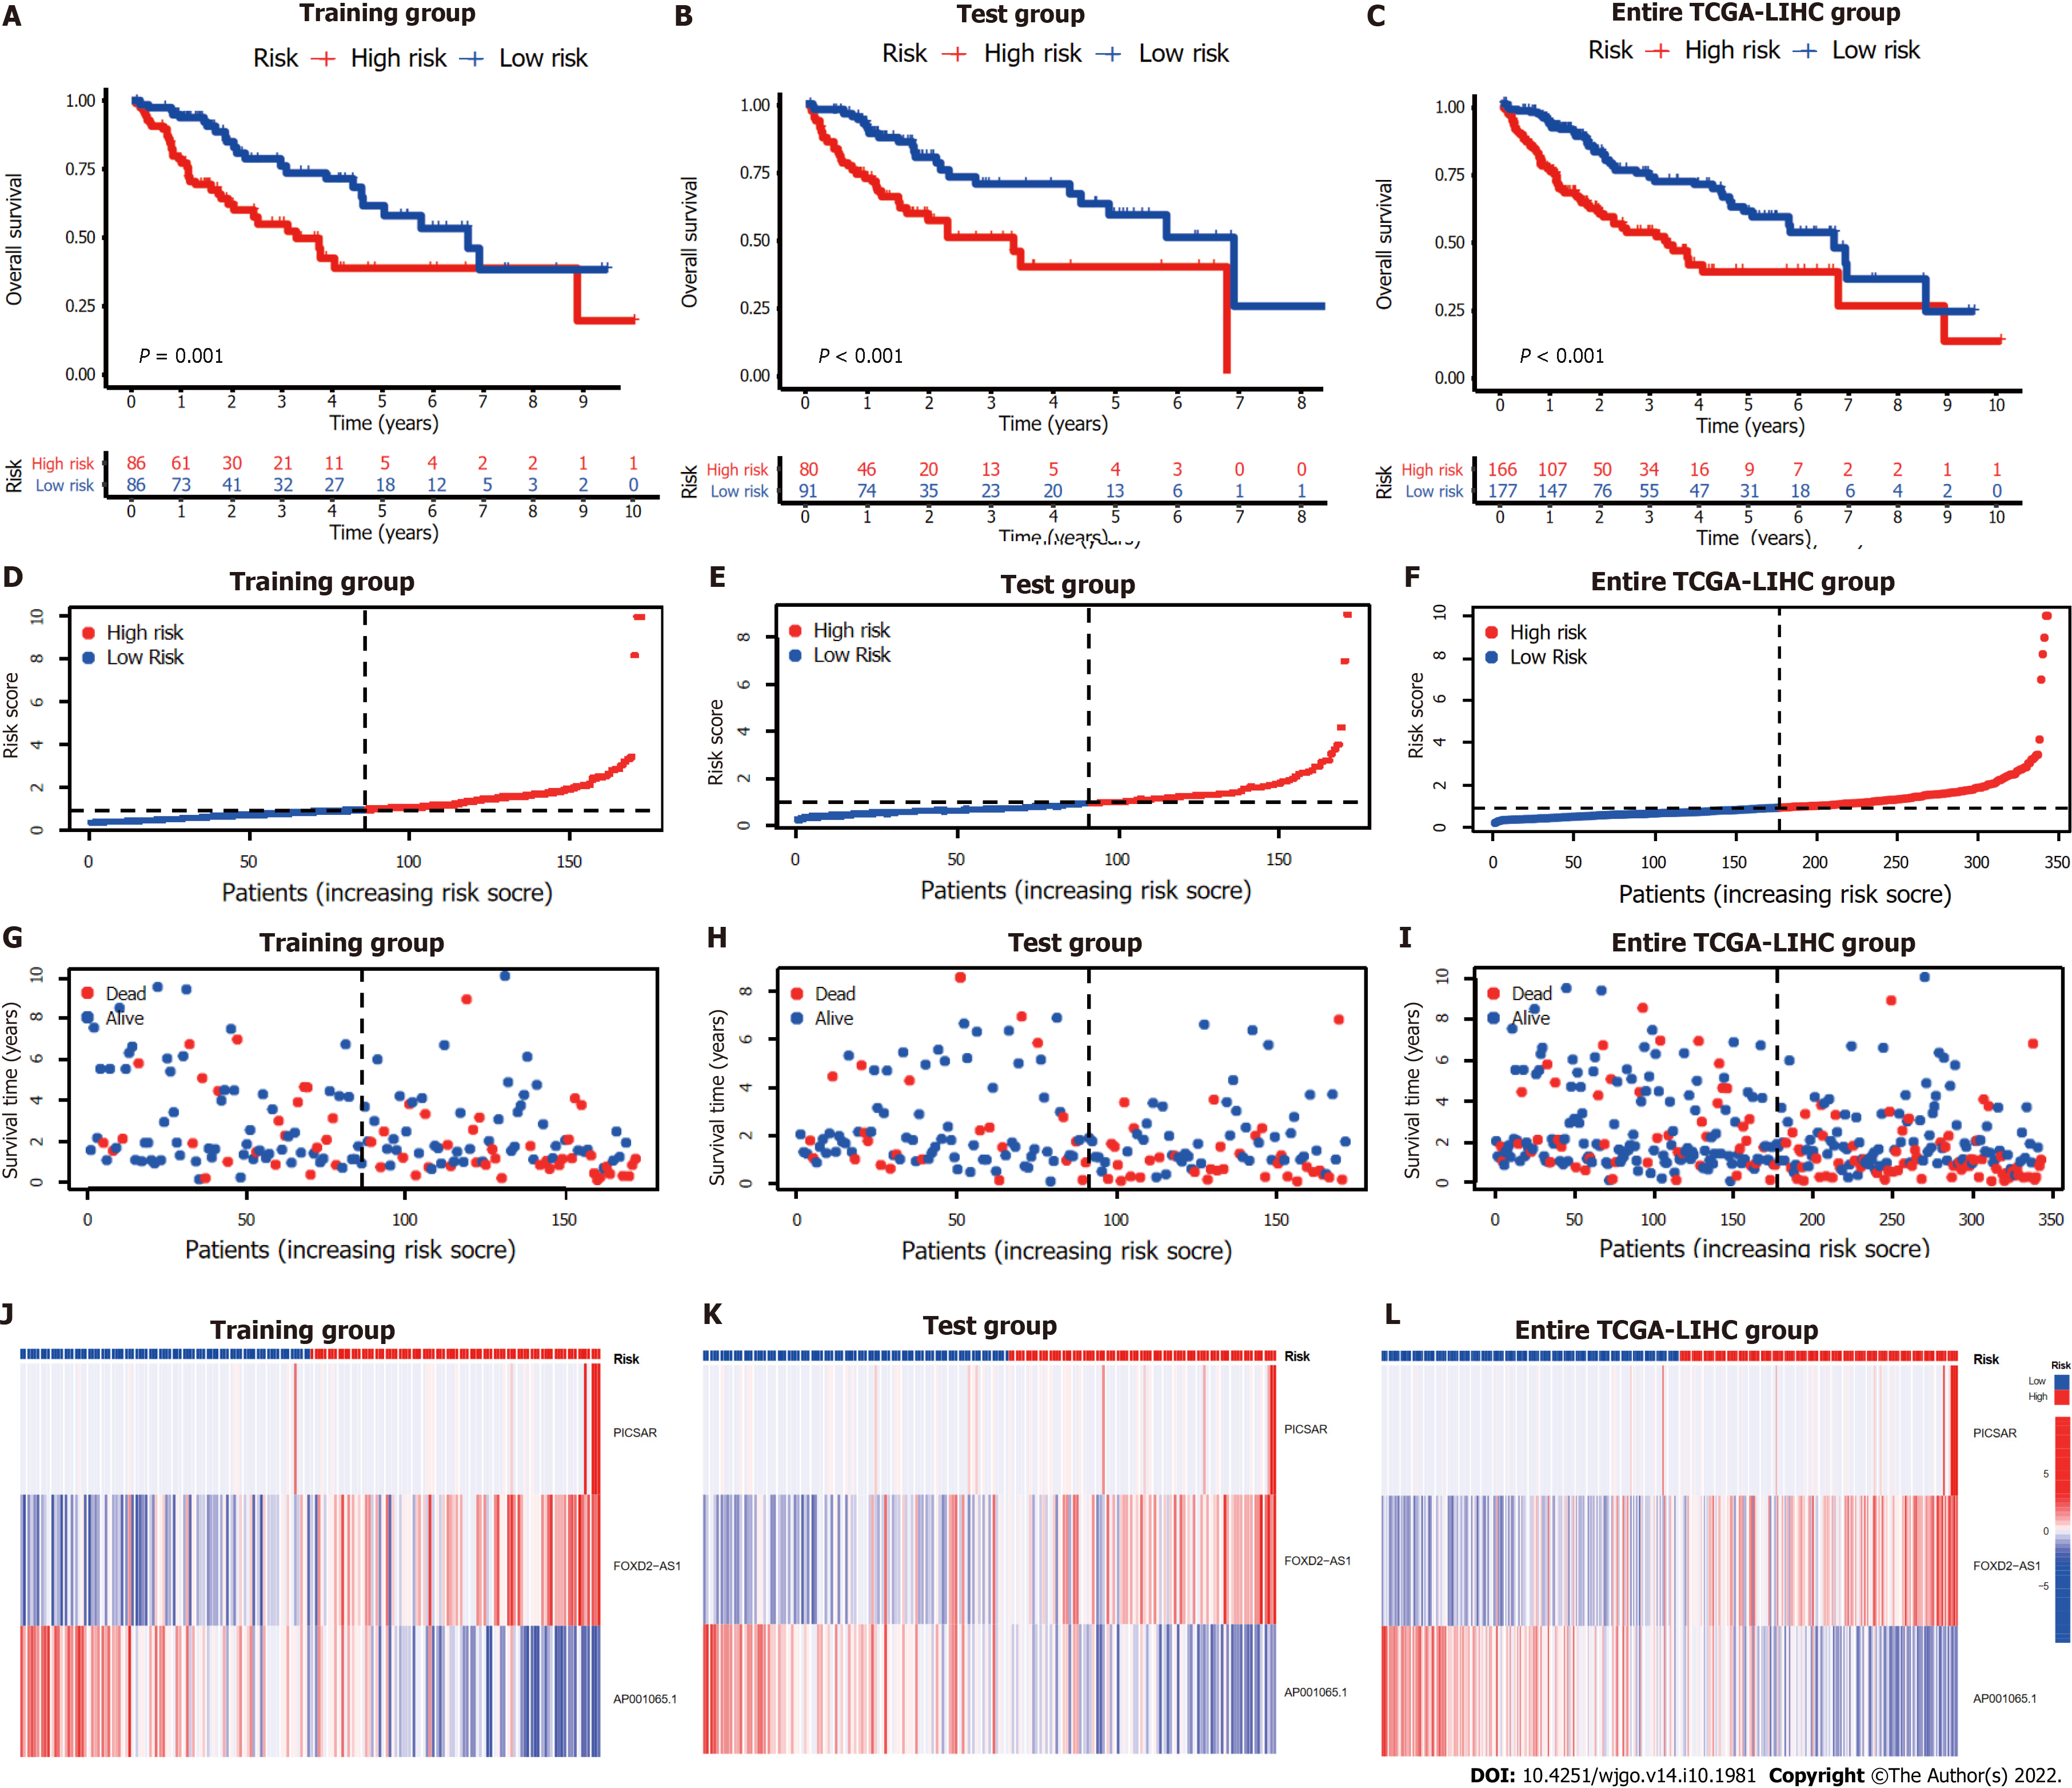
Figure 3 Internal validation of cuproptosis-related long-chain non-coding RNA signature (CupRLSig) model for determination of overall survival in training, test, and entire The Cancer Genome Atlas-Live Hepatocellular Carcinoma groups.
A-C: Kaplan-Meier survival curves in the high- and low-risk groups stratified by median CupRLSig risk scores for overall survival in the training set (A), test set (B), and entire The Cancer Genome Atlas-Live Hepatocellular Carcinoma (TCGA-LIHC) dataset (C); P values were determined using the log-rank test; D-F: Risk curves were based on the risk score for each sample in the training (D), test (E), and entire TCGA-LIHC (F) sets, where red and blue dots indicate high- and low-risk samples, respectively; G-I: The scatter plot was based on the survival status of each sample from the training (G), test (H), and entire TCGA-LIHC (I) sets, where red and blue dots indicate death and survival, respectively; J-L: Heatmaps detailing the expression levels of the three cuproptosis-related long-chain non-coding RNA (lncRNA) signature (CupRLSig) lncRNAs in each group. TCGA-LIHC: The Cancer Genome Atlas-Live Hepatocellular Carcinoma.
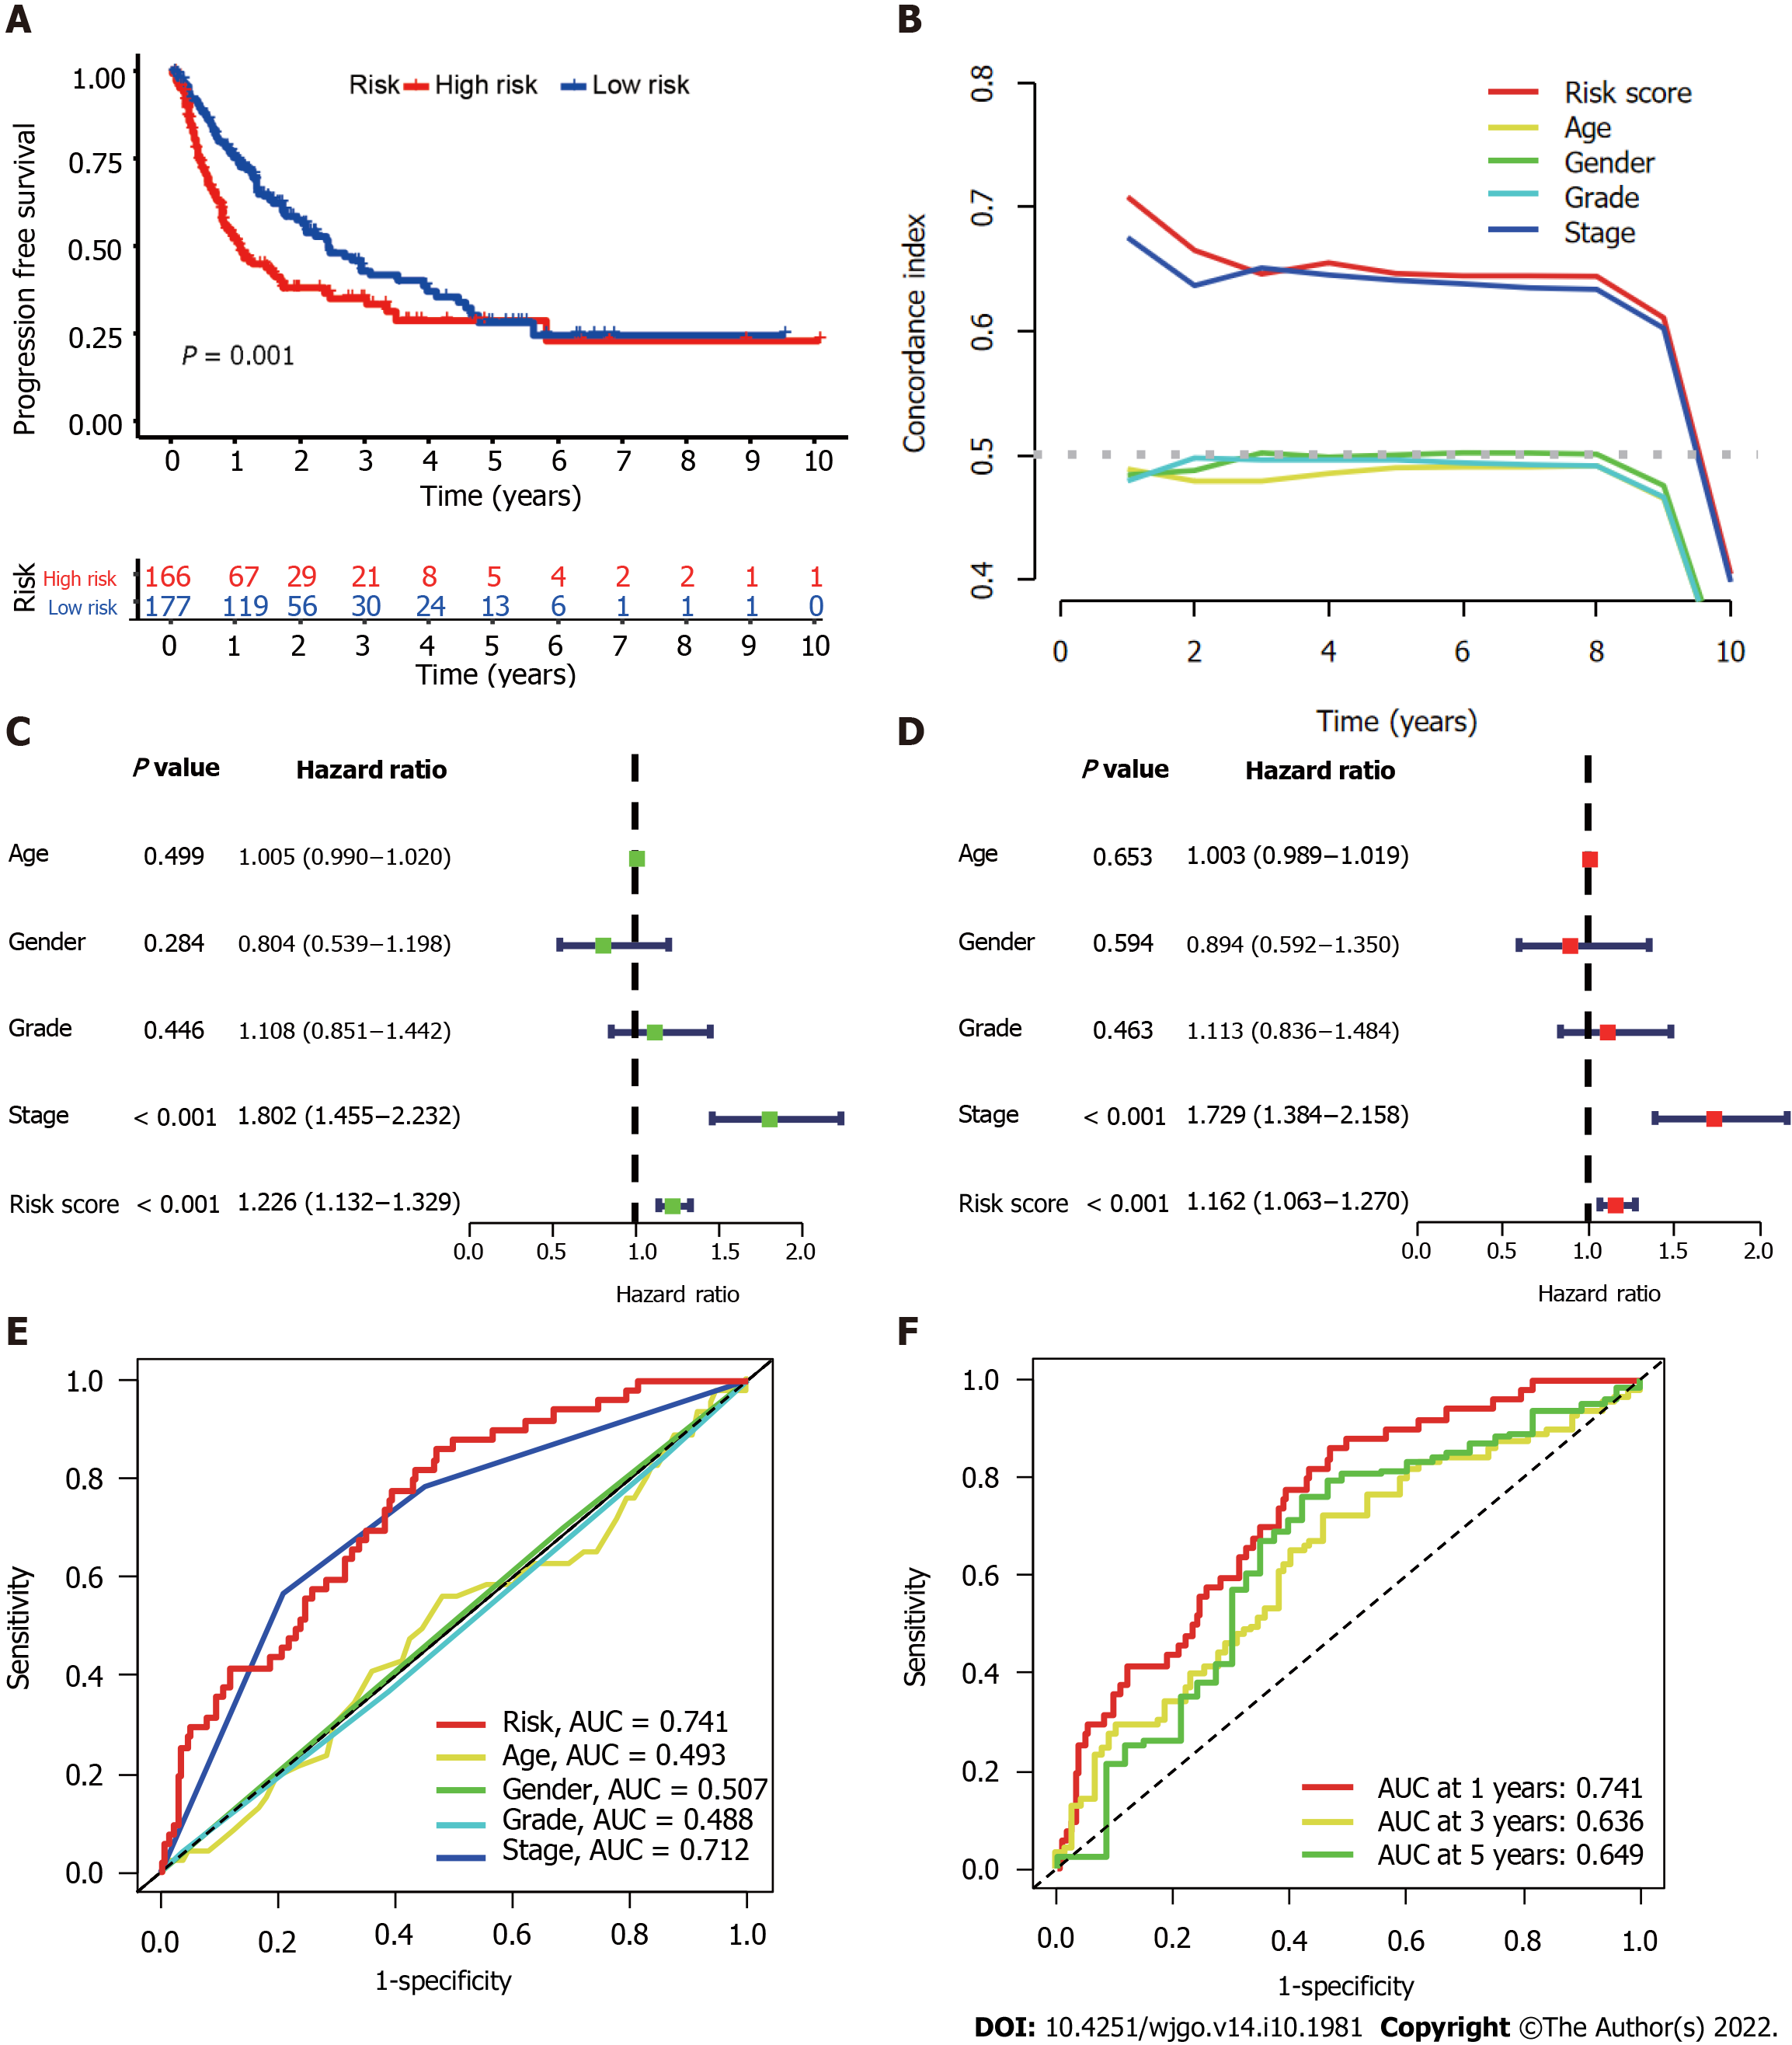
Figure 4 Evaluation of predictive accuracy of the cuproptosis-related long-chain non-coding RNAs signature (CupRLSig) model using the entire The Cancer Genome Atlas-Live Hepatocellular Carcinoma dataset.
A: Kaplan-Meier curves for progression-free survival in high- and low-risk groups stratified by median value of cuproptosis-related long-chain non-coding RNAs signature (CupRLSig) risk score; B: Concordance index curves depicting CupRLSig risk scores and other clinical parameters relevant to predicting hepatocellular carcinoma patient prognosis; C and D: Forest plots for univariate (C) and multivariate (D) Cox proportional-hazards analysis for determination of the independent prognostic value of the CupRLSig risk score; E: Area under the curve (ROC) curves for the CupRLSig risk score and other clinicopathological variables; F: Time-dependent ROC curves for 1-, 3-, and 5-year survival for the CupRLSig signature. ROC: Receiver operating characteristic; AUC: Area under the curve.
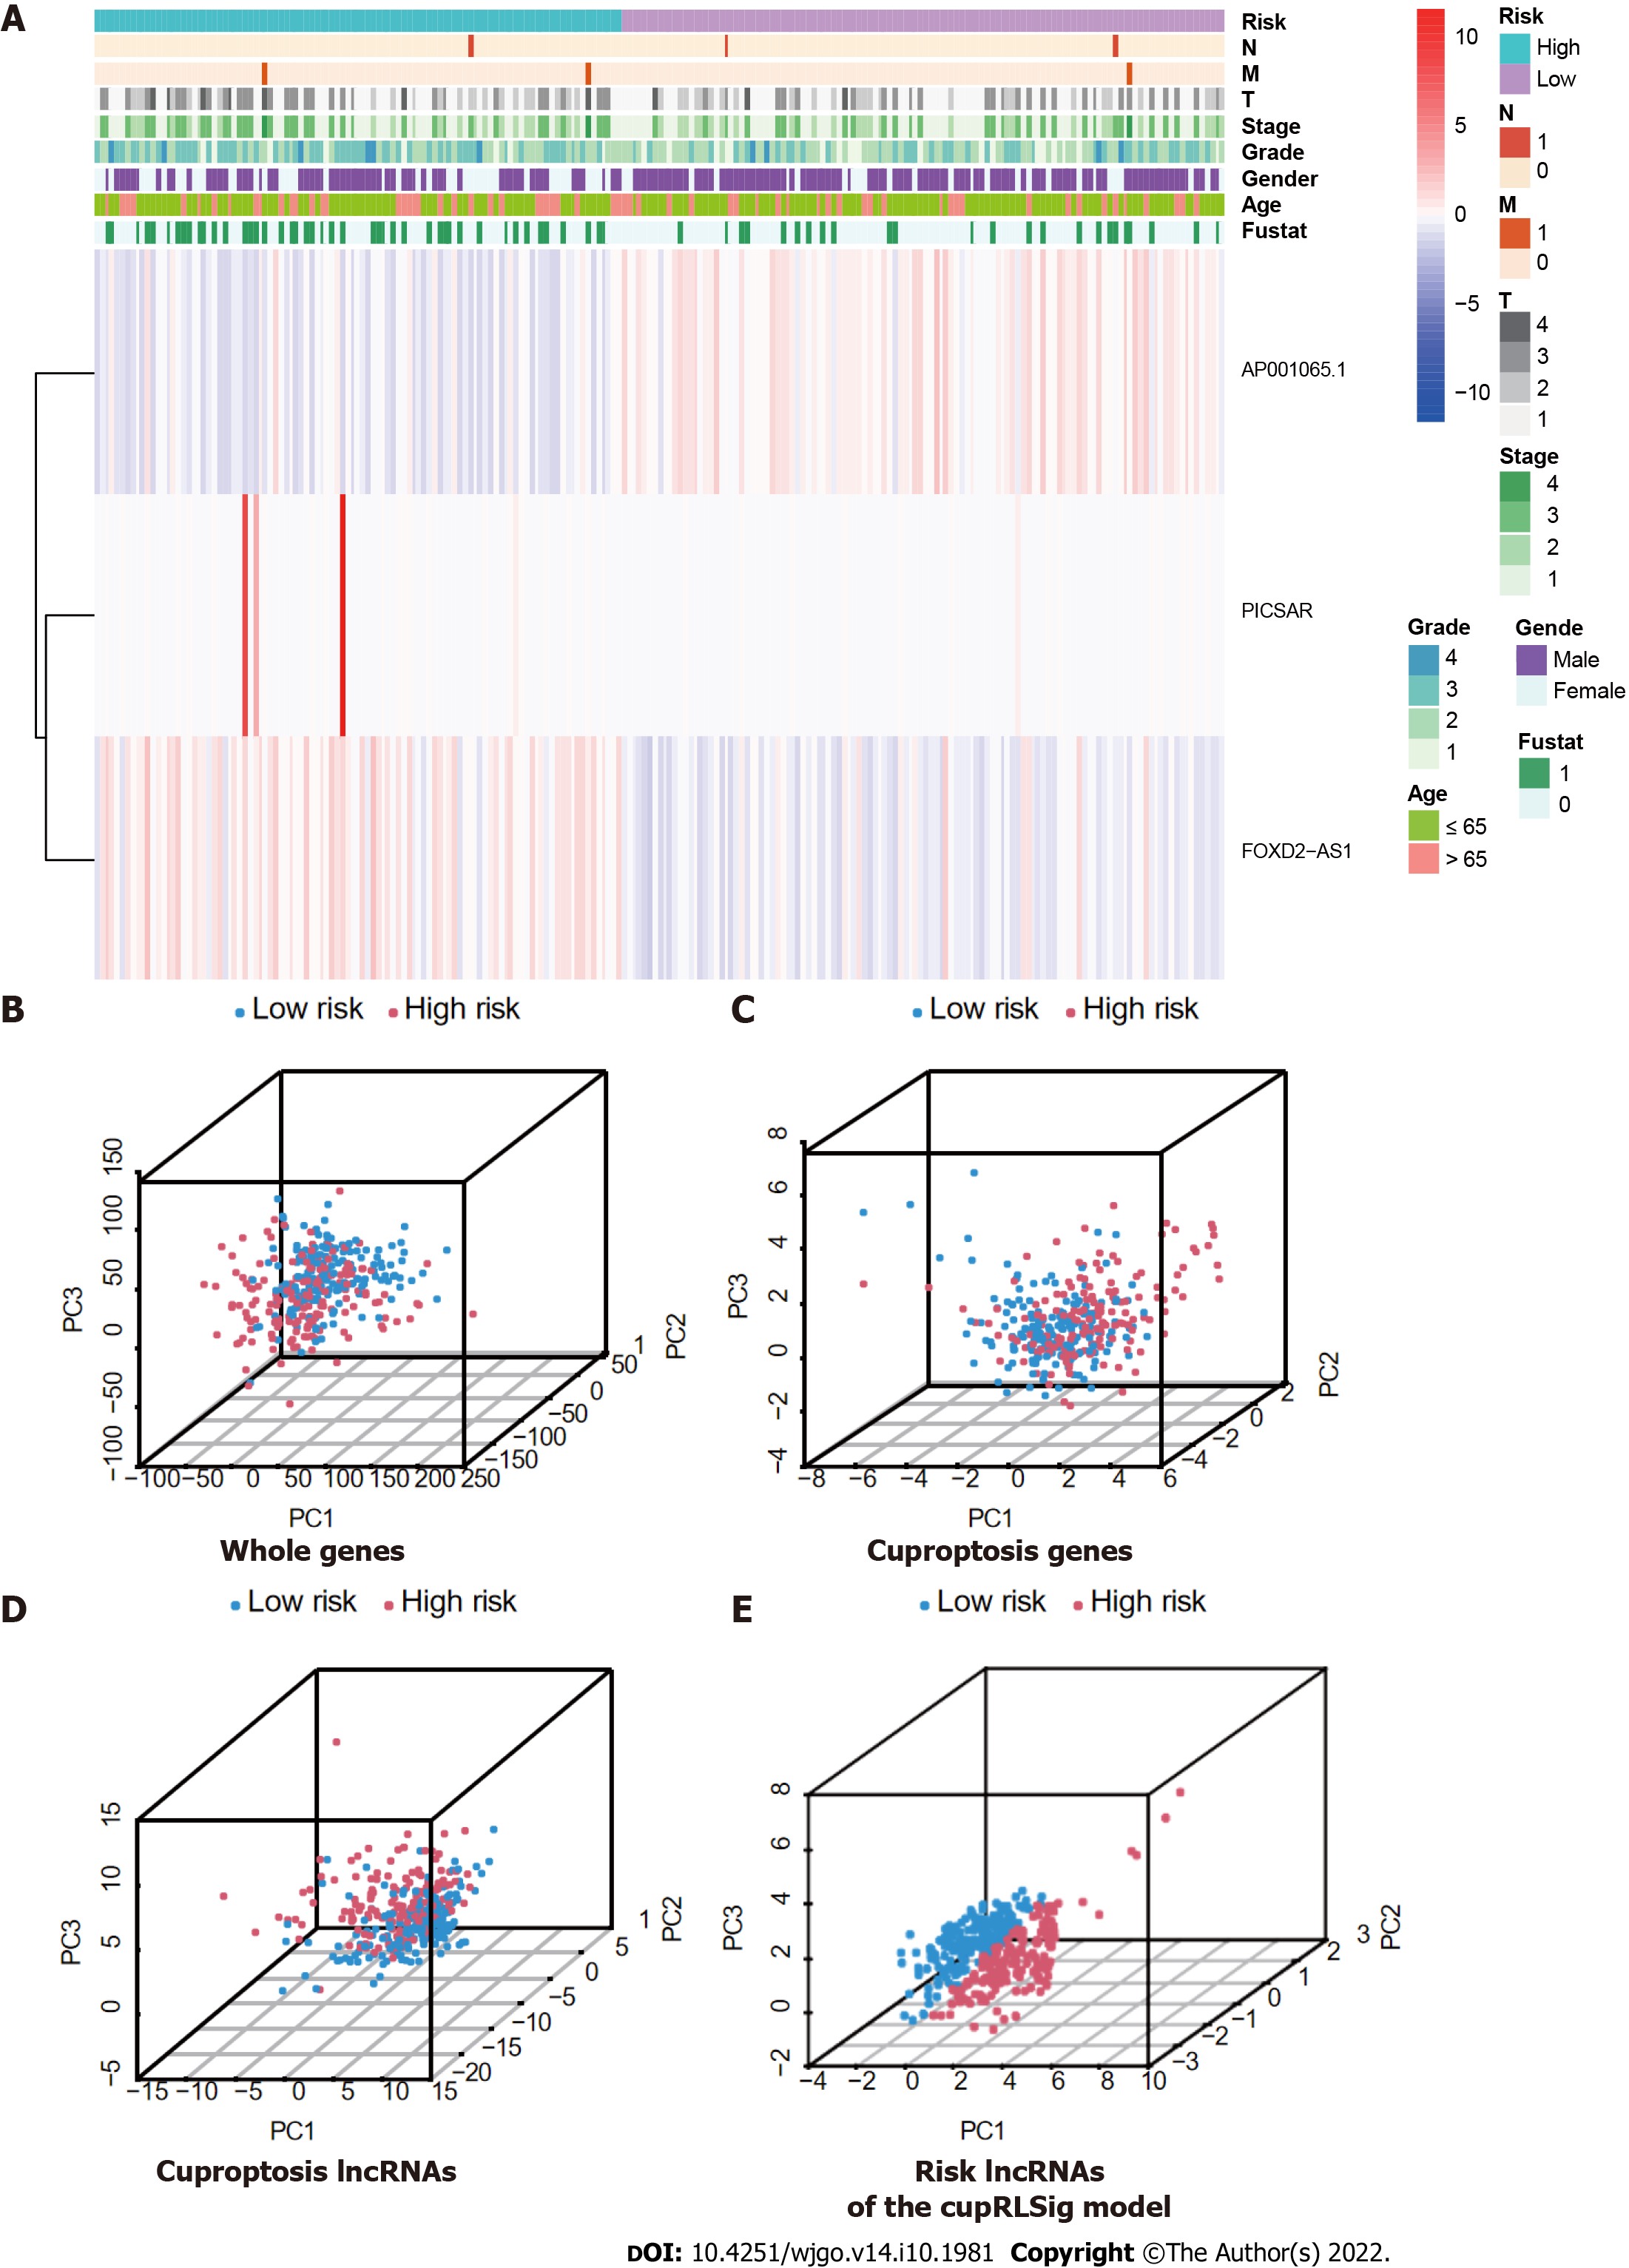
Figure 5 Visualization of expression levels of the three component long-chain non-coding RNAs of the cuproptosis-related long-chain non-coding RNA signature (CupRLSig) model based on clinicopathological variable stratification and principal component analysis of different gene sets performed for classification of patient risk.
A: Heatmaps of expression of the three long-chain non-coding RNAs (lncRNAs) and clinical characteristics for different risk groups; B-E: PCA of low- and high-risk groups based on (B) whole-genome genes, (C) cuproptosis-related genes, (D) cuproptosis-related lncRNAs, and (E) cuproptosis-related lncRNA signature (CupRLSig) model risk lncRNAs. Patients with high risk scores are denoted by red, while those with low risk scores are denoted by blue. N: Lymph node metastasis; M: Mistant metastasis; T: Tumor.
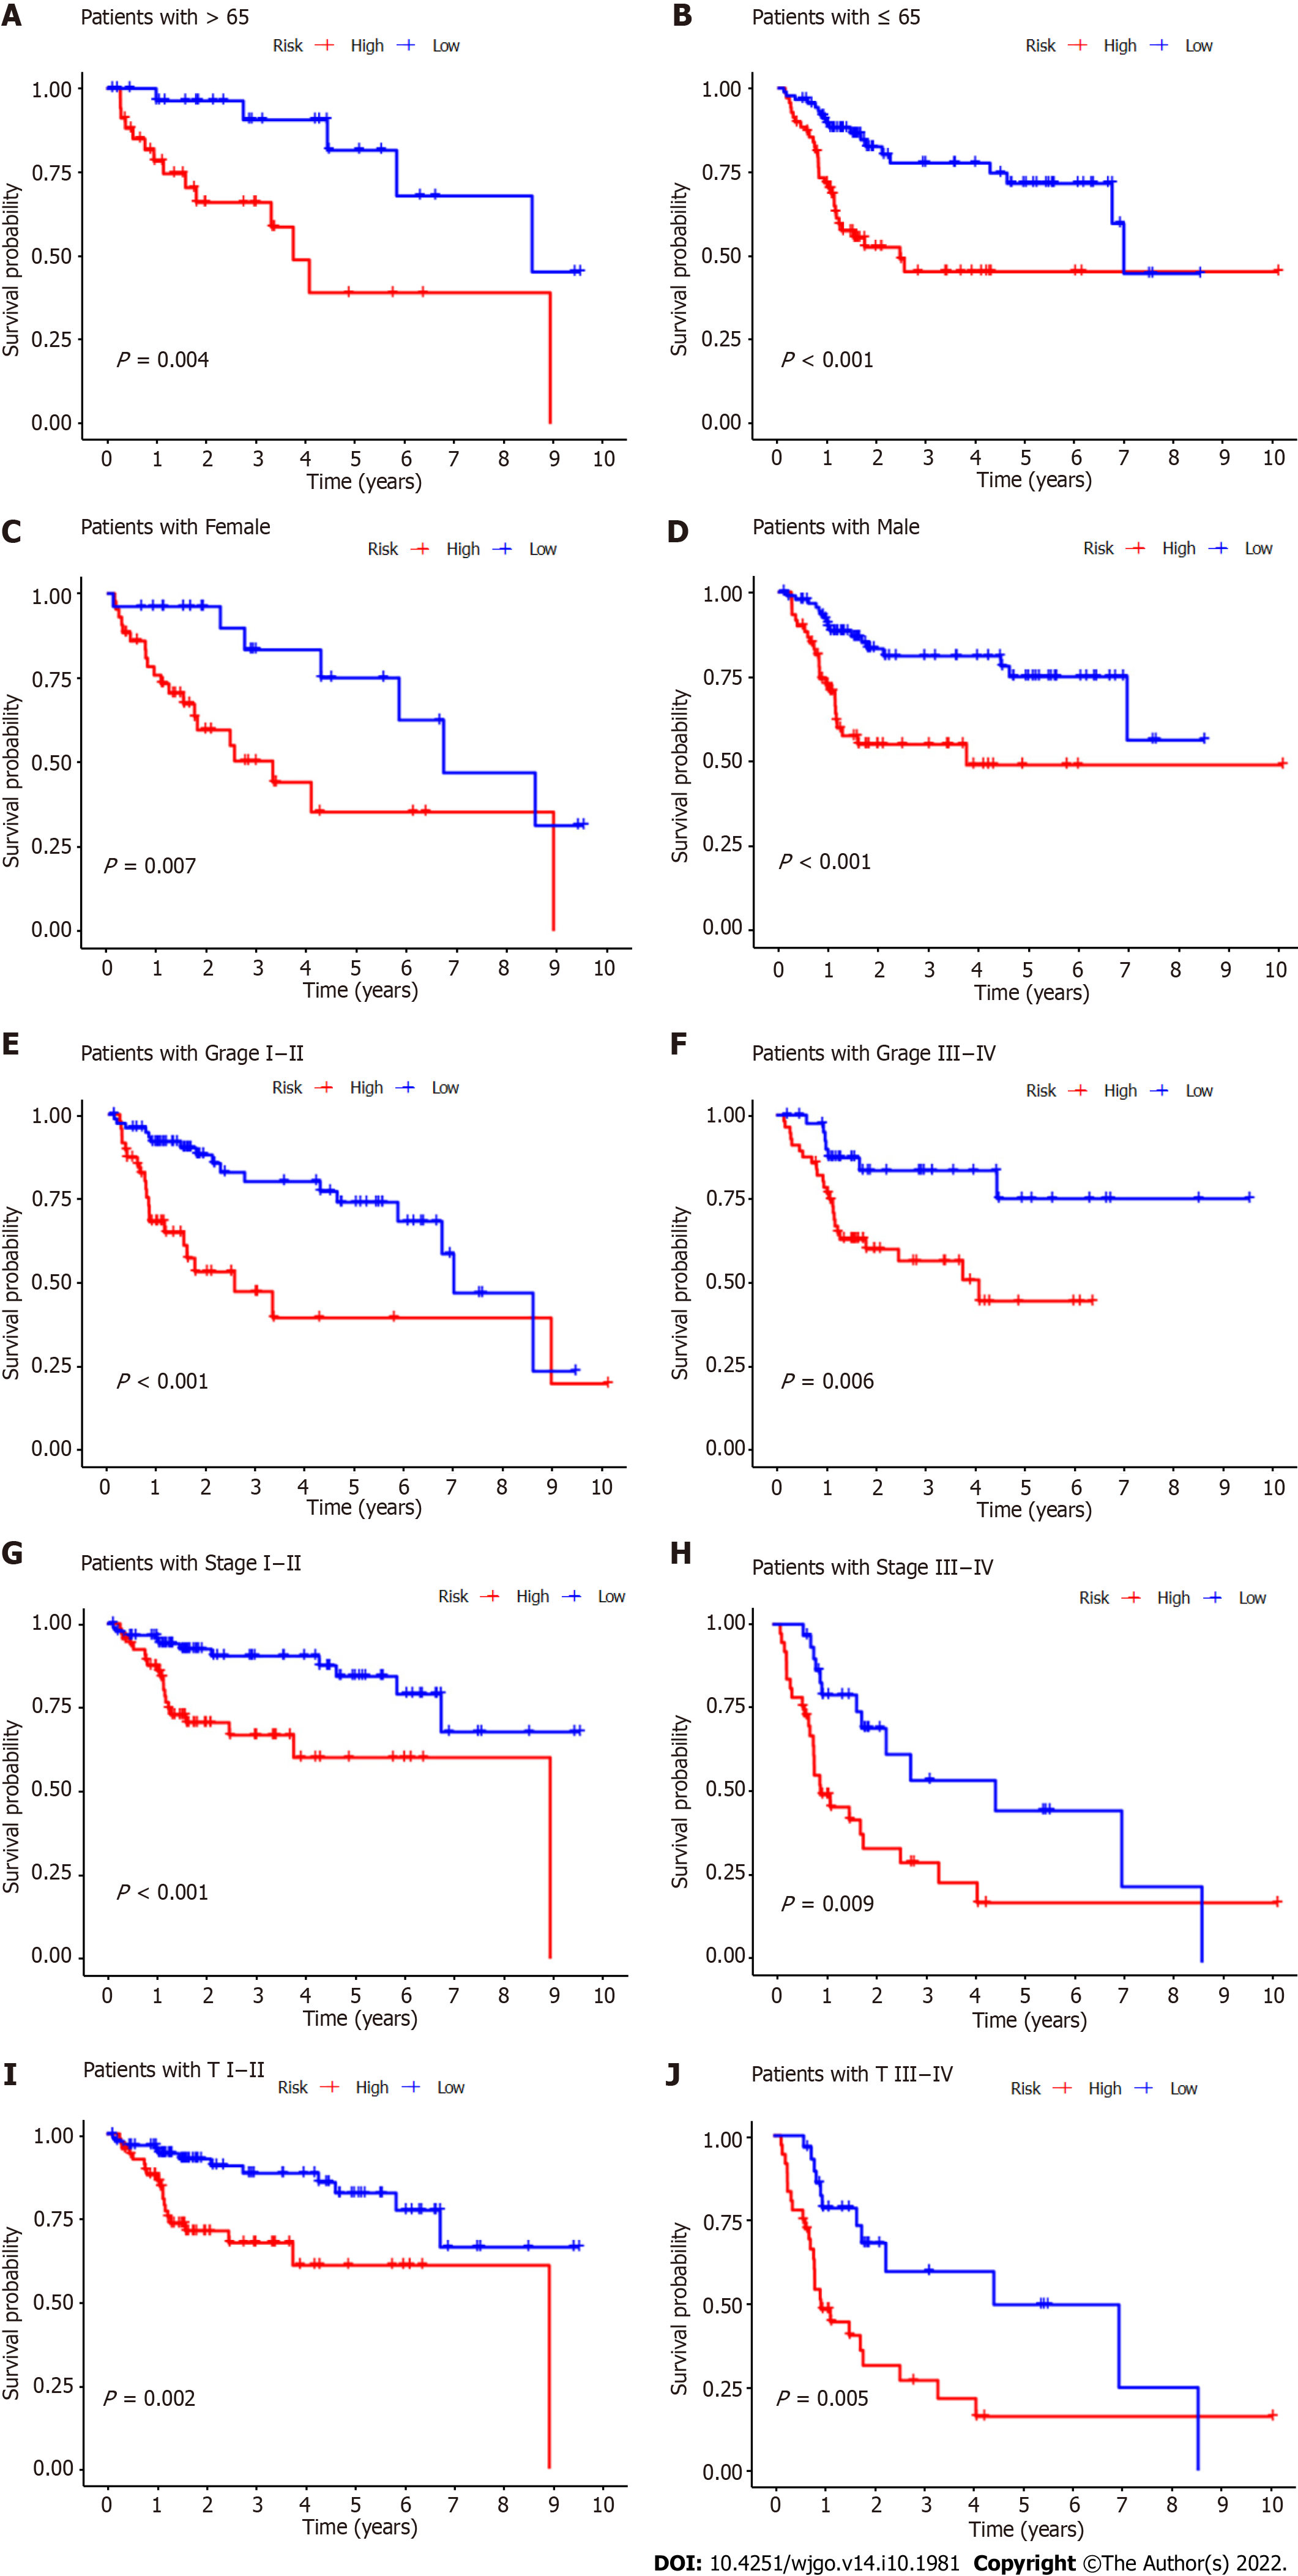
Figure 6 Kaplan-Meier survival curves for high- and low-risk patient groups sorted by clinicopathological variables.
A and B: Age; C and D: Sex; E and F: Grade; G and H: Overall stage; I and J: T stage. T: Tumor.
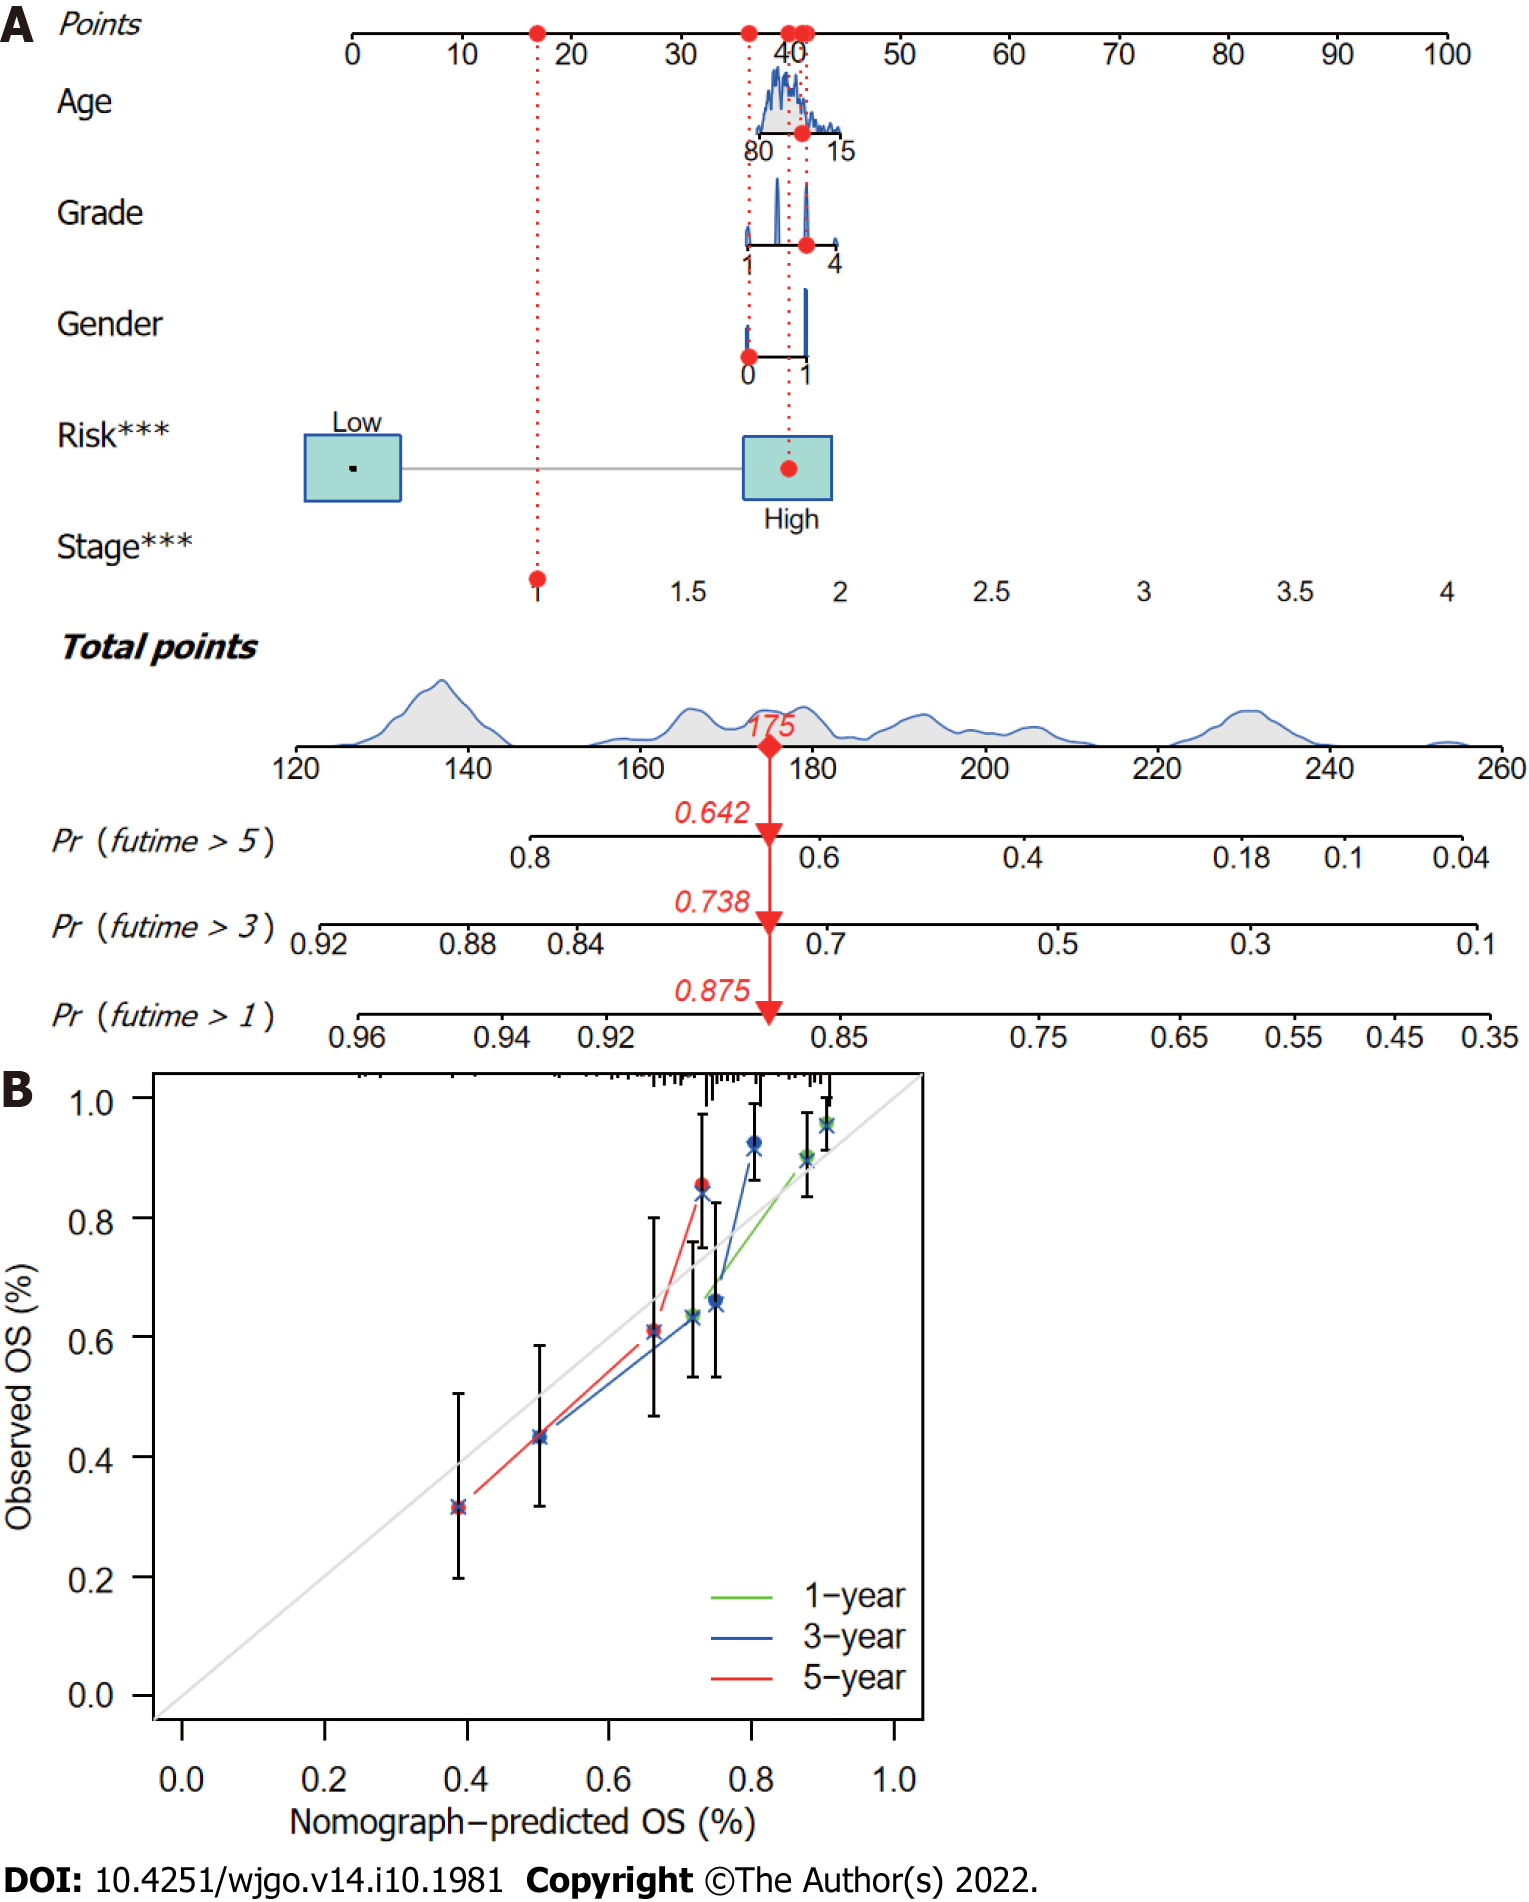
Figure 7 Nomogram construction and verification.
A: Nomogram combining clinicopathological parameters and risk scores to predict 1-, 3-, and 5-year survival probabilities of hepatocellular carcinoma (HCC) patients. Multivariate Cox proportional-hazards analysis was used to determine each parameter’s independent prognostic value. Red dots, diamonds, triangles, and dashed lines represent the 53rd patient, randomly selected for illustration of the nomogram; B: Calibration curves to assess the consistency between actual observed and nomogram-predicted overall survival (OS) at 1-, 3-, and 5-years.
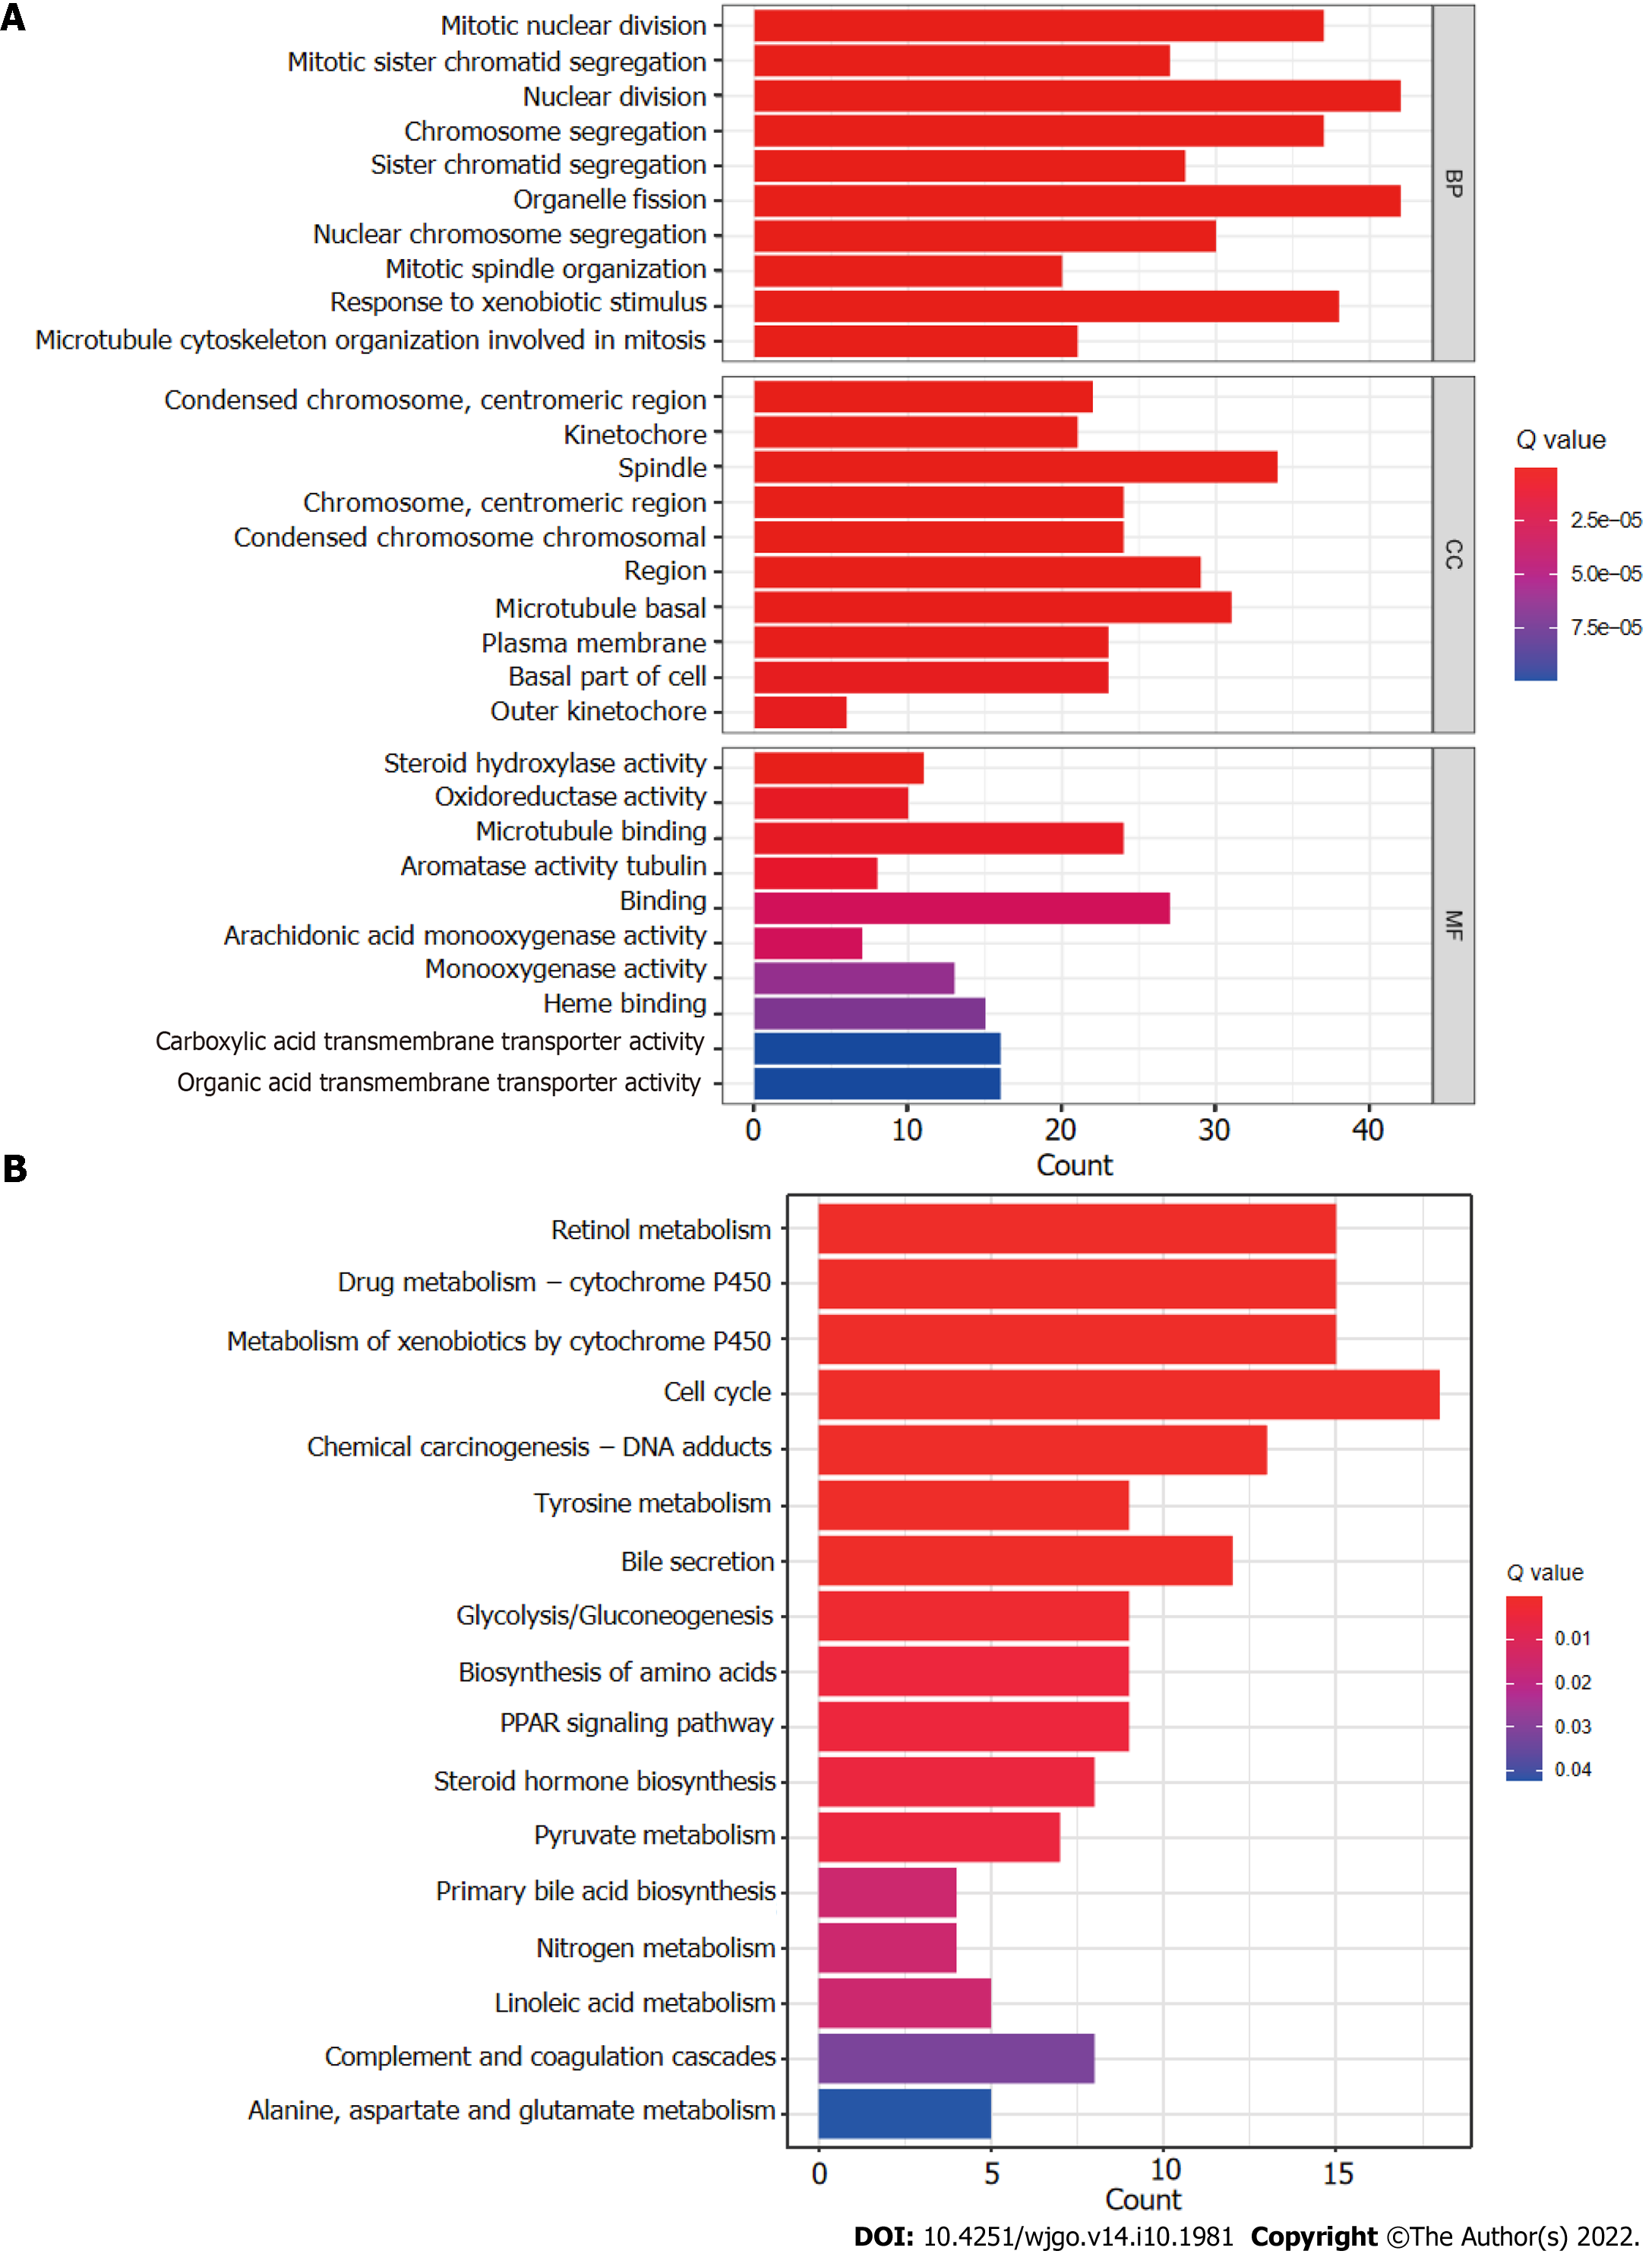
Figure 8 Gene set functional annotation of differentially expressed genes and long-chain non-coding RNAs in high- and low-risk hepatocellular carcinoma groups.
A: In gene ontology analysis, differentially expressed genes and long-chain non-coding RNAs (lncRNAs) were found to be most enriched in biological process terms mitotic nuclear division, mitotic sister chromatid segregation, nuclear division, chromosome segregation, and sister chromatid segregation; in cellular component terms condensed chromosomes, kinetochores, spindles, chromosomes, and condensed chromosomes; and in molecular function terms steroid hydroxylase activity, oxidoreductase activity, microtubule binding, aromatase activity, and tubulin binding; B: Differentially expressed genes and lncRNAs were found to be most enriched in the following five Kyoto Encyclopedia of Genes and Genomes (KEGG) pathways: retinol metabolism, cytochrome P450 drug metabolism, cytochrome P450 xenobiotic metabolism, cell cycle, and chemical carcinogenesis-DNA adducts. BP: Biological process; CC: Cellular component; MF: Molecular function.
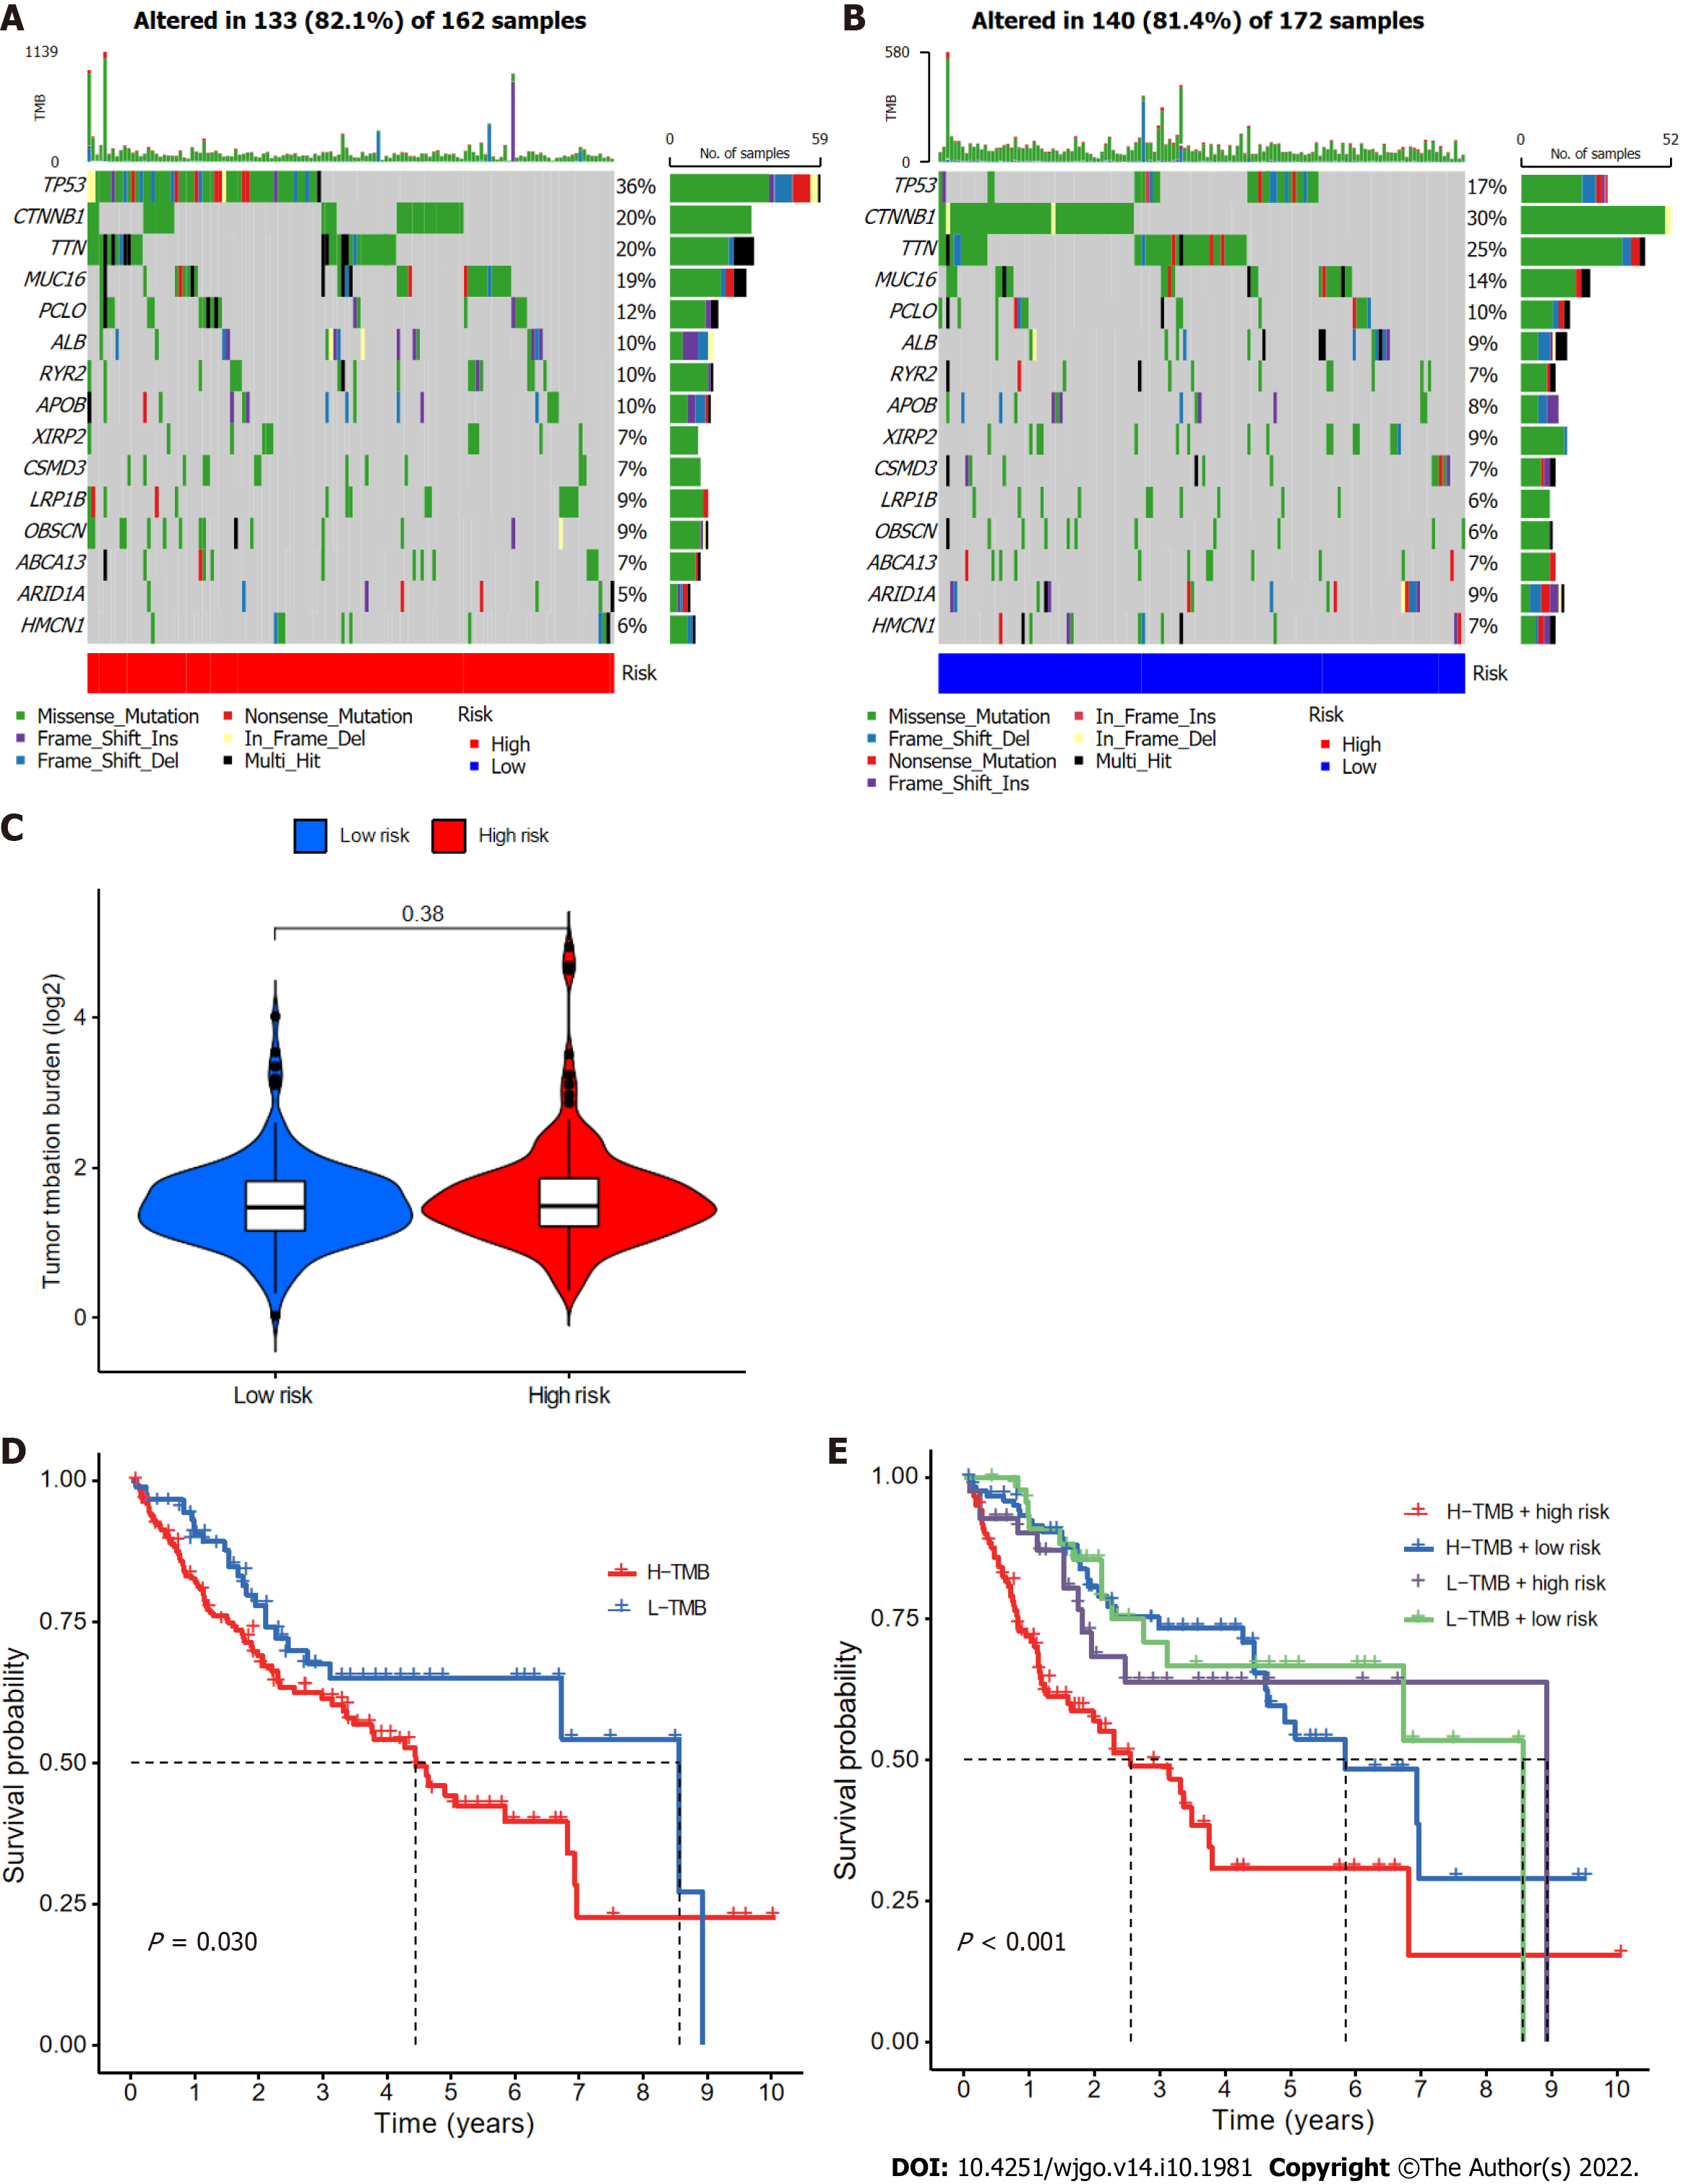
Figure 9 Relationships between cuproptosis-related long-chain non-coding RNA signature (CupRLSig) risk scores and somatic mutation and tumor mutation burden.
A and B: Waterfall plots showing somatic mutations of the most significant 15 genes among high-risk (A) and low-risk (B) hepatocellular carcinoma (HCC) patients; C: Comparison of tumor mutation burden (TMB) between low- and high-risk subgroups; D: Kaplan-Meier curves for high- and low-TMB groups; E: Kaplan-Meier curves for subgroup analyses of patients stratified by TMB and risk score. The P value is representative of the results of the analysis of variance test among subgroups.
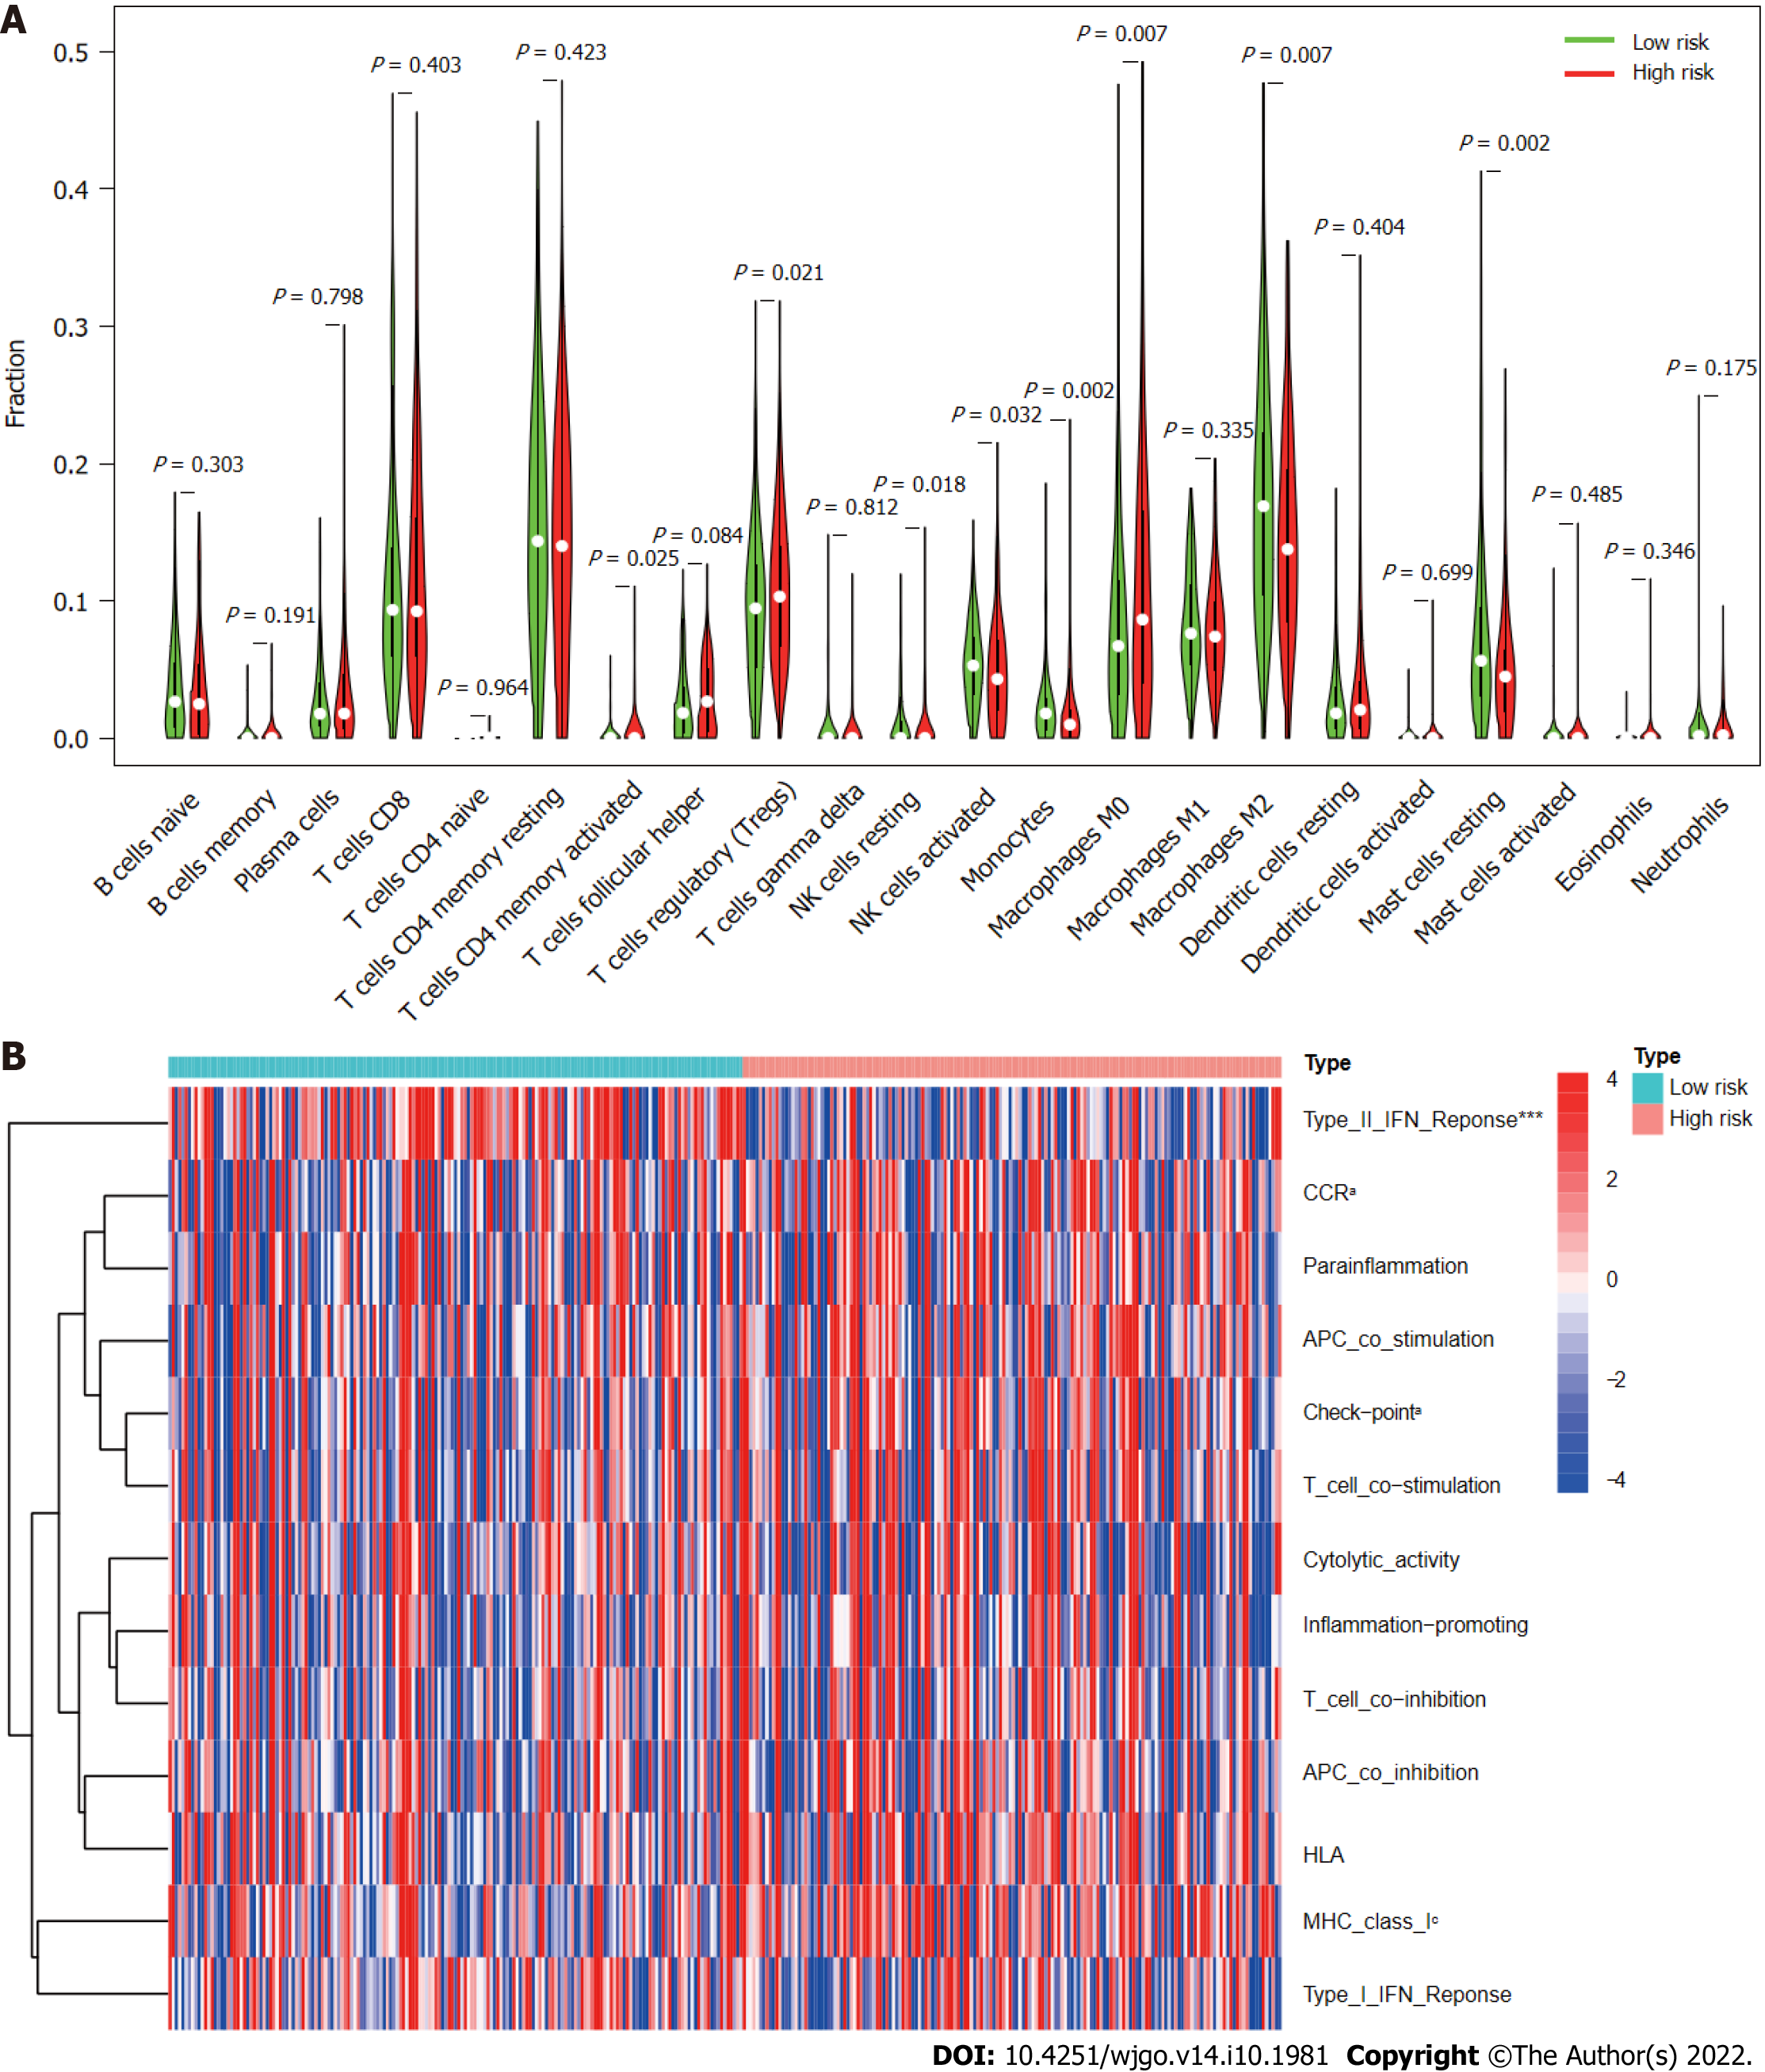
Figure 10 Immune cell infiltration and immune-related functions in different risk groups.
A: Violin plot showing whether there were significant differences in immune infiltration among 22 types of cells between high- and low-risk subgroups; B: Heatmap showing whether there were significant differences in 13 immune-related functions between high- and low-risk subgroups. NK: Natural killer; CCR: C-C chemokine receptor; APC: Antigen-presenting cell; HLA: Human leukocyte antigen; MHC: Major histocompatibility complex; IFN: Interferon. aP < 0.05; cP < 0.001.
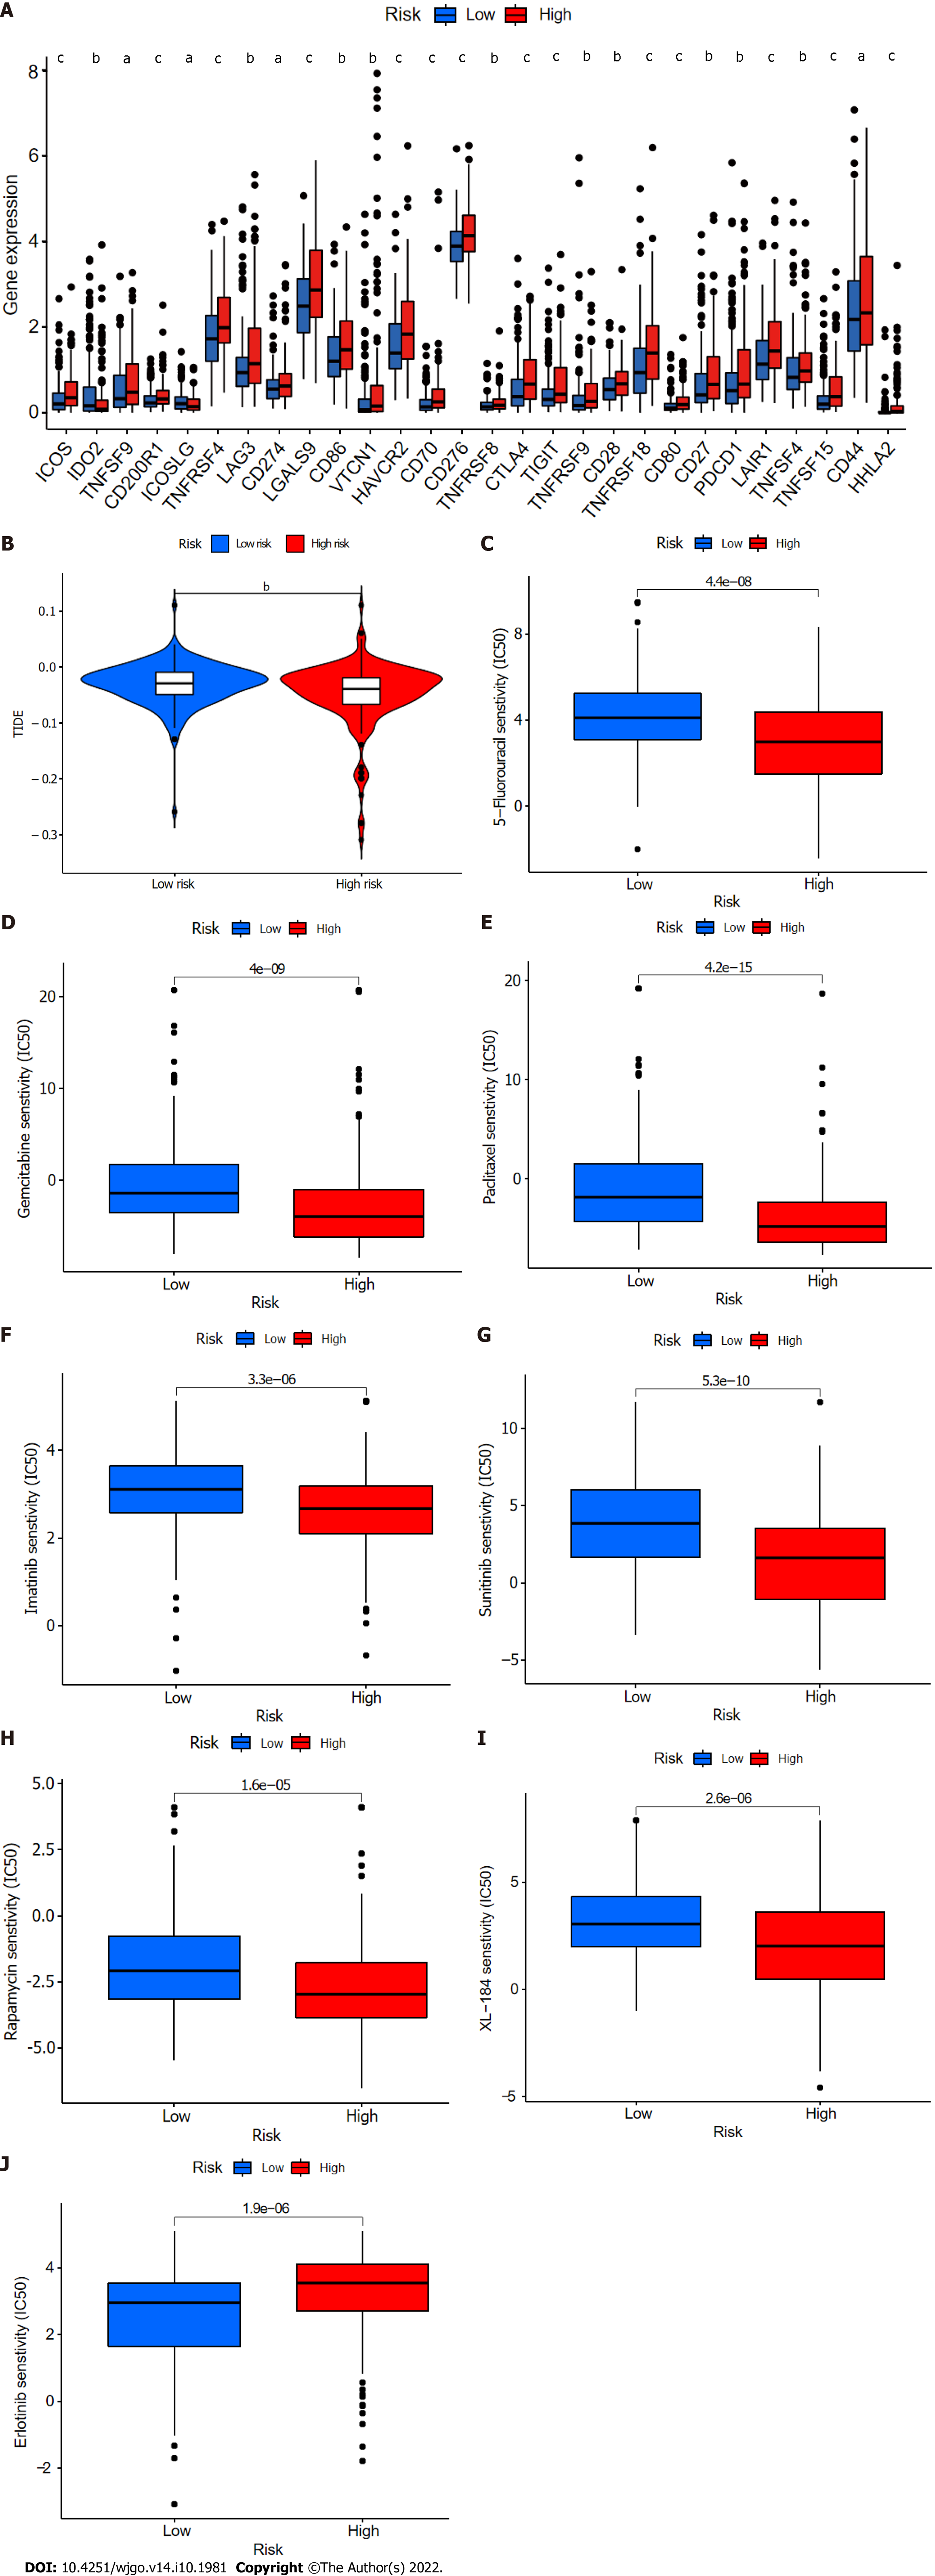
Figure 11 Comparison of immune checkpoints, tumor immune dysfunction, and exclusion module scores, and chemotherapy and targeted therapy drug efficacy in high- and low-risk groups.
A: Expression of 28 immune checkpoint genes differed between the high- and low-risk groups. Red and blue boxes represent high- and low-risk patients, respectively; B: Online software tumor immune dysfunction (TIDE) predictions of outcomes in HCC subgroups treated with either anti-PD1 or anti-CTLA4 therapy. A higher TIDE score suggests a greater likelihood of tumor immune escape and a poorer response to immunotherapy; C-J: IC50 values for (C) 5-fluorouracil, (D) gemcitabine, (E) paclitaxel, (F) imatinib, (G) sunitinib, (H) rapamycin, (I) XL-184 (cabozantinib), and (J) erlotinib in high- and low-risk groups. IC50, half-maximal inhibitory concentration. aP < 0.05; bP < 0.01; cP < 0.001. NS: Not significant.
- Citation: Huang EM, Ma N, Ma T, Zhou JY, Yang WS, Liu CX, Hou ZH, Chen S, Zong Z, Zeng B, Li YR, Zhou TC. Cuproptosis-related long non-coding RNAs model that effectively predicts prognosis in hepatocellular carcinoma. World J Gastrointest Oncol 2022; 14(10): 1981-2003
- URL: https://www.wjgnet.com/1948-5204/full/v14/i10/1981.htm
- DOI: https://dx.doi.org/10.4251/wjgo.v14.i10.1981


