Copyright
©The Author(s) 2022.
World J Gastrointest Oncol. Jan 15, 2022; 14(1): 278-294
Published online Jan 15, 2022. doi: 10.4251/wjgo.v14.i1.278
Published online Jan 15, 2022. doi: 10.4251/wjgo.v14.i1.278
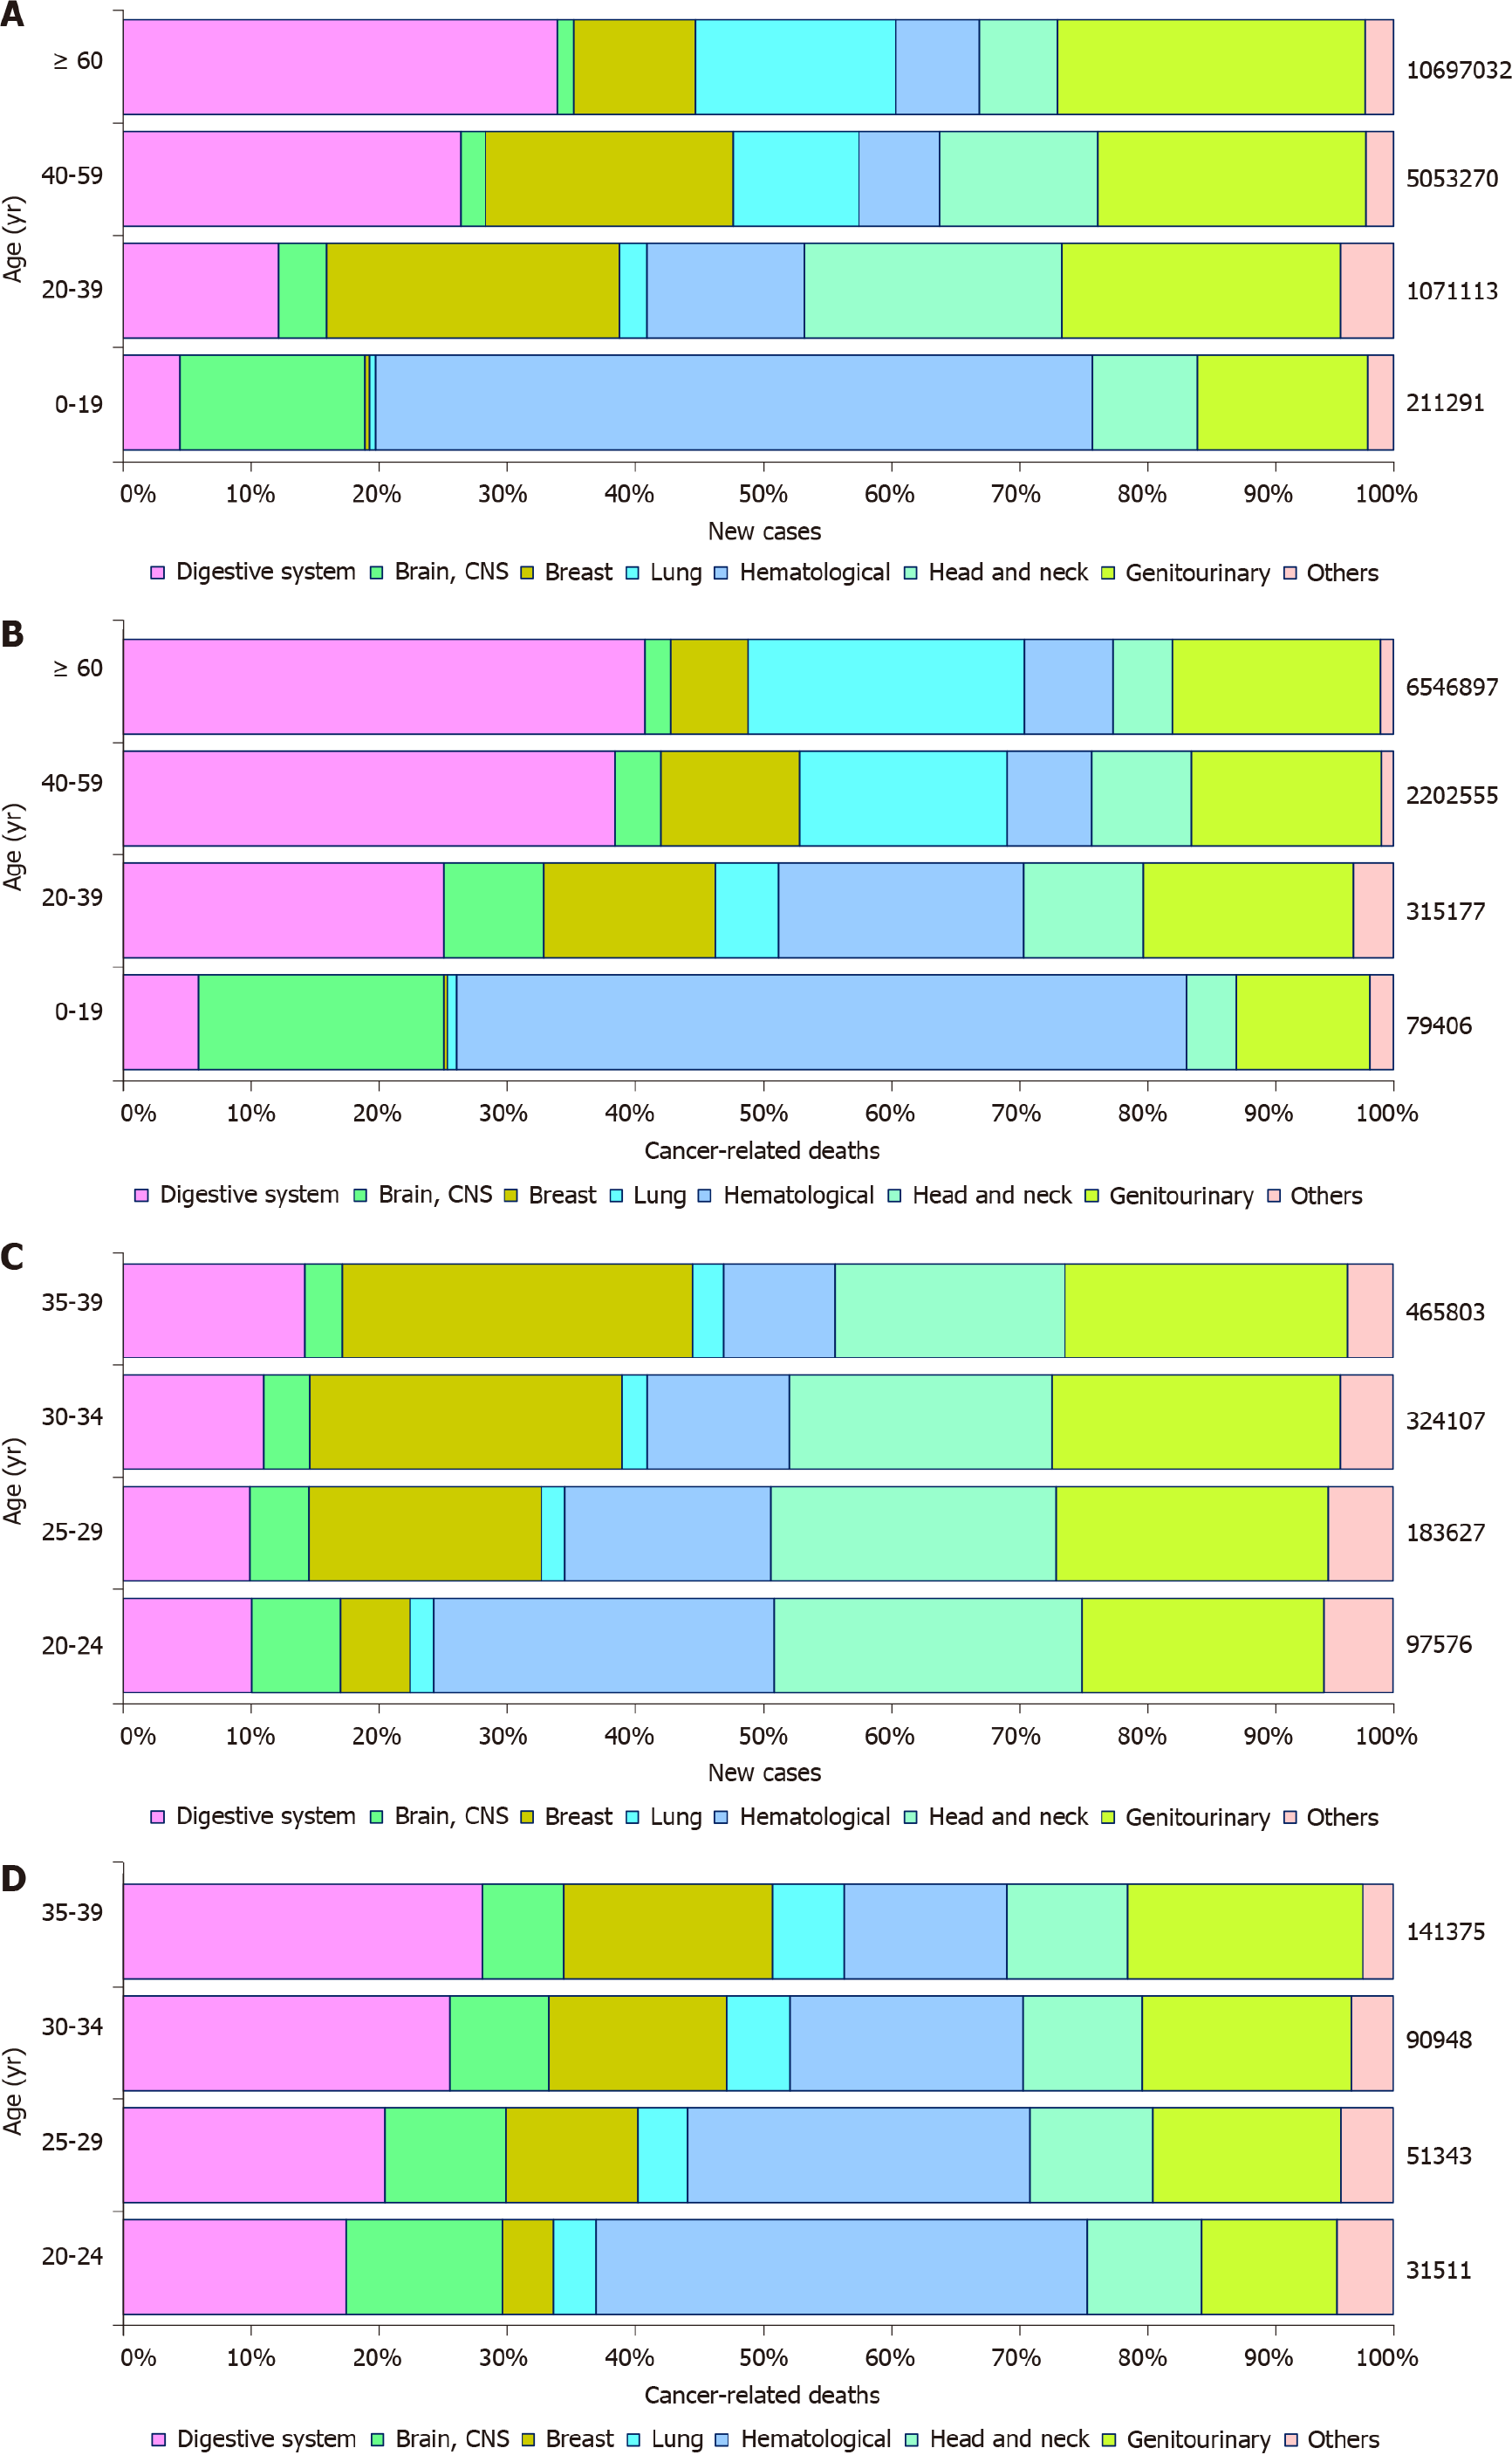
Figure 1 Cancer type distribution for estimated new cancer cases and cancer-related deaths.
A and B: Cancer type distribution for estimated (A) new cancer cases and (B) cancer-related deaths in 2020 among younger, adolescent, young adult, and older age groups; C and D: Cancer type distribution for estimated (C) new cancer cases and (D) cancer-related deaths in 2020 among young adults categorized into four 5-year bands. CNS: central nervous system.
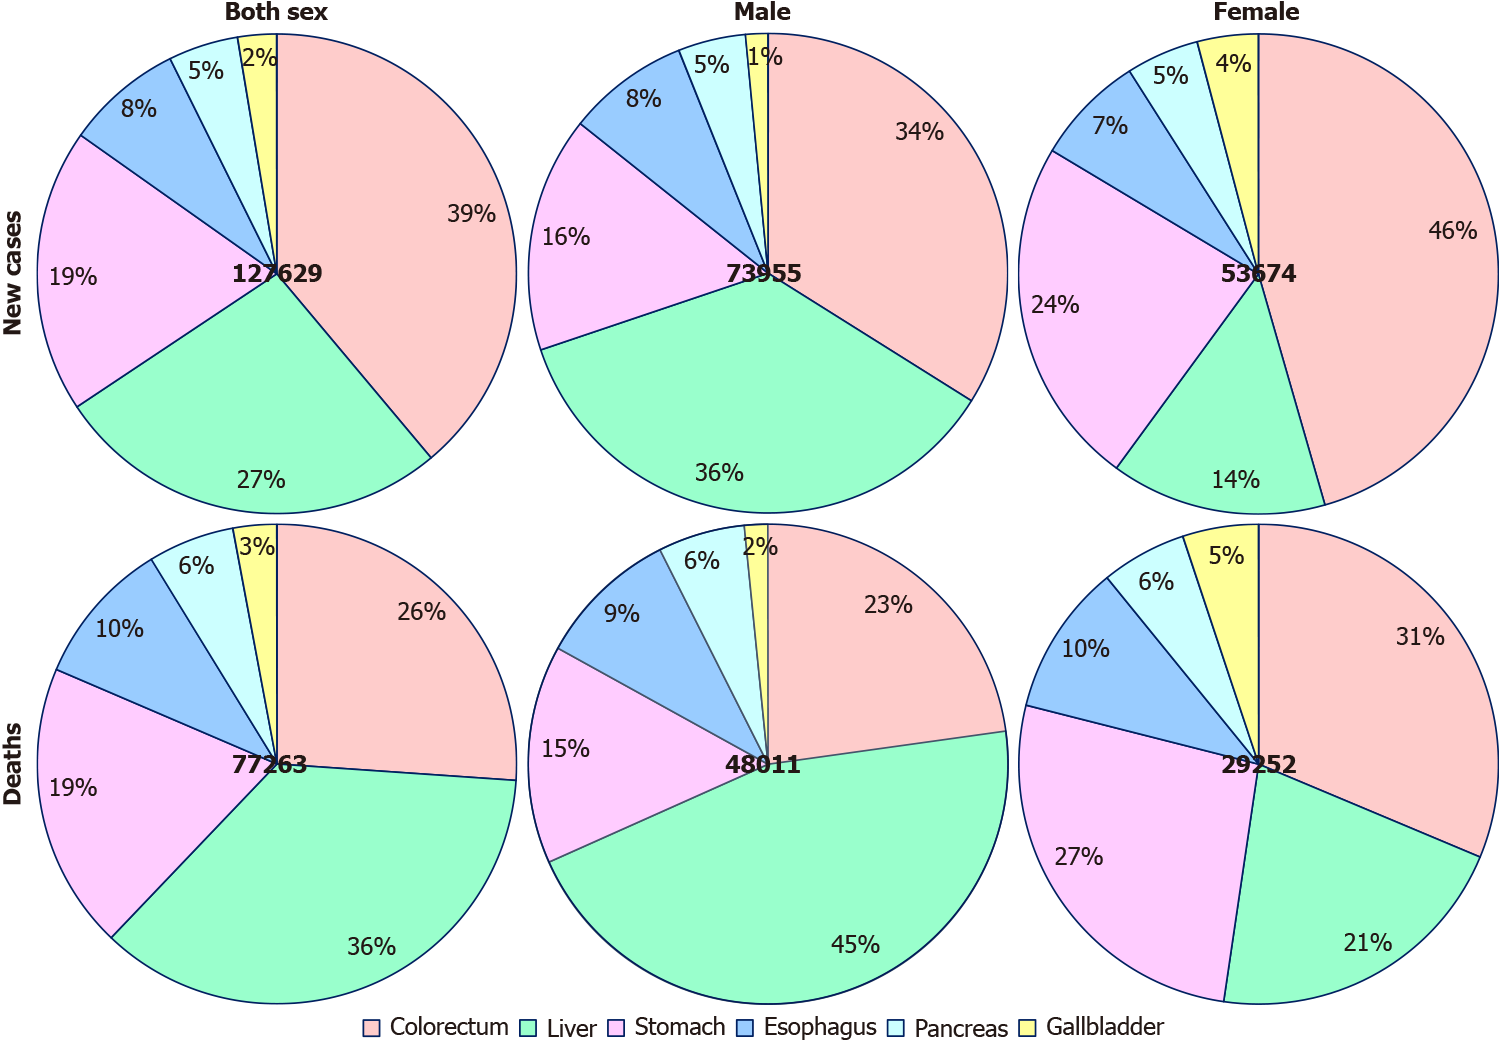
Figure 2 Proportion of six digestive cancer types for estimated new cases and cancer-related deaths among 20- to 39-year-olds in 2020 by sex.
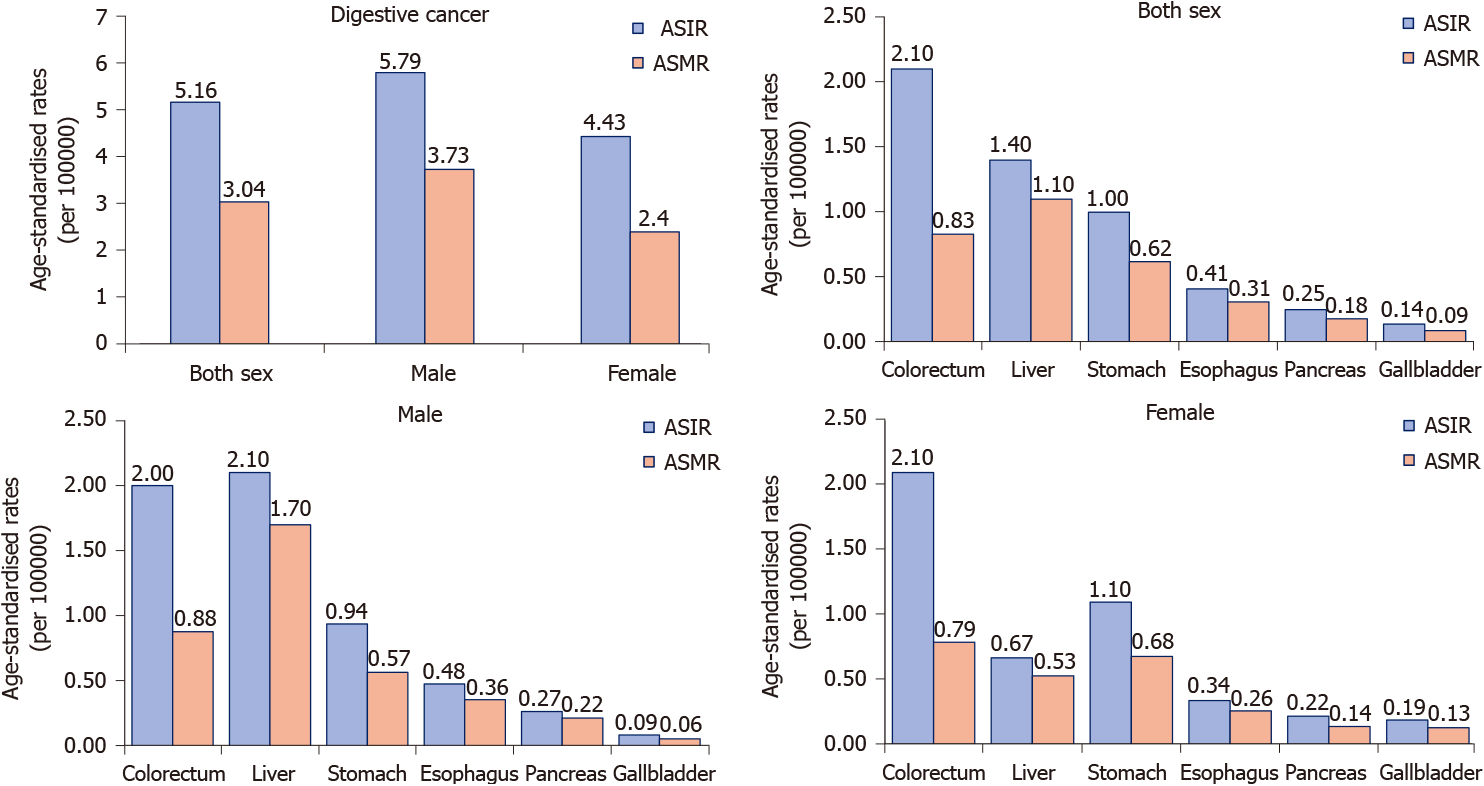
Figure 3 Estimated age-standardized incidence rate and age-standardized mortality rate among 20- to 39-year-olds in 2020 by sex and digestive cancer type.
ASIR: Age-standardized incidence rate; ASMR: Age-standardized mortality rate.
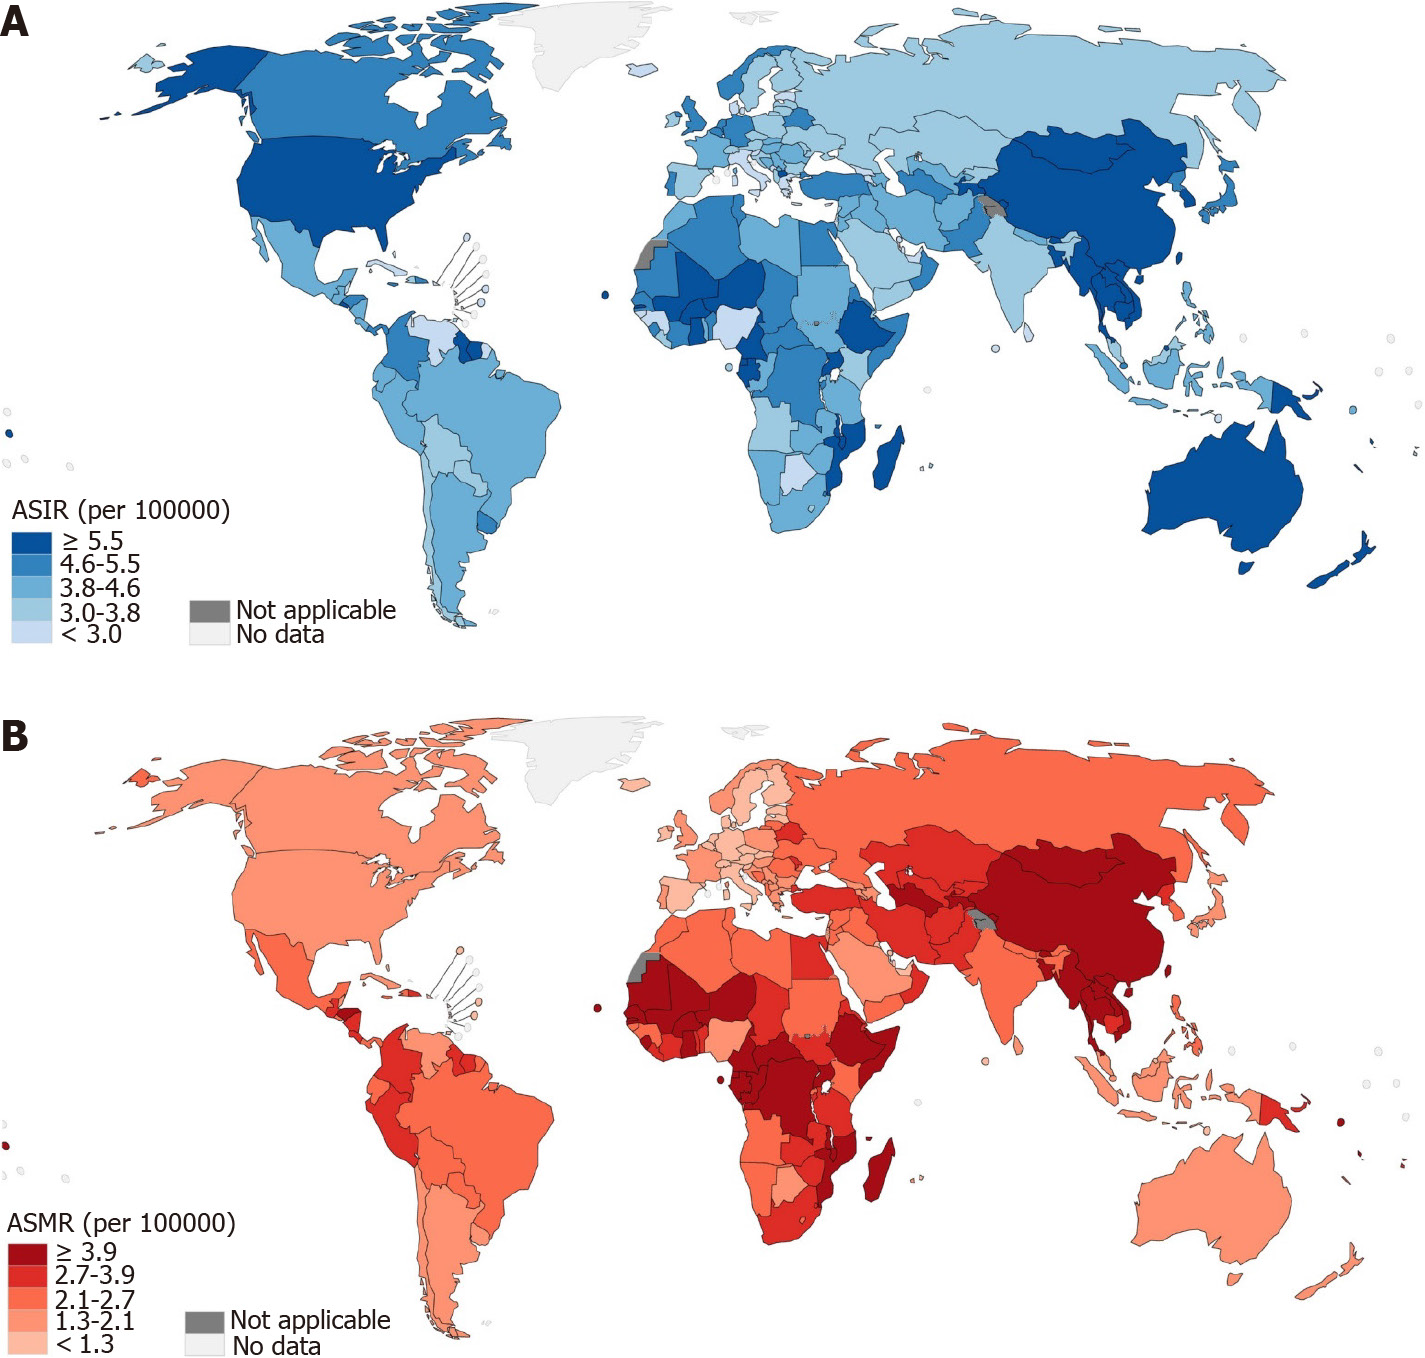
Figure 4 Global map depicting digestive cancer by country in terms of estimated age-standardized incidence rate and age-standardized mortality rate among 20- to 39-year-olds in 2020.
A: Age-standardized incidence rate; B: Age-standardized mortality rate. ASIR: age-standardized incidence rate; ASMR: age-standardized mortality rate.
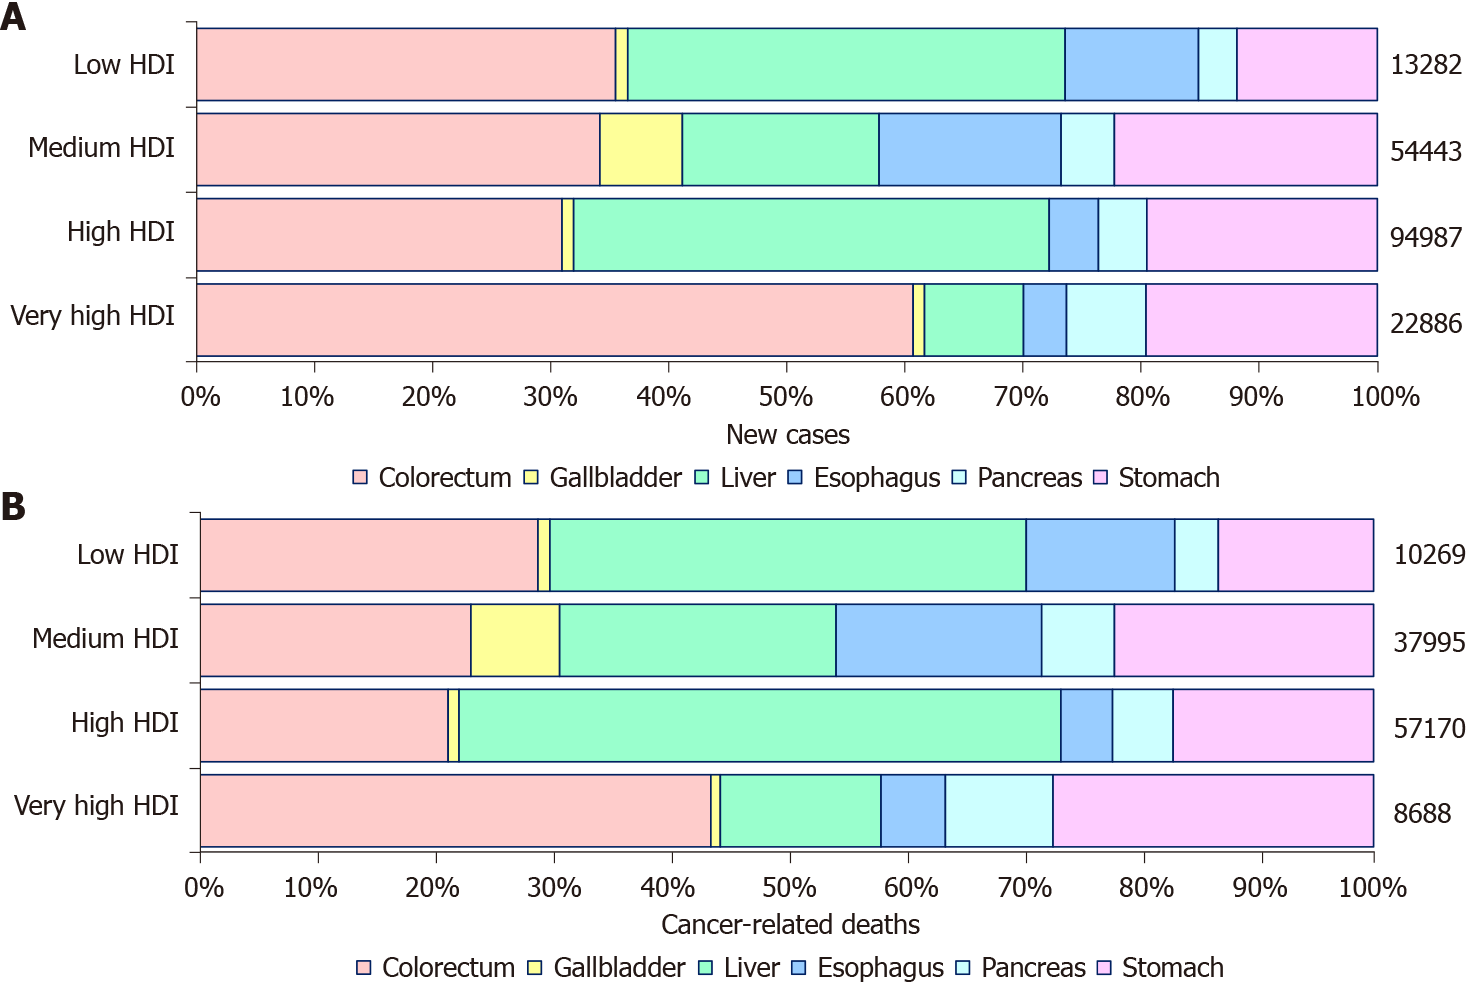
Figure 5 Digestive cancer type distribution for estimated new cancer cases and cancer-related deaths in 2020 among young adults by human development index level.
HDI: Human development index.
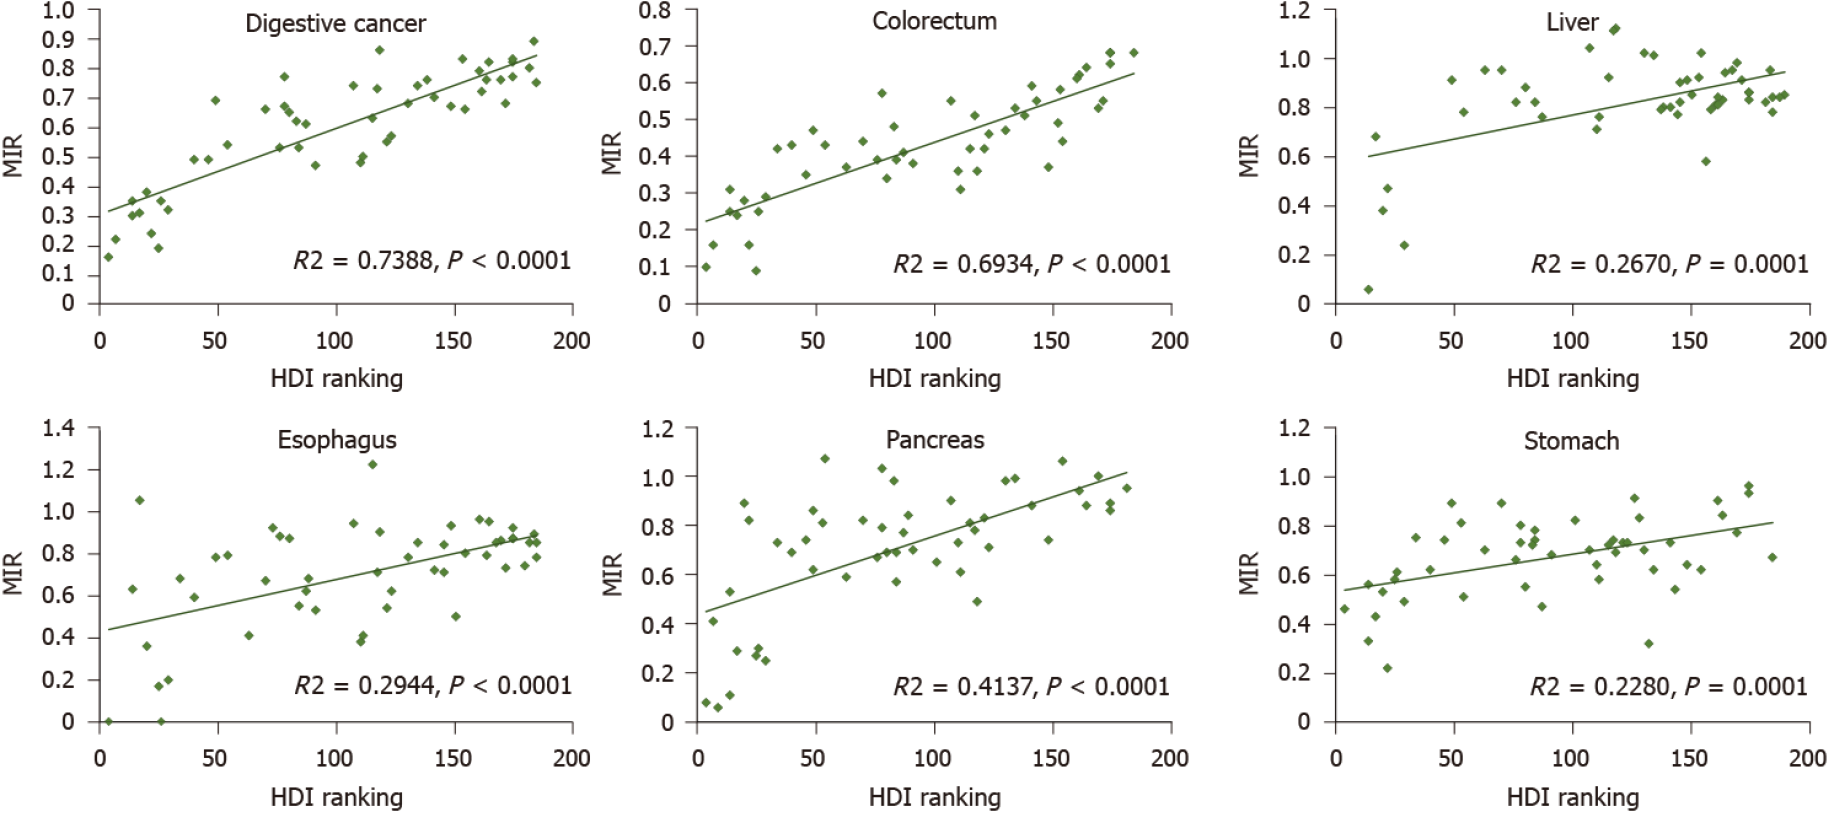
Figure 6 The association between human development index rankings and the mortality-to-incidence ratio of digestive cancer and its five subtype cancers.
HDI: Human development index; MIR: Mortality-to-incidence ratio.
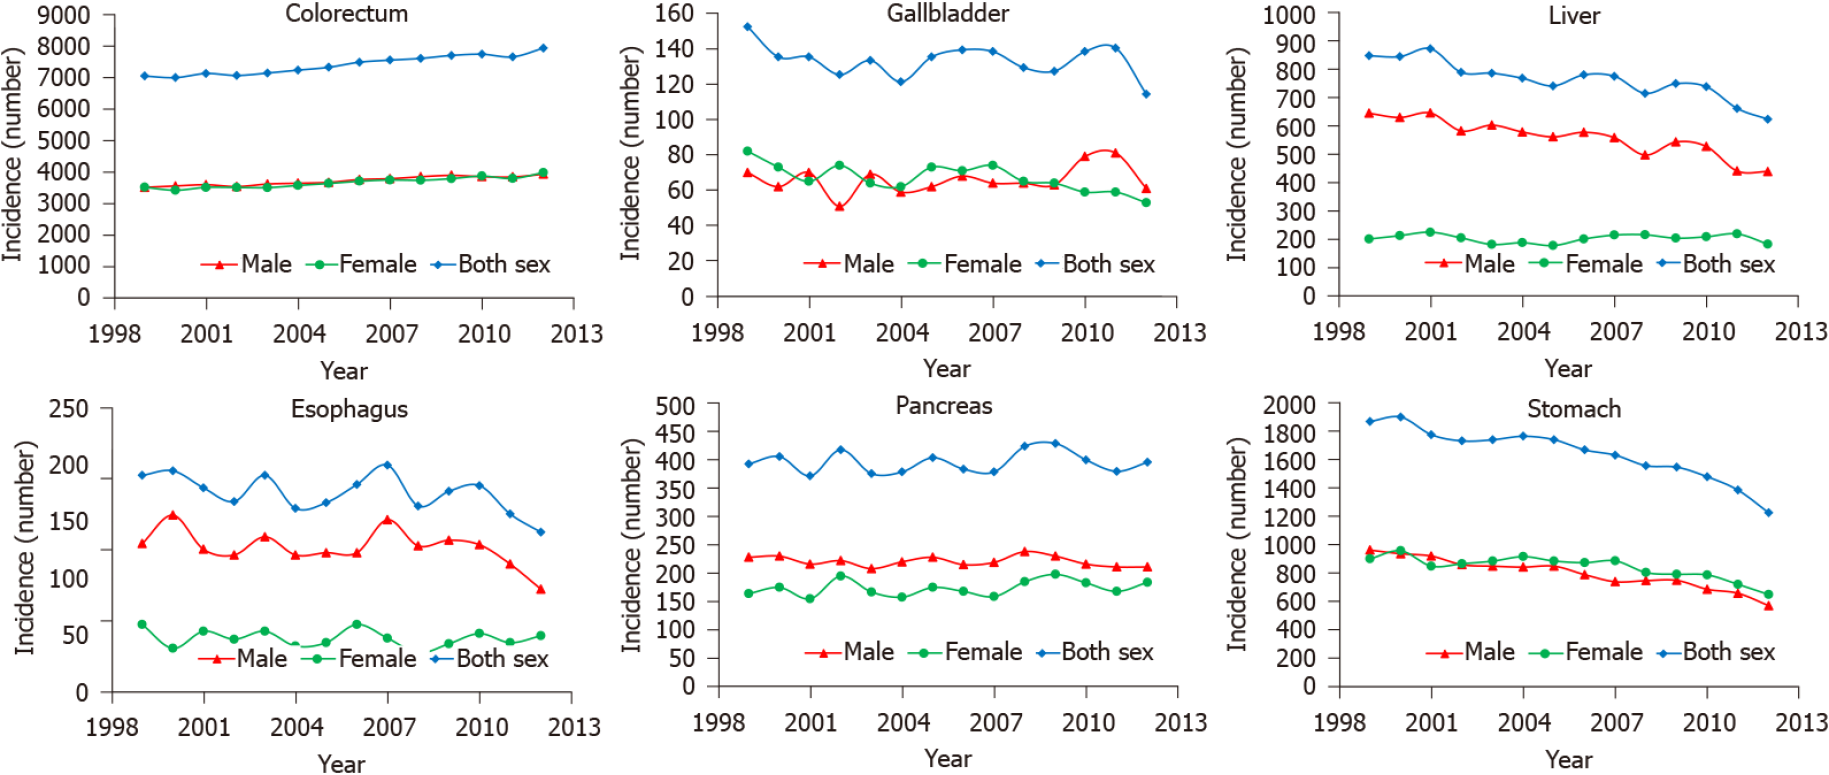
Figure 7 Time trends in new cases of six digestive cancers in young adults, both sexes, 1999-2012.
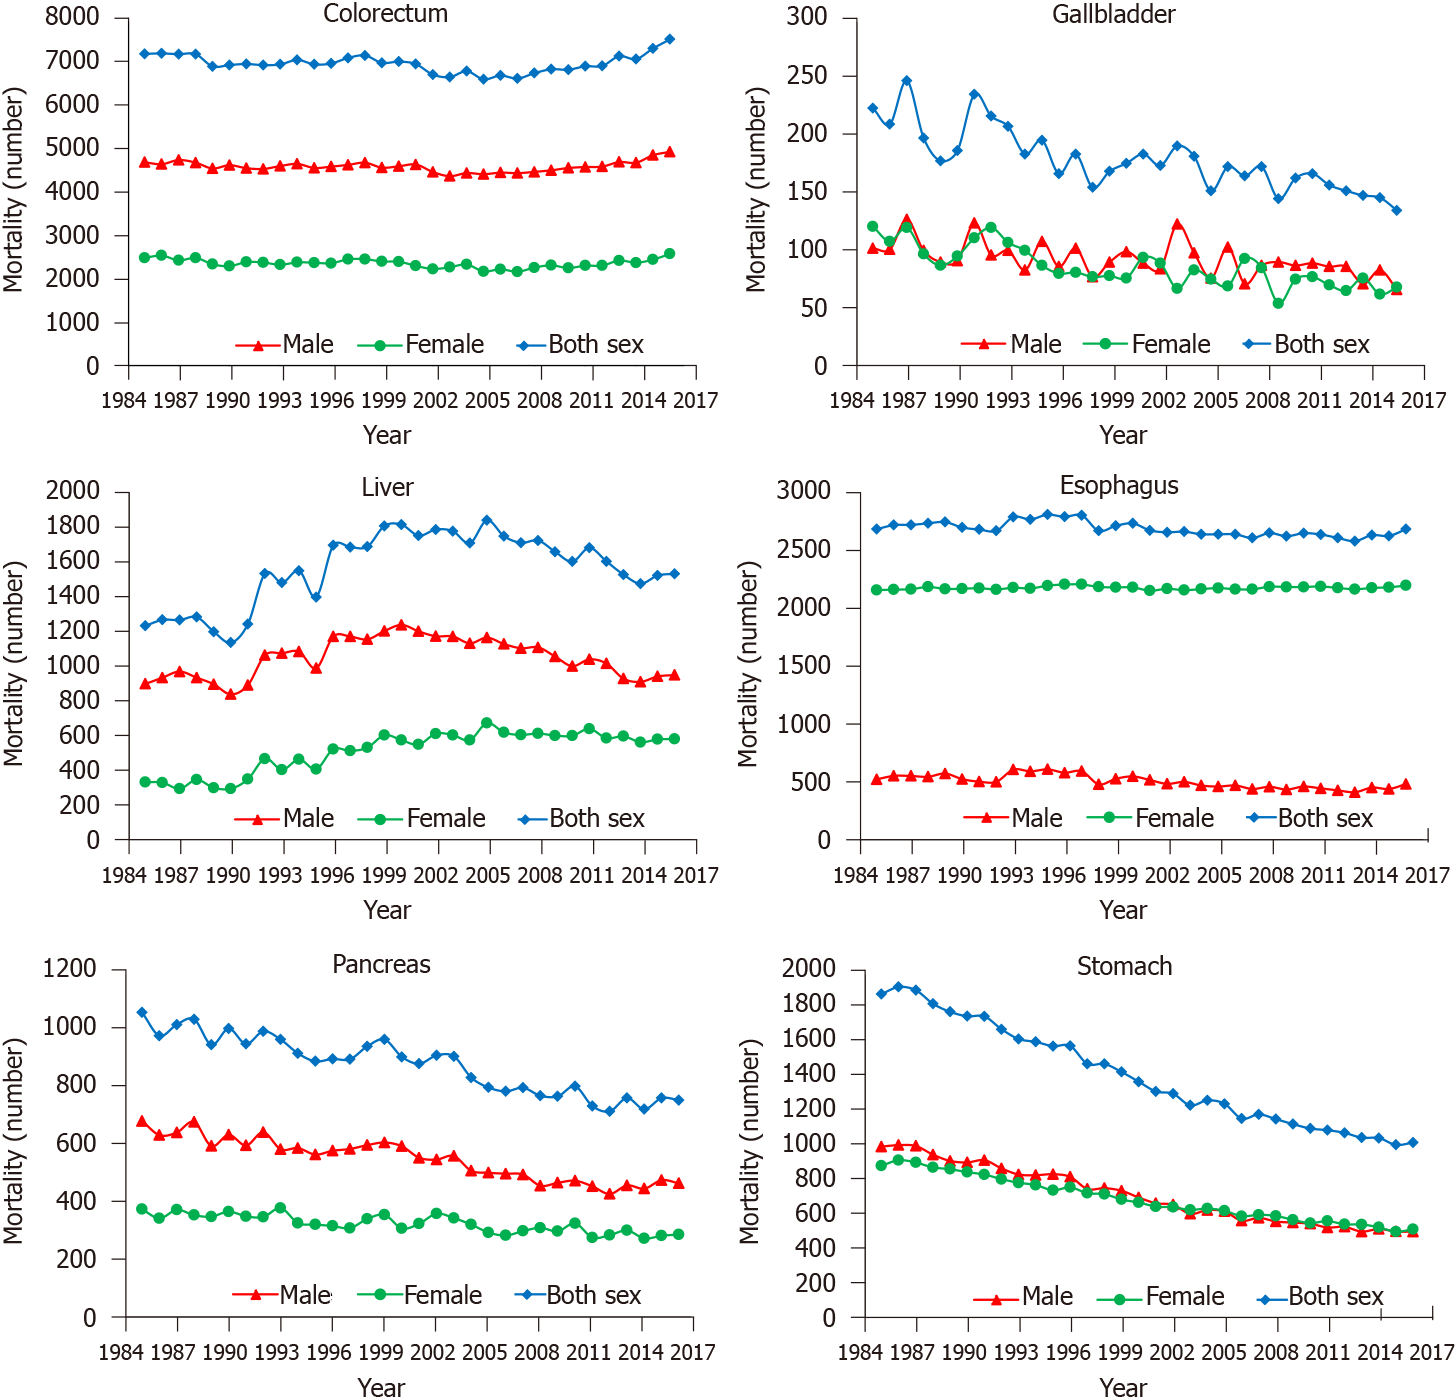
Figure 8 Time trends in deaths of six digestive cancers in young adults, both sexes, 1985-2016.
- Citation: Li J. Digestive cancer incidence and mortality among young adults worldwide in 2020: A population-based study. World J Gastrointest Oncol 2022; 14(1): 278-294
- URL: https://www.wjgnet.com/1948-5204/full/v14/i1/278.htm
- DOI: https://dx.doi.org/10.4251/wjgo.v14.i1.278


