Copyright
©The Author(s) 2021.
World J Gastrointest Oncol. Aug 15, 2021; 13(8): 929-942
Published online Aug 15, 2021. doi: 10.4251/wjgo.v13.i8.929
Published online Aug 15, 2021. doi: 10.4251/wjgo.v13.i8.929
Figure 1 Flow diagram showings study inclusion and exclusion criteria.
CT: Computed tomography; ICC: Intrahepatic cholangiocarcinoma.
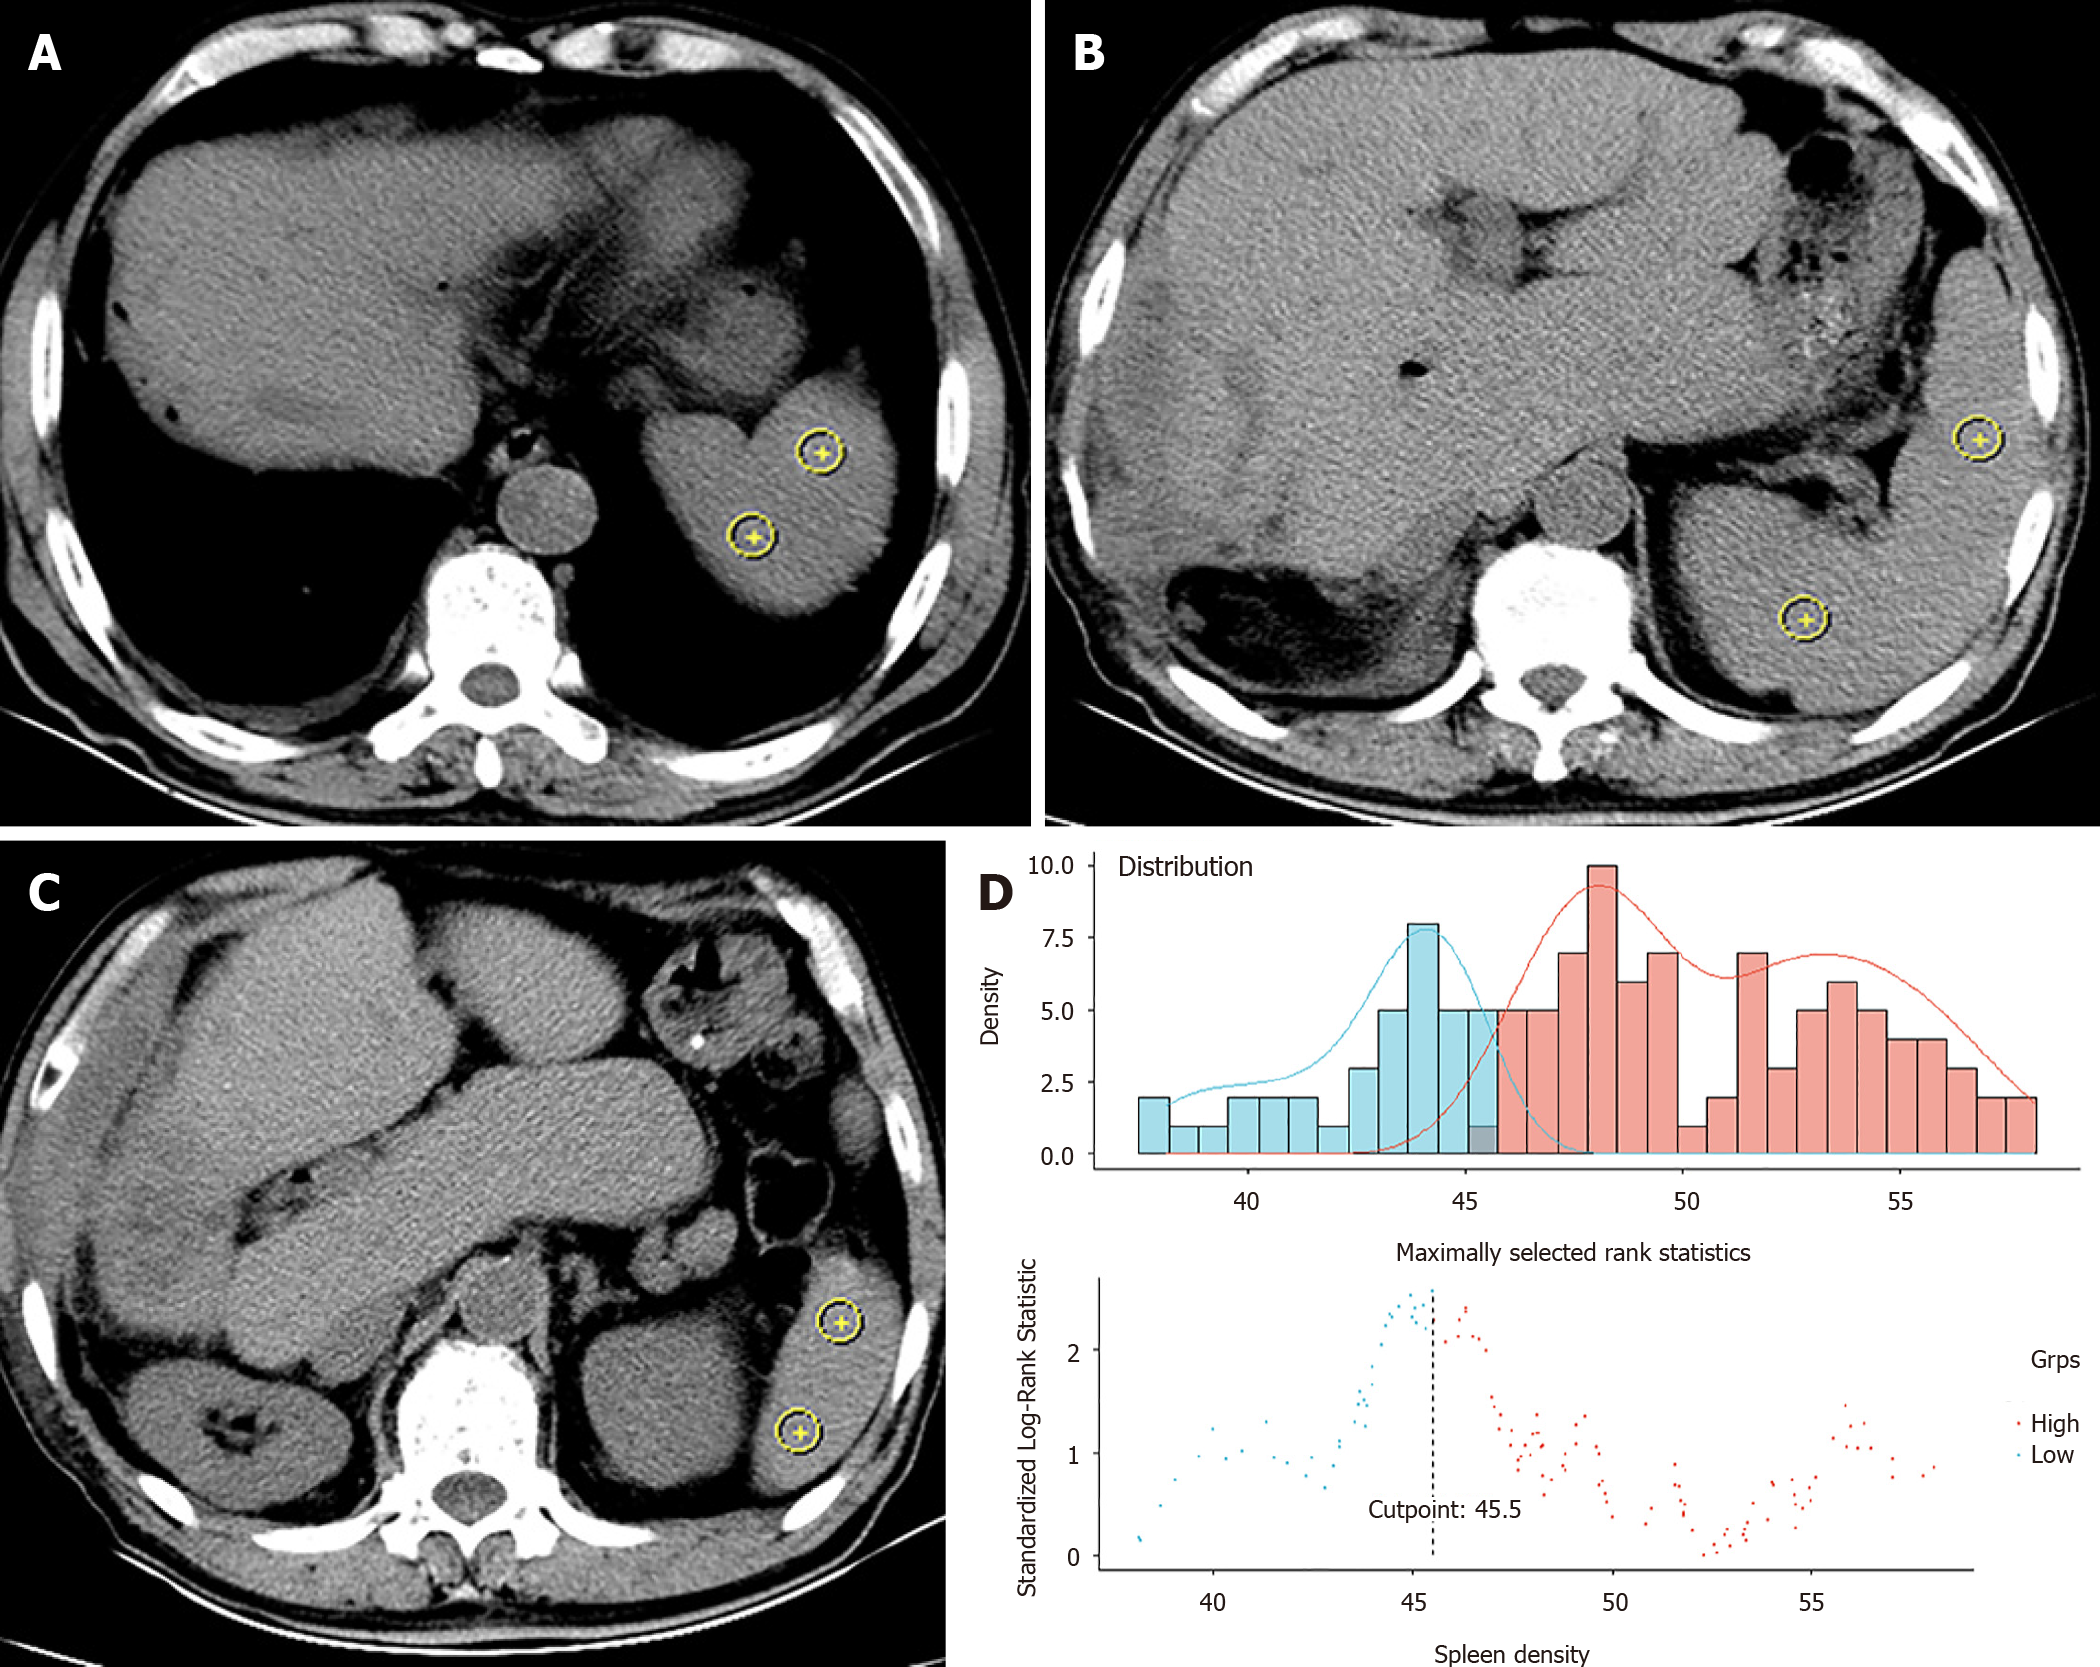
Figure 2 Spleen density of intrahepatic cholangiocarcinoma patients.
A-C: Mean spleen density at the upper pole level (A), hilum level (B), and inferior pole level (C) on computed tomography; D: Optimal cut-off level of spleen density that stratified patients into diffuse reduction of spleen density (DROSD) and non-DROSD subgroups was 45.5 Hounsfield units.
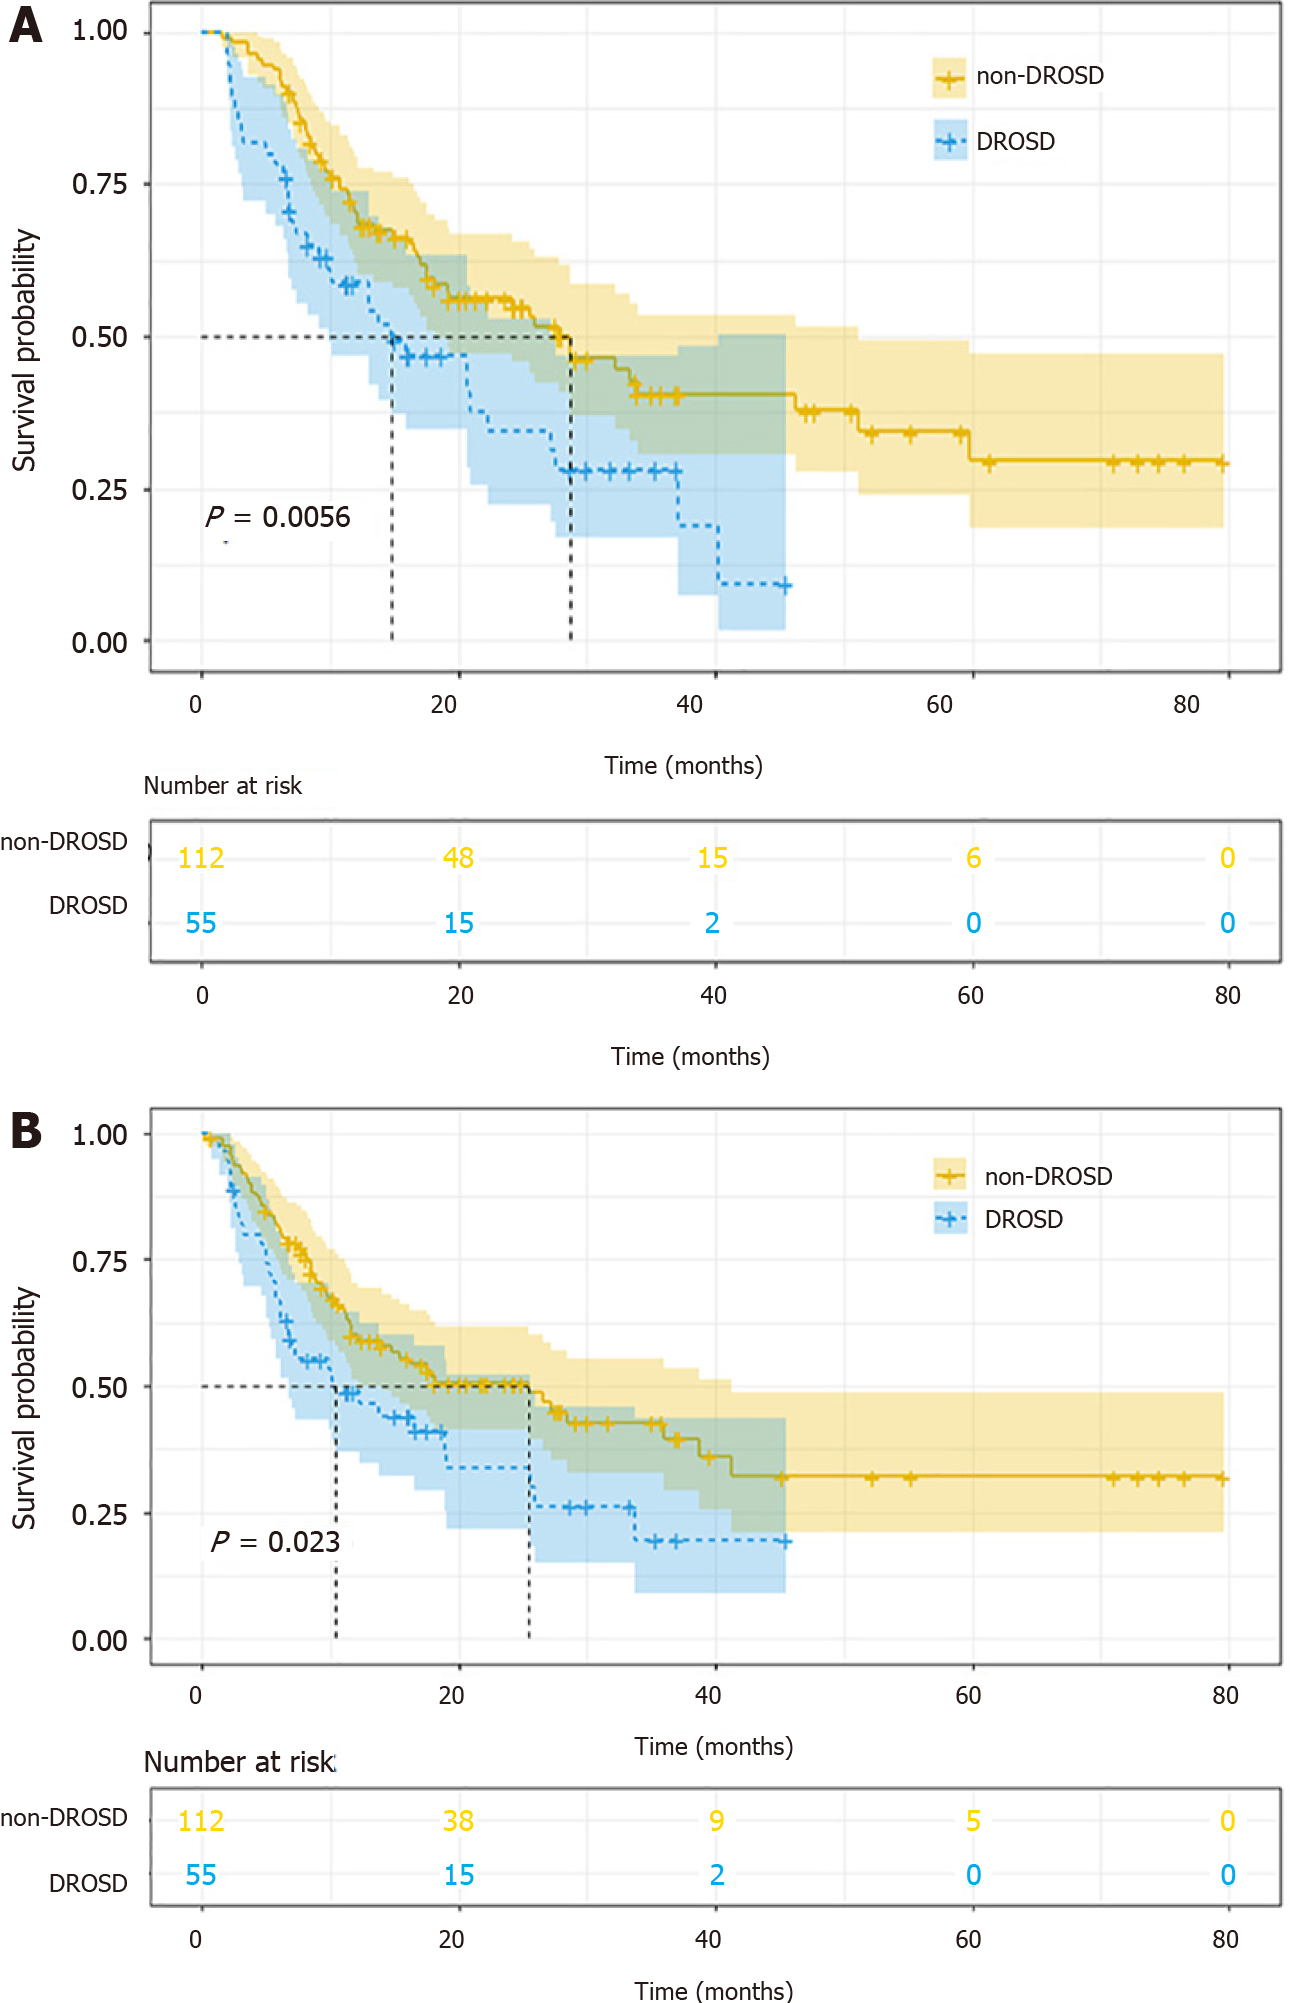
Figure 3 Kaplan–Meier curves of overall survival and recurrence-free survival comparisons between patients with and without diffuse reduction of spleen density in the cohort.
A: Overall survival; B: Recurrence-free survival. DROSD: Diffuse reduction of spleen density.
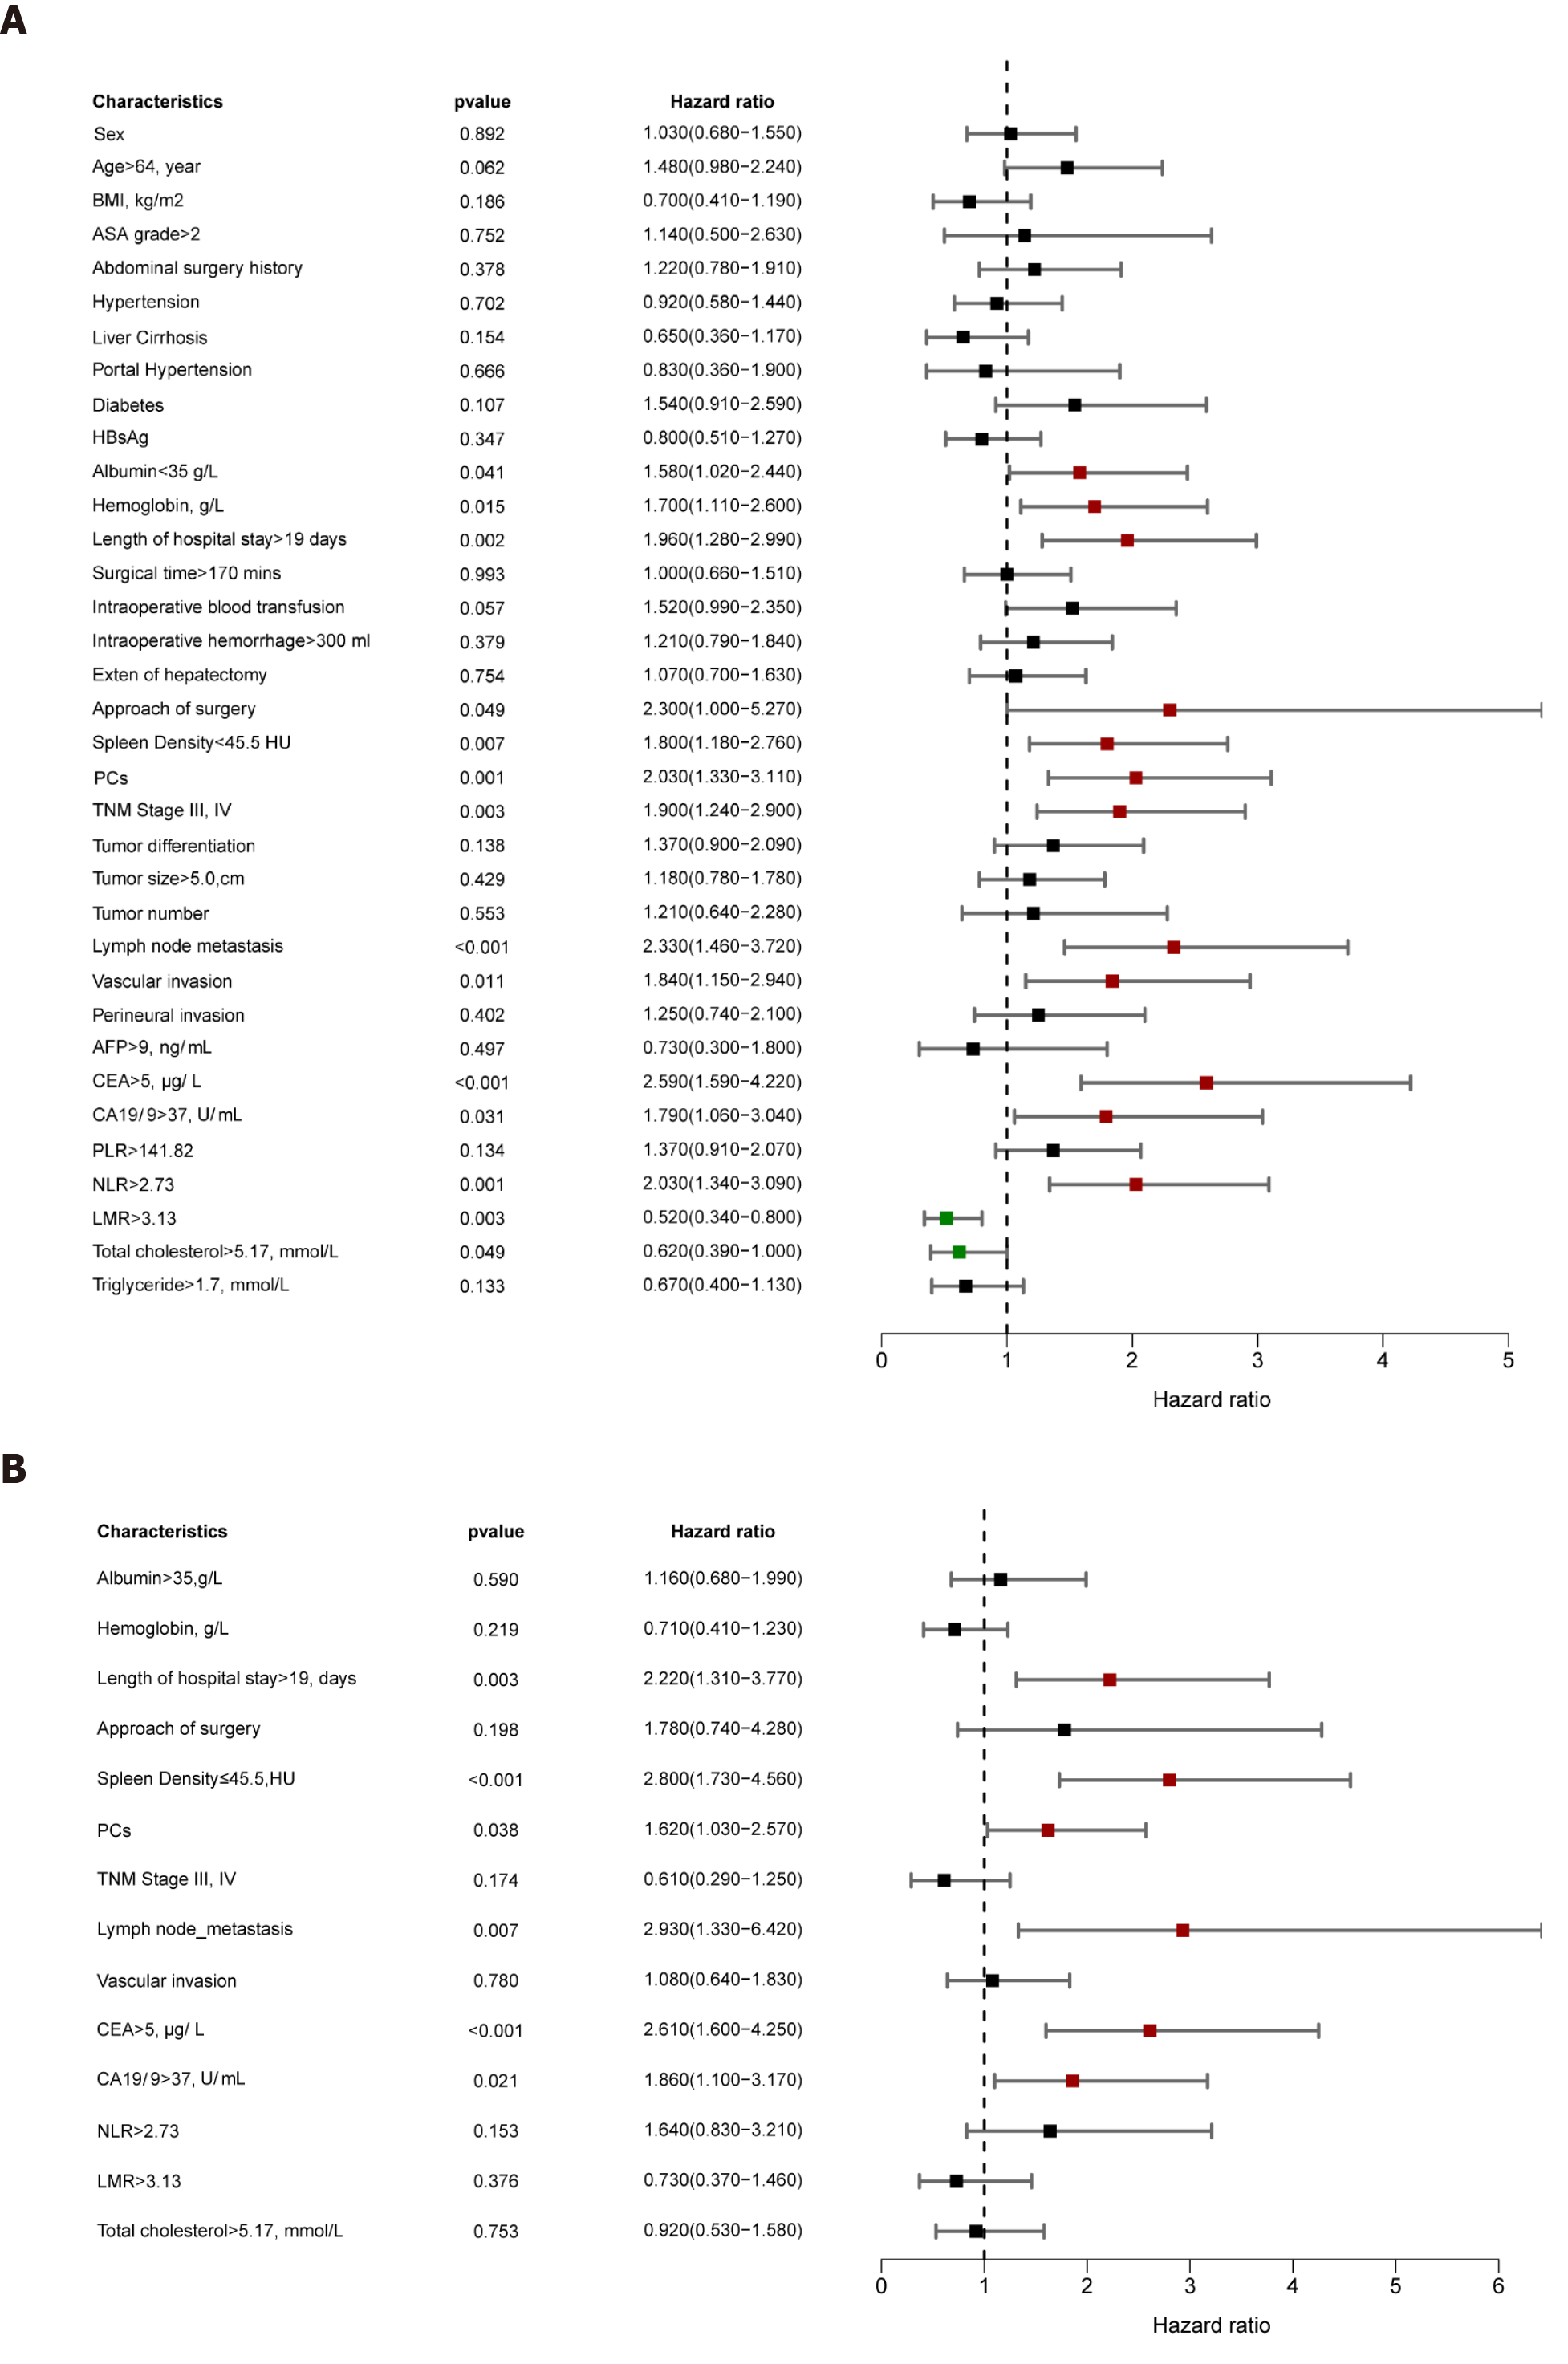
Figure 4 Forest plot for univariable and multivariable Cox regression analysis of overall survival.
A: Univariable analysis: the indicators marked in red and green are significant at P < 0.05 and then included in the multivariable analysis; B: Multivariable analyses: the indicators marked in red are significant at P < 0.05. AFP: Alpha-fetoprotein; ASA: American Society of Anesthesiologists grade score; BMI: Body mass index; CA19-9: Carbohydrate antigen 19-9; CEA: Carcinoembryonic antigen; CI: Confidence interval; DROSD: Diffuse reduction of spleen density; HR: Hazard ratio; LMR: Lymphocyte/monocyte ratio; NLR: Neutrophil/lymphocyte ratio; OS: Overall survival; PCs: Postoperative complications; PLR: Platelet/lymphocyte ratio.
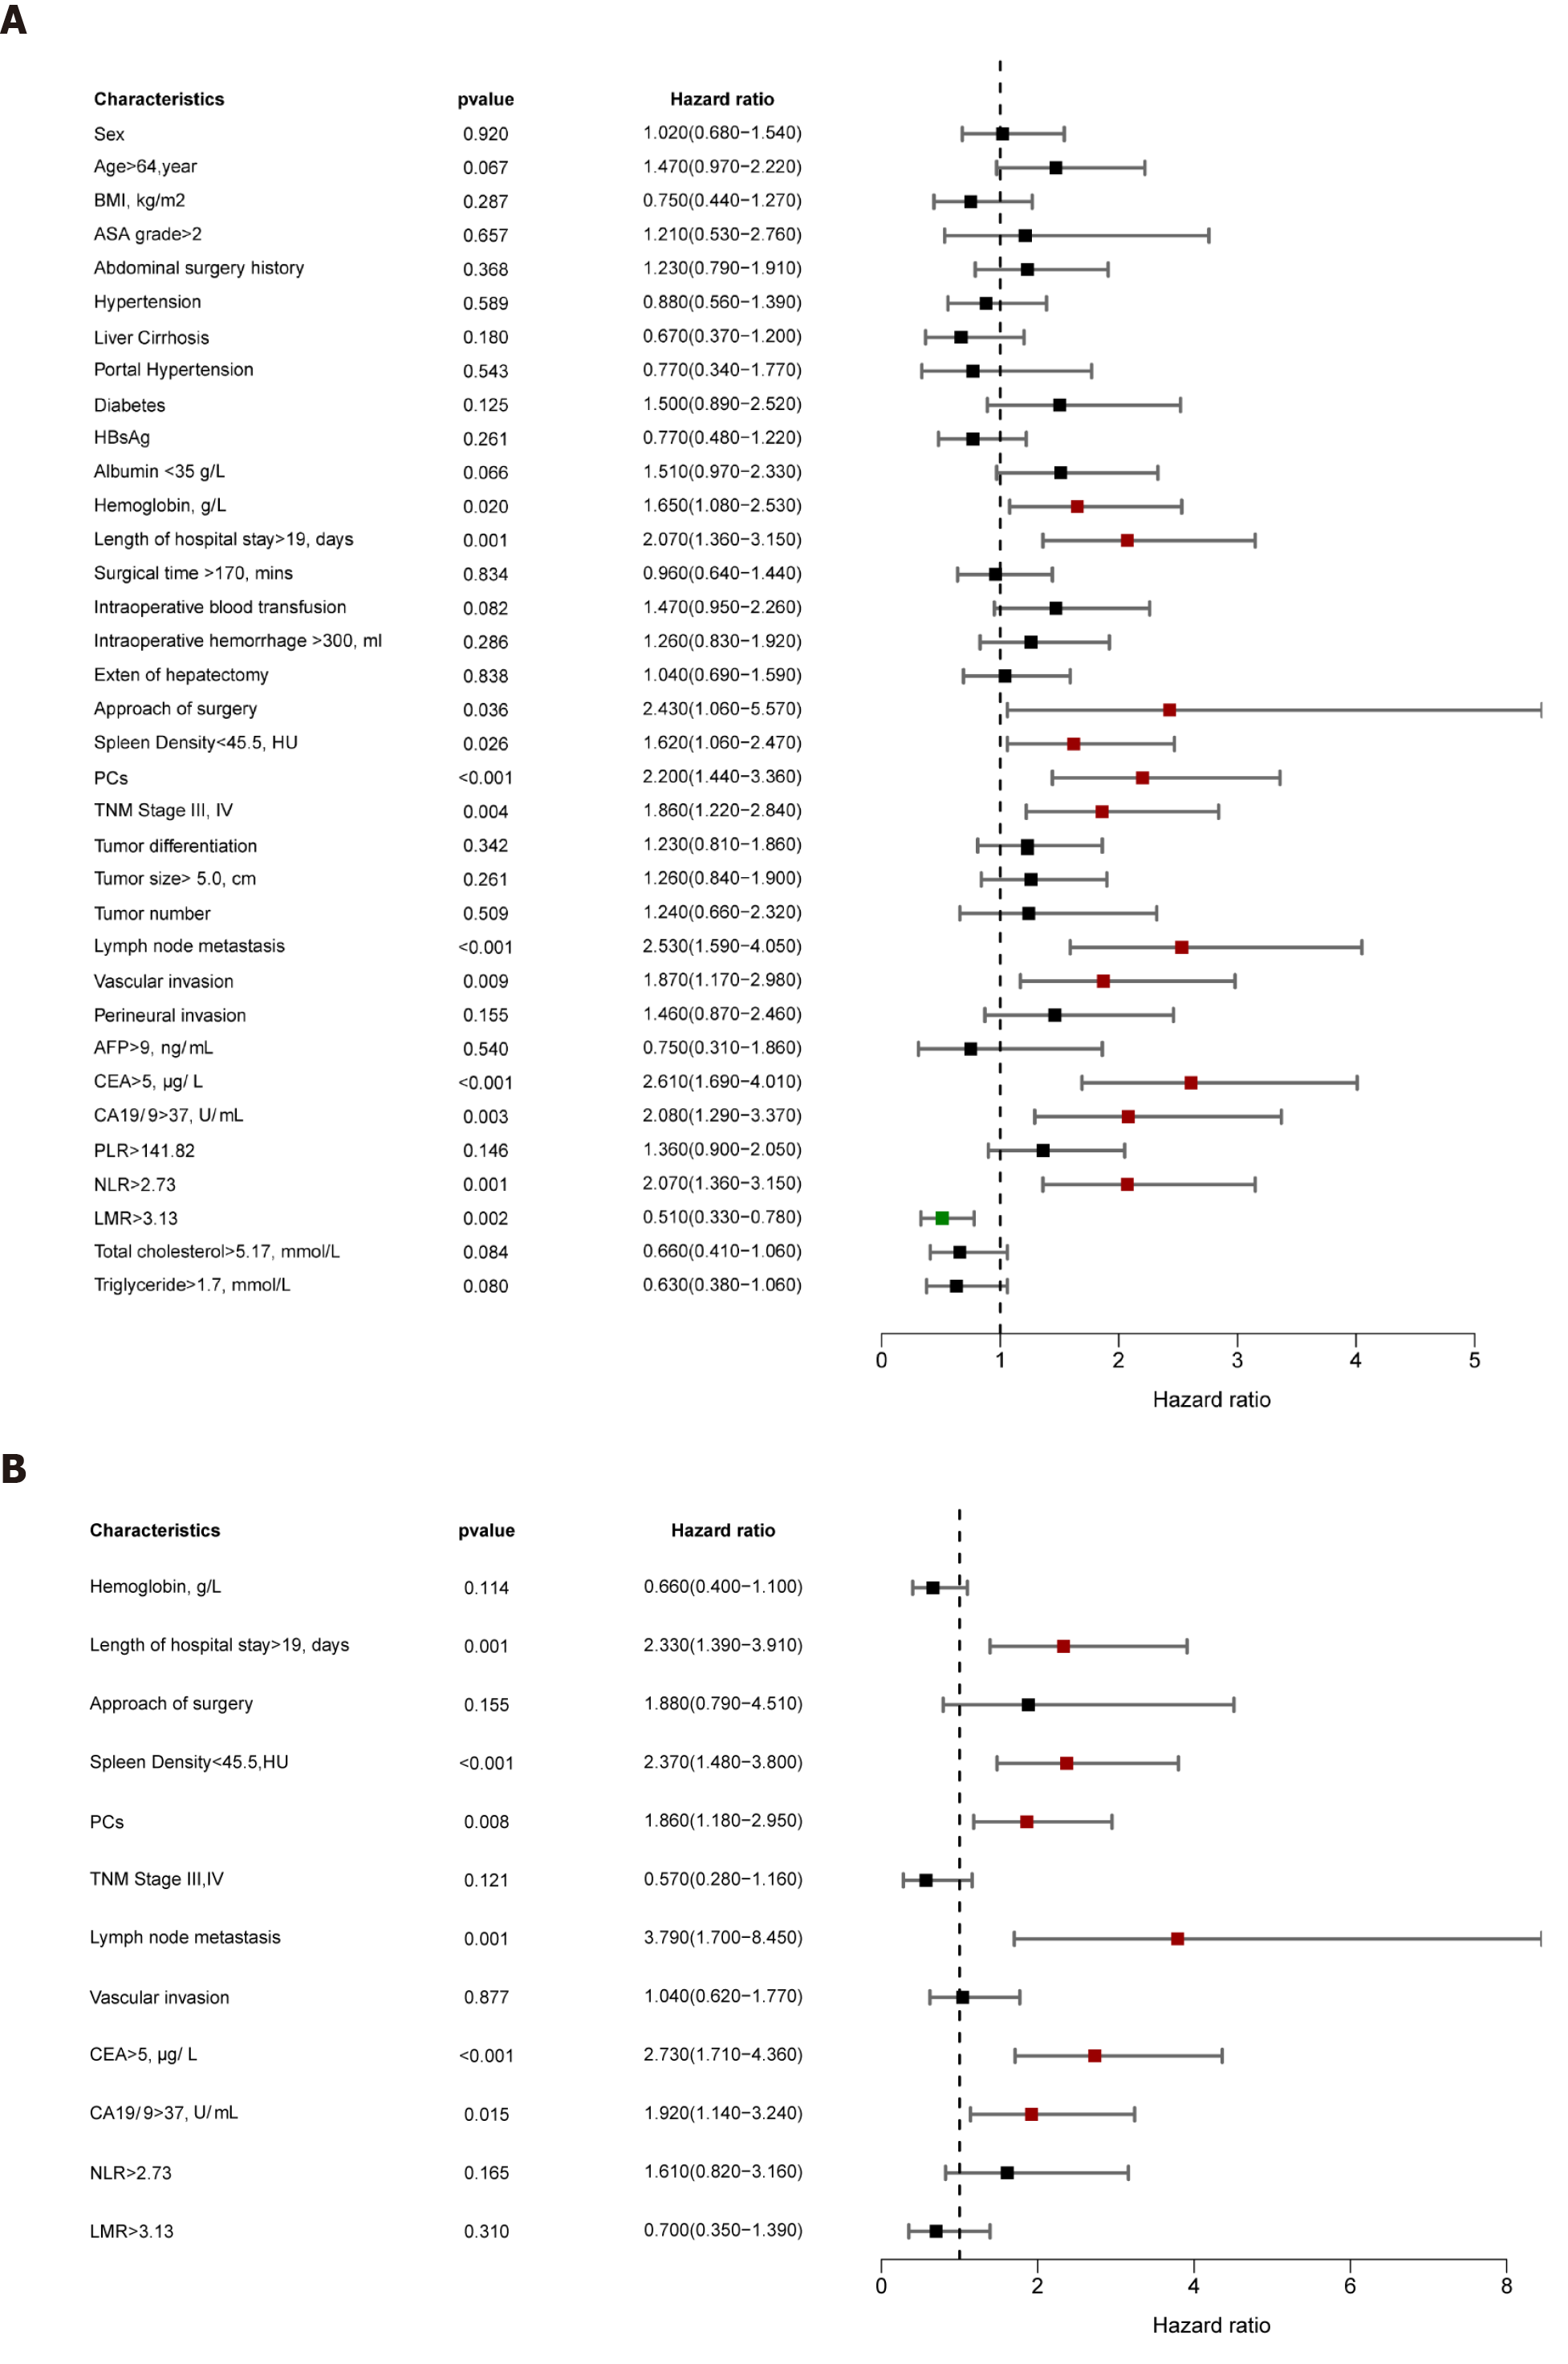
Figure 5 Forest plot for univariable and multivariable Cox regression analysis of recurrence-free survival.
A: Univariable analysis: the indicators marked in red and green are significant at P < 0.05 and then included in the multivariable analysis; B: Multivariable analysis: The indicators marked in red are significant at P < 0.05. AFP: Alpha-fetoprotein; ASA: American Society of Anesthesiologists grade score; BMI: Body mass index; CA19-9: Carbohydrate antigen 19-9; CEA: Carcinoembryonic antigen; CI: Confidence interval; DROSD: Diffuse reduction of spleen density; HR: Hazard ratio; LMR: Lymphocyte/monocyte ratio; NLR: Neutrophil/lymphocyte ratio; PCs: Postoperative complications; PLR: Platelet/lymphocyte ratio; RFS: Recurrence-free survival.
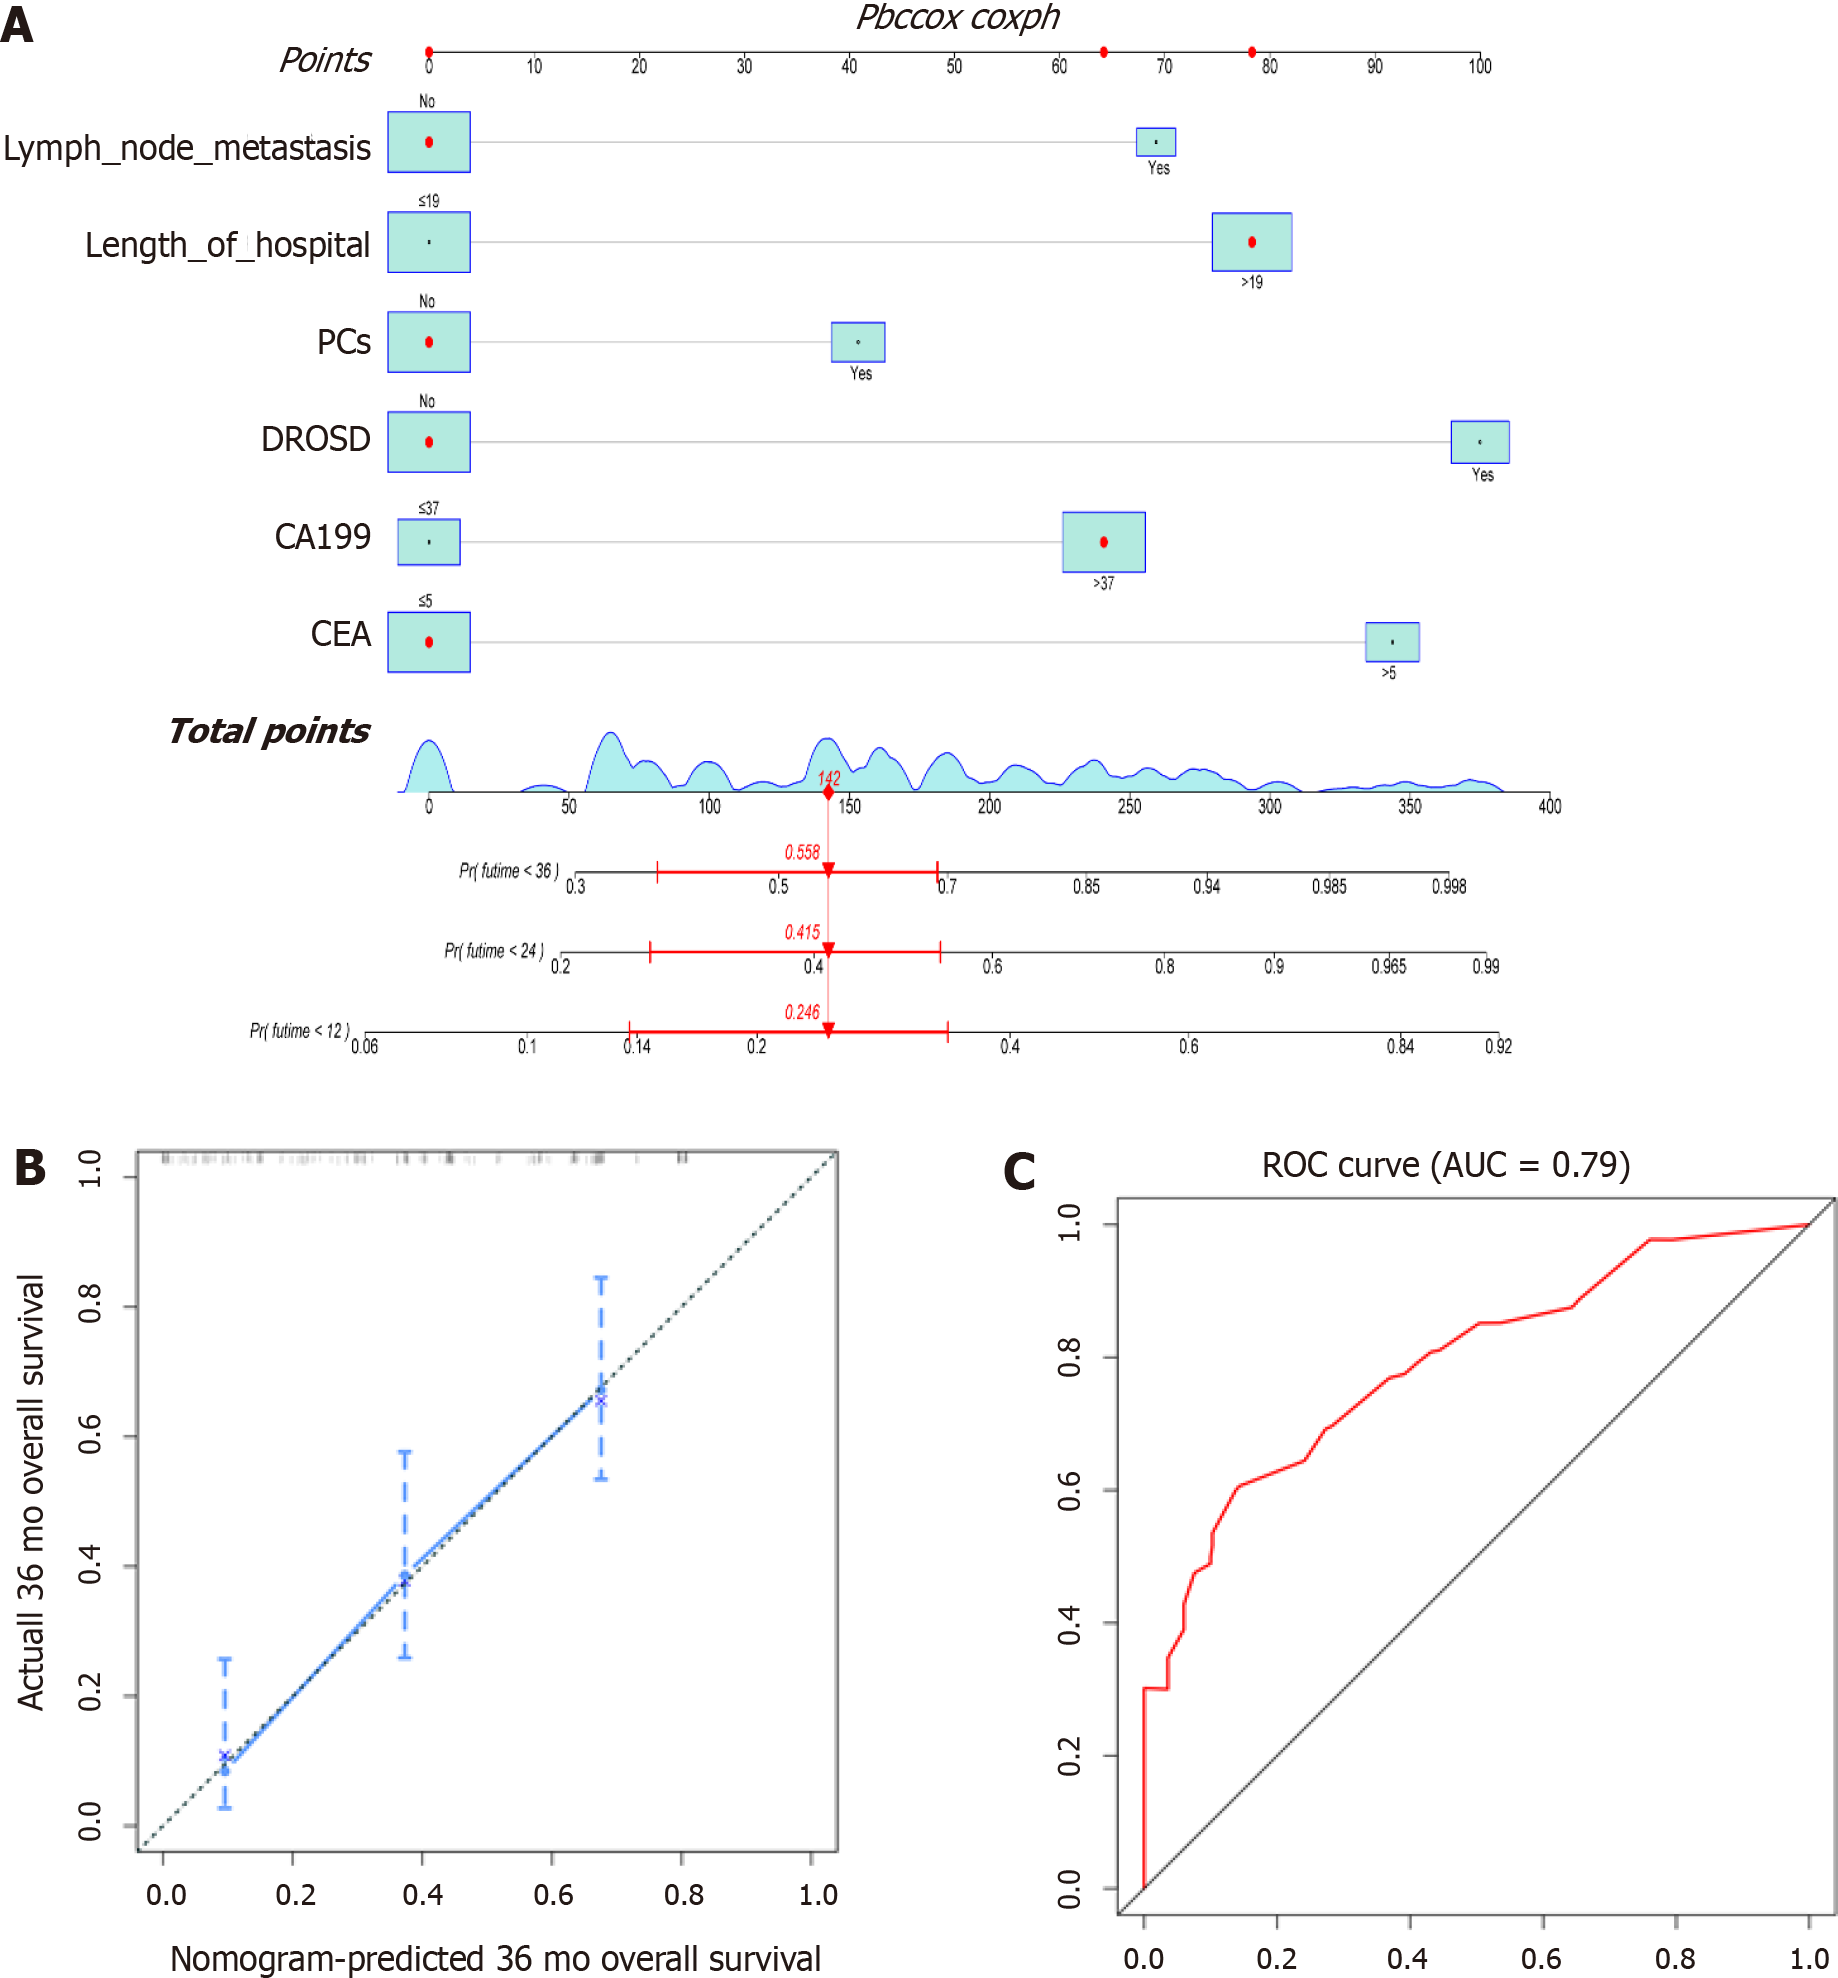
Figure 6 A nomogram predicts the overall survival of patients with intrahepatic cholangiocarcinoma.
A: The nomogram predicted 1-, 3- and 5-year overall survival (OS) for intrahepatic cholangiocarcinoma (ICC) patients; B: The calibration plots showed excellent agreement between observed outcomes and predicted survival probabilities; C: The area under the receiver operating characteristic curve of OS. CA19-9: Carbohydrate antigen 19-9; CEA: Carcinoembryonic antigen; PCs: Postoperative complications.
- Citation: Deng LM, Wang Y, Yang JH, Li JL, Chen ZY, Bao WM, Chen KY, Yao XF, Zheng CM, Zheng JY, Yu ZP, Jin B, Chen G. Diffuse reduction of spleen density is a novel prognostic marker for intrahepatic cholangiocarcinoma after curative resection. World J Gastrointest Oncol 2021; 13(8): 929-942
- URL: https://www.wjgnet.com/1948-5204/full/v13/i8/929.htm
- DOI: https://dx.doi.org/10.4251/wjgo.v13.i8.929


