Copyright
©The Author(s) 2021.
World J Gastrointest Oncol. Aug 15, 2021; 13(8): 893-914
Published online Aug 15, 2021. doi: 10.4251/wjgo.v13.i8.893
Published online Aug 15, 2021. doi: 10.4251/wjgo.v13.i8.893
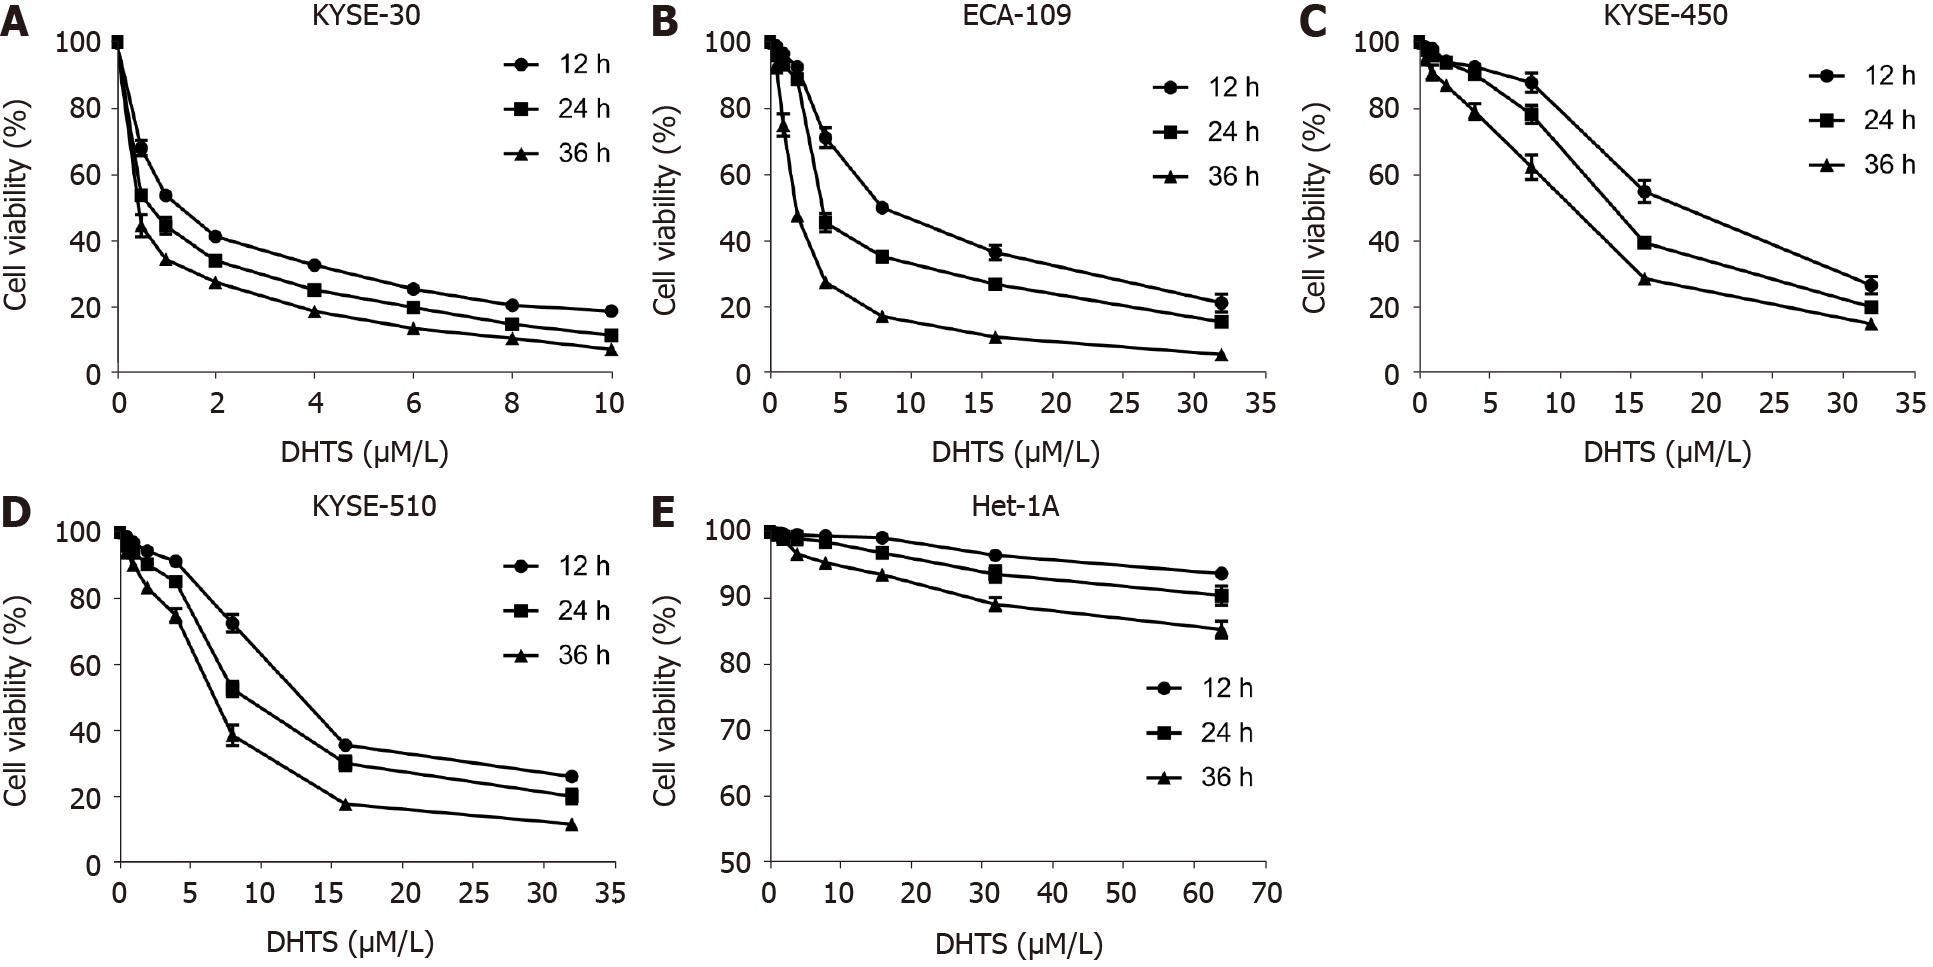
Figure 1 Dihydrotanshinone I inhibits proliferation of esophageal squamous cell carcinoma cells while showing no proliferation inhibi
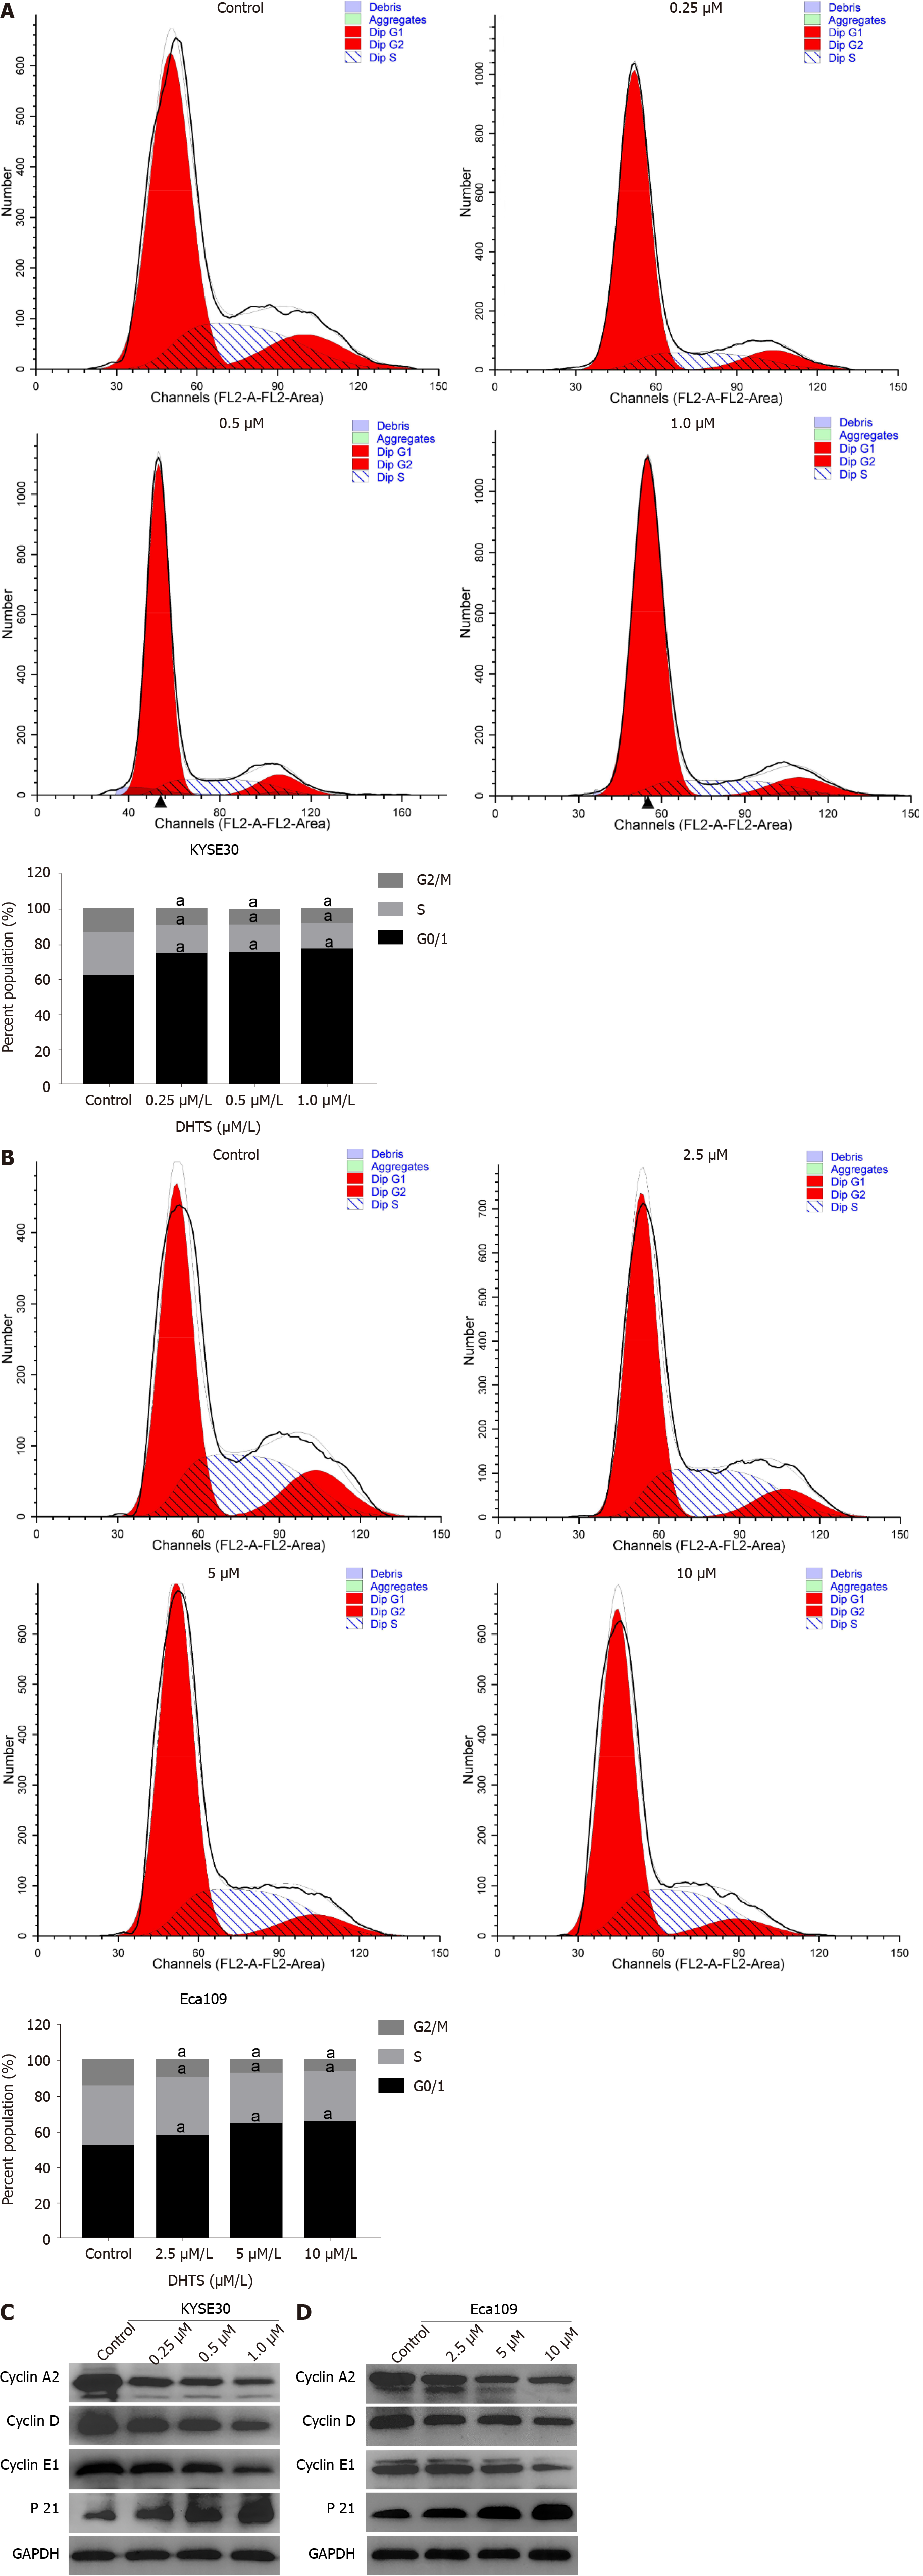
Figure 2 Dihydrotanshinone I induces cell cycle arrest in the G0/1 phase in esophageal squamous cell carcinoma cells.
A and B: Cell cycle distribution after treatment with DHTS for 24 h in KYSE30 cells and Eca109 cells; C and D: Western blot analysis of proteins associated with the cell cycle in KYSE30 cells and Eca109 cells. aP < 0.05 vs control. DHTS: Dihydrotanshinone I.
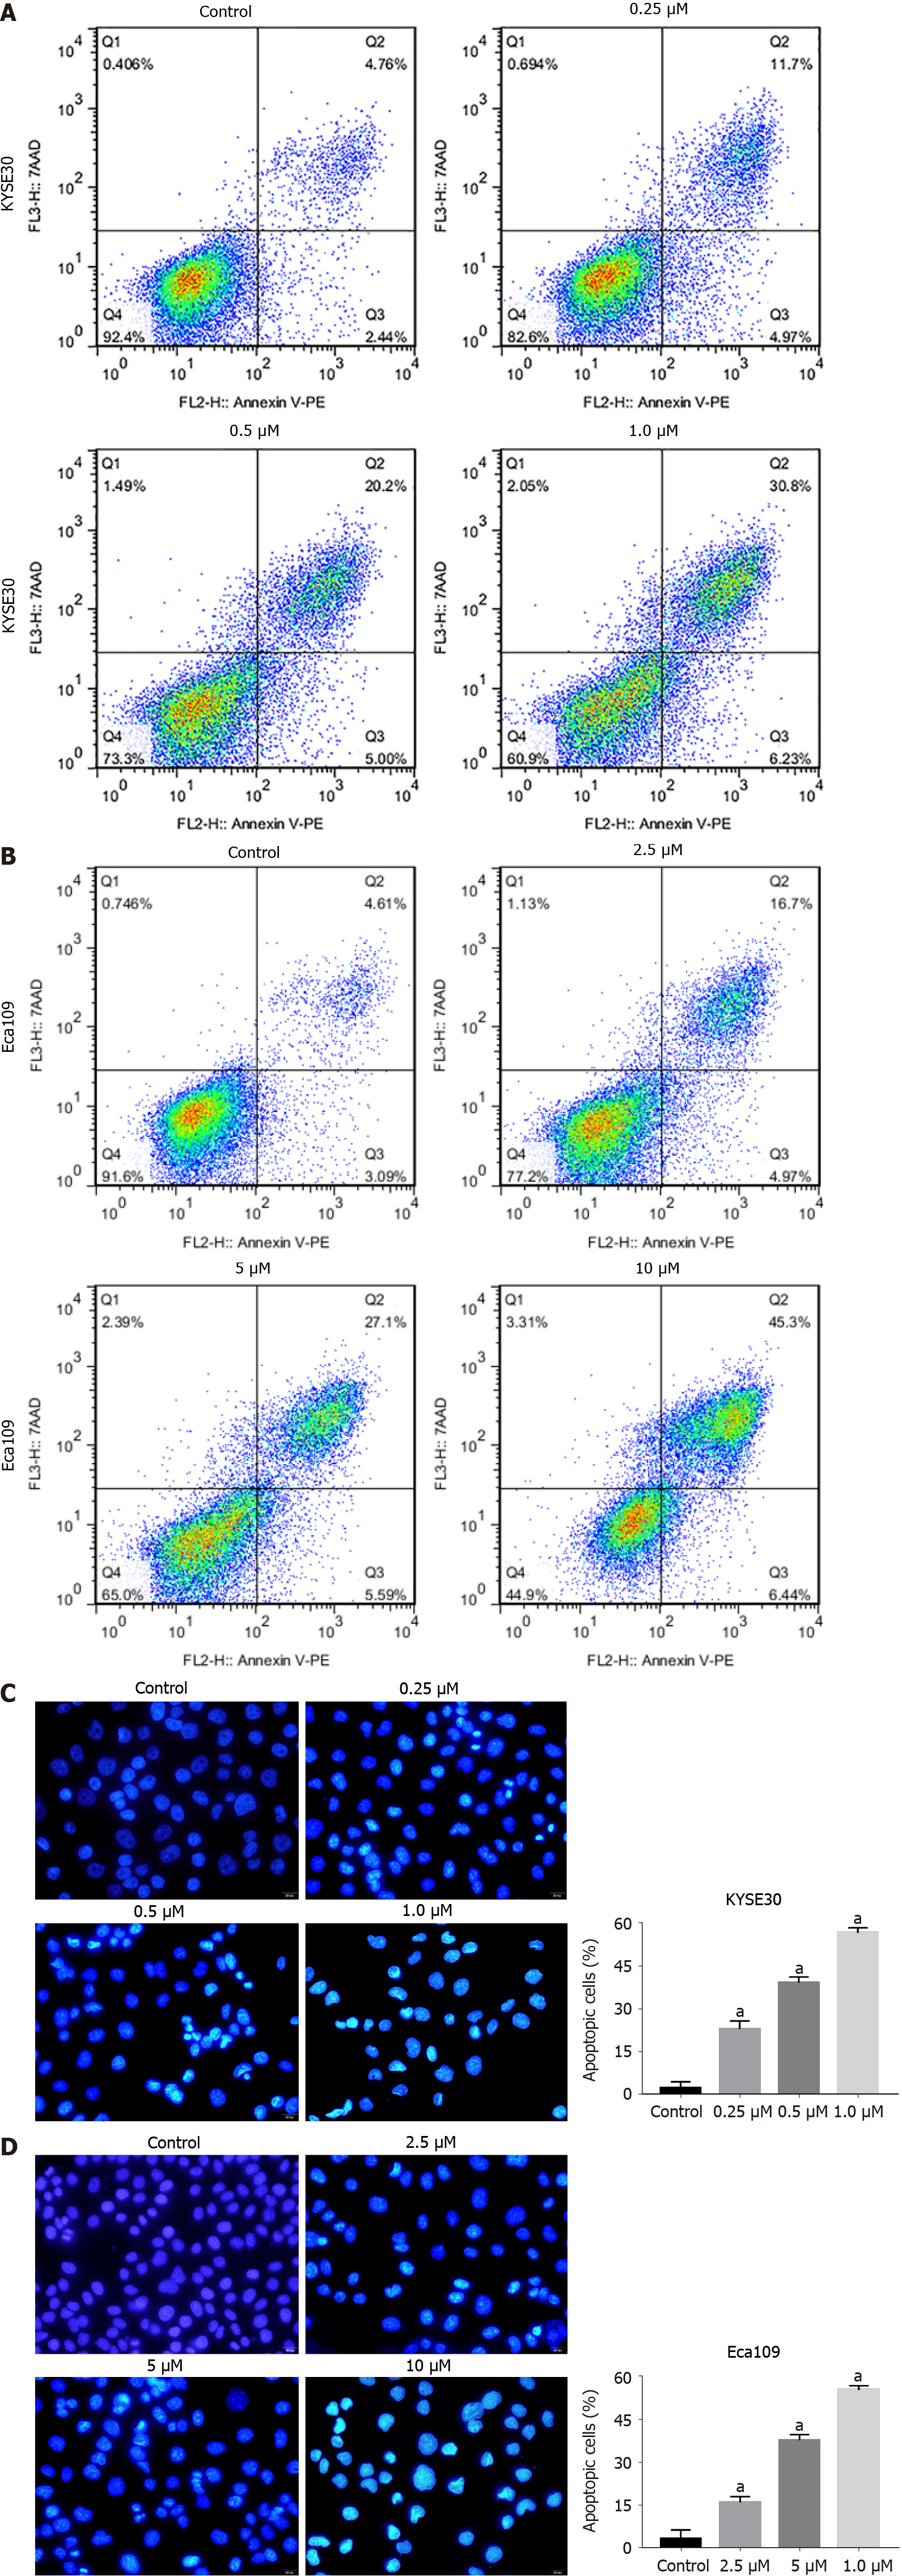
Figure 3 Dihydrotanshinone I induces apoptosis in esophageal squamous cell carcinoma cells.
A and B: Cell apoptosis analyzed using flow cytometry with annexin V-PE/7-ADD double staining in KYSE30 cells and Eca109 cells; C and D: Apoptosis-related morphologic changes in the cells detected using Hoechst 33258 staining in KYSE30 cells and Eca109 cells. aP < 0.05 vs control.
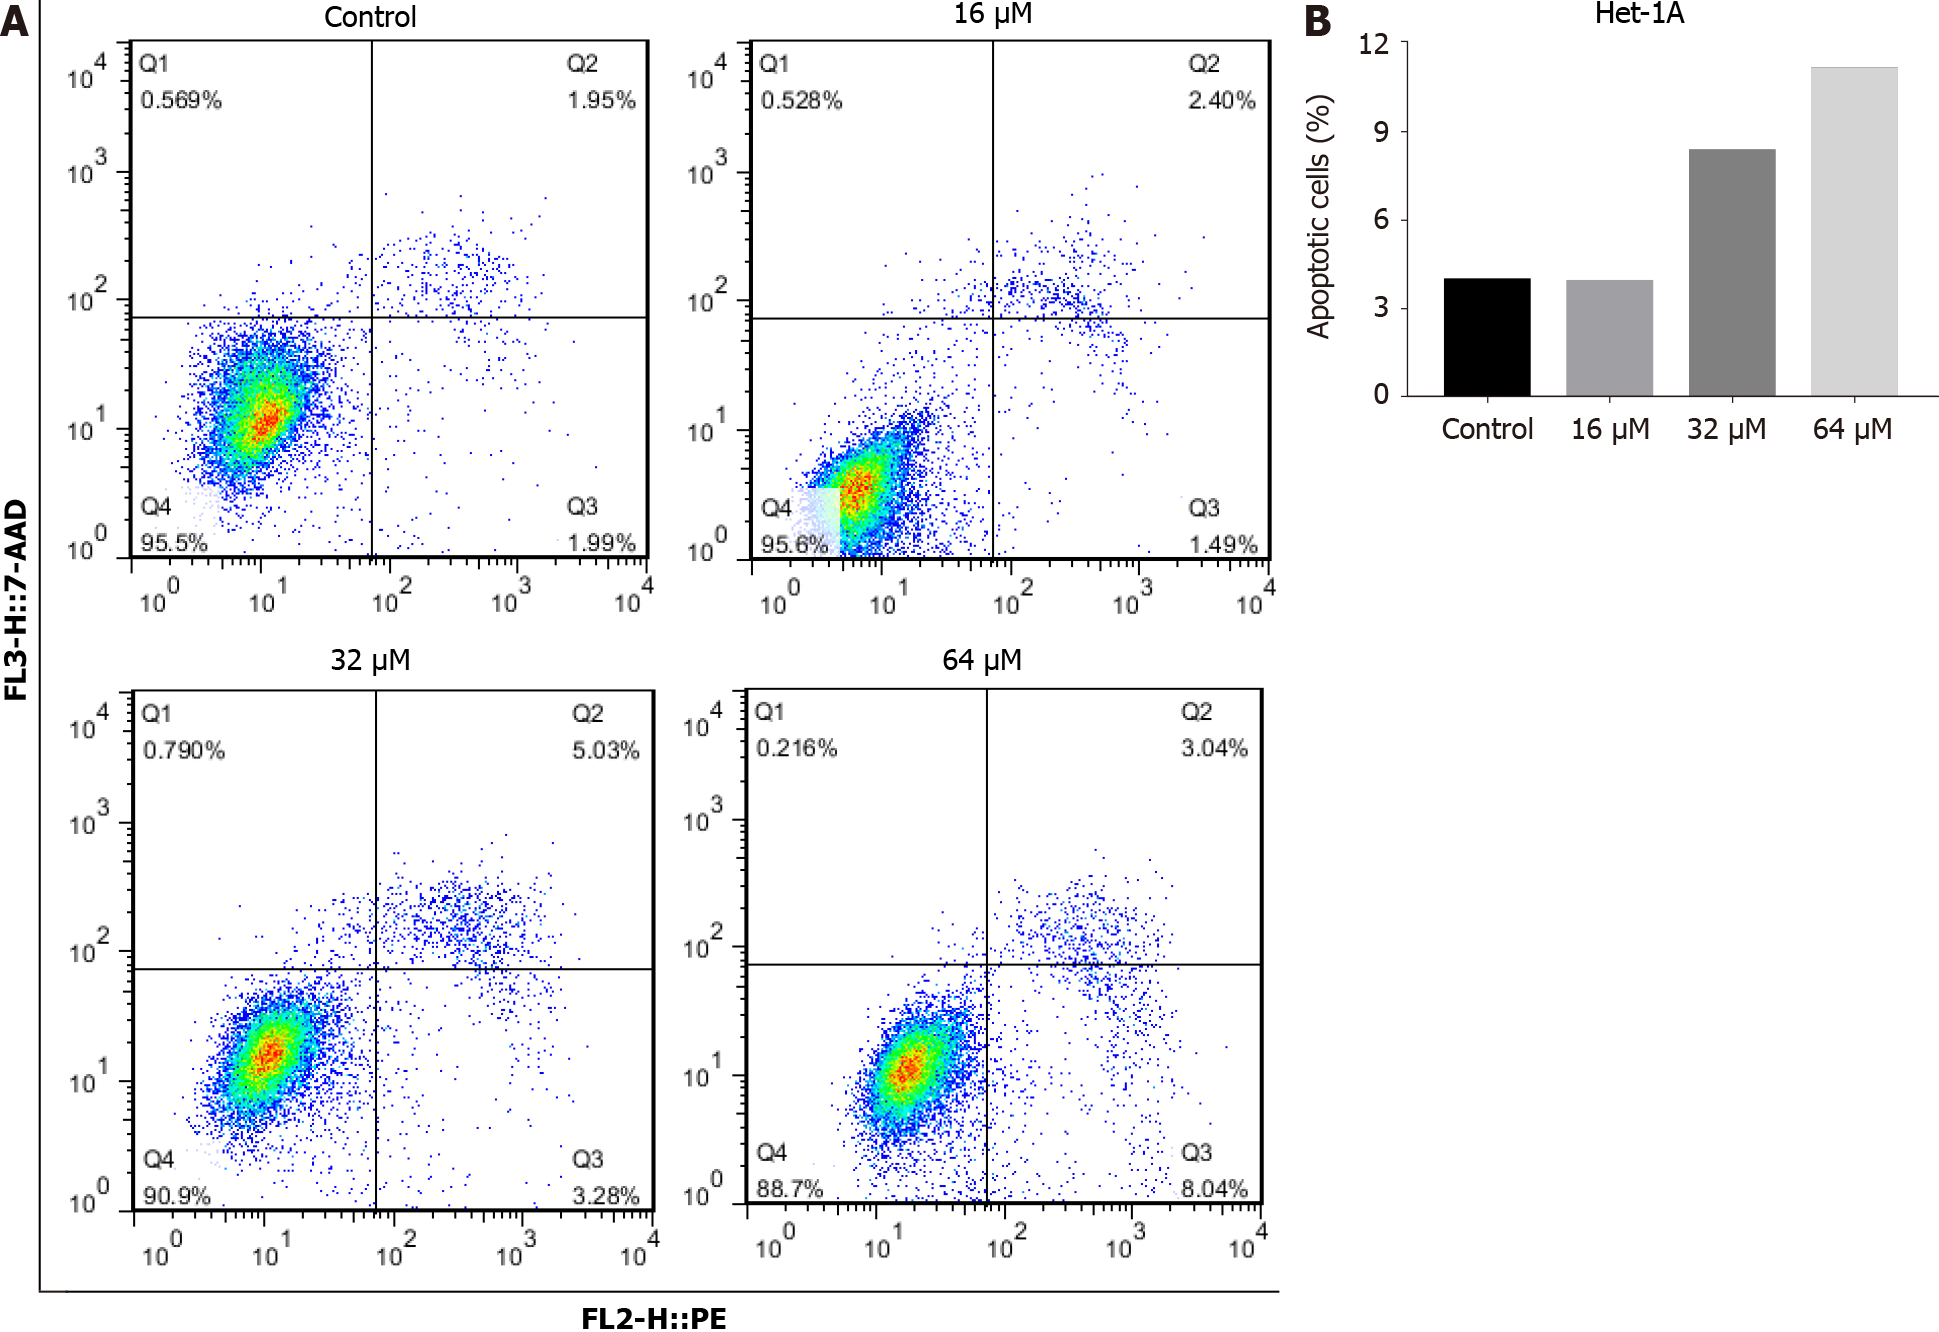
Figure 4 Dihydrotanshinone I does not induce apoptosis significantly in normal esophageal epithelial cells.
A and B: Cell apoptosis analyzed using flow cytometry with annexin V-PE/7-ADD double staining in Het-1A cells. aP < 0.05 vs control.
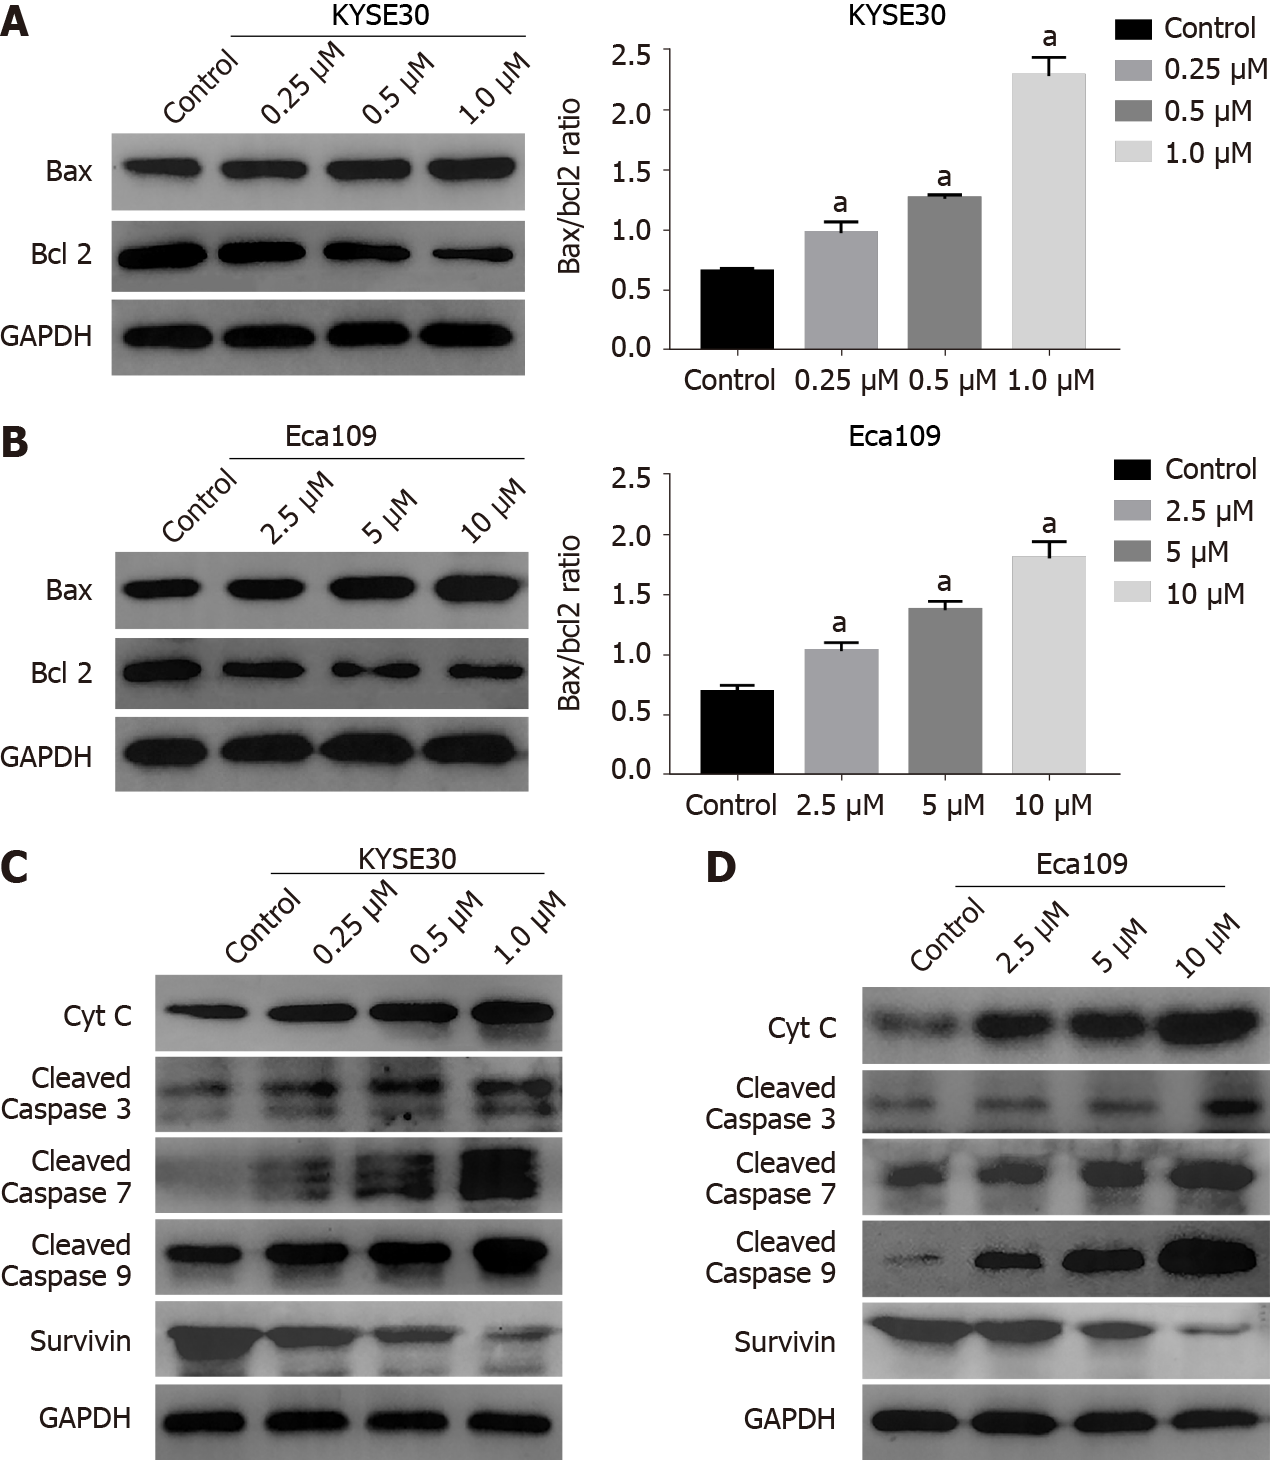
Figure 5 Dihydrotanshinone I activates the mitochondrial pathway in esophageal squamous cell carcinoma cells.
A and B: Bax and Bcl2 levels detected using Western blot and the ratio of Bax and Bcl2 calculated in KYSE30 cells and Eca109 cells; C and D: Proteins associated with the mitochondrial pathway detected using Western blot in KYSE30 cells and Eca109 cells. aP < 0.05 vs control.
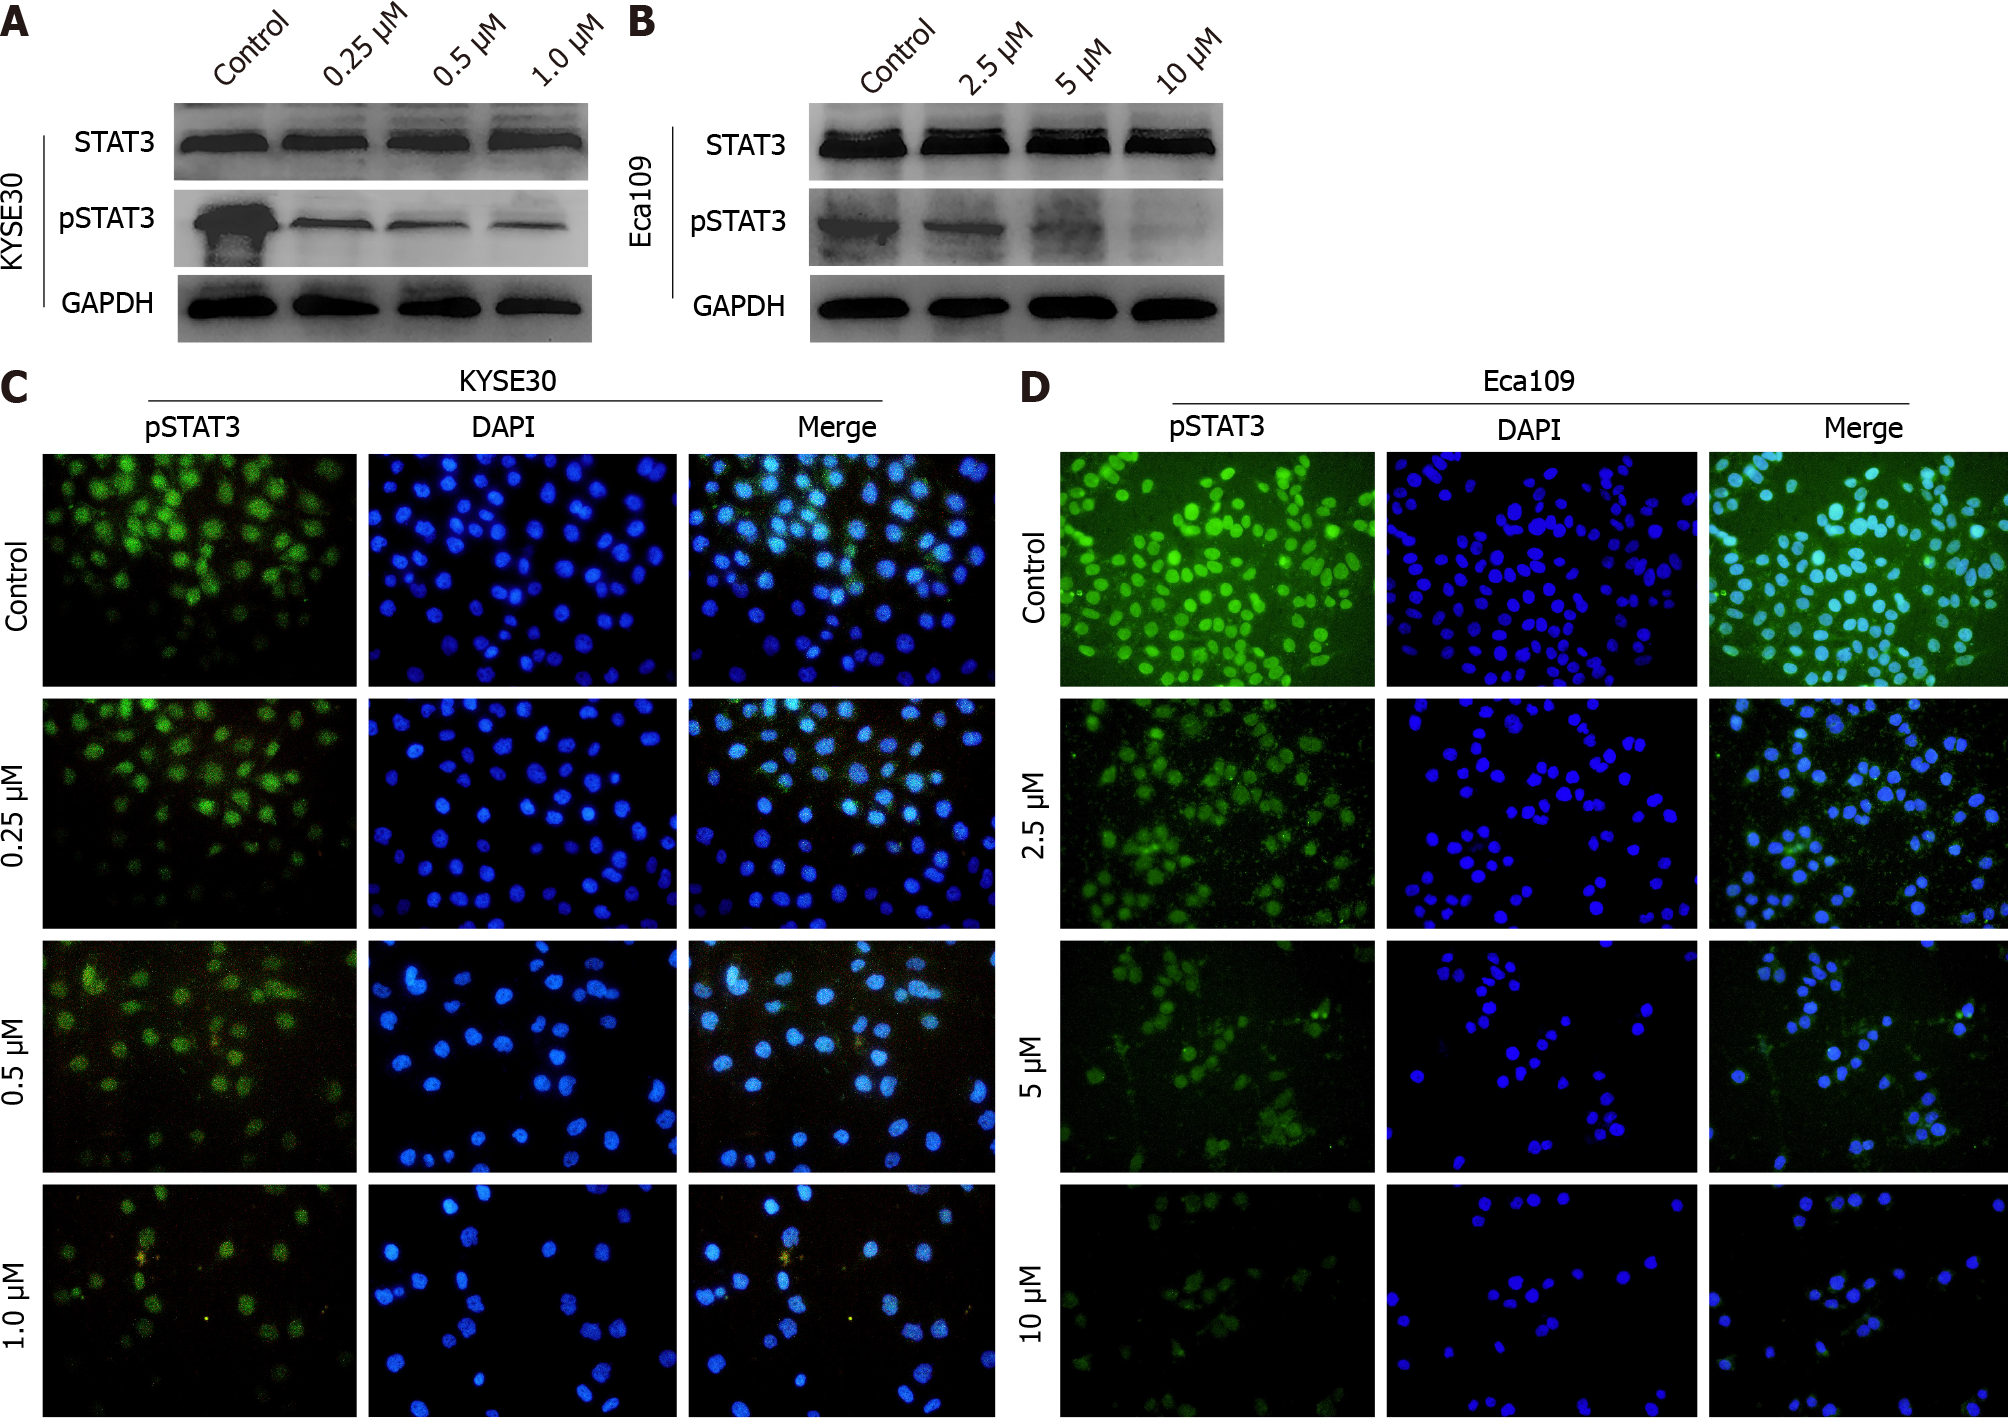
Figure 6 Dihydrotanshinone I inhibits the expression of phosphorylated STAT3 in esophageal squamous cell carcinoma cells.
A and B: Levels of STAT3 and pSTAT3 detected using Western blot in KYSE30 cells and Eca109 cells; C and D: Expression and location of phosphorylated STAT3 detected by immunofluorescence in KYSE30 cells and Eca109 cells. pSTAT3: Phosphorylated STAT3.
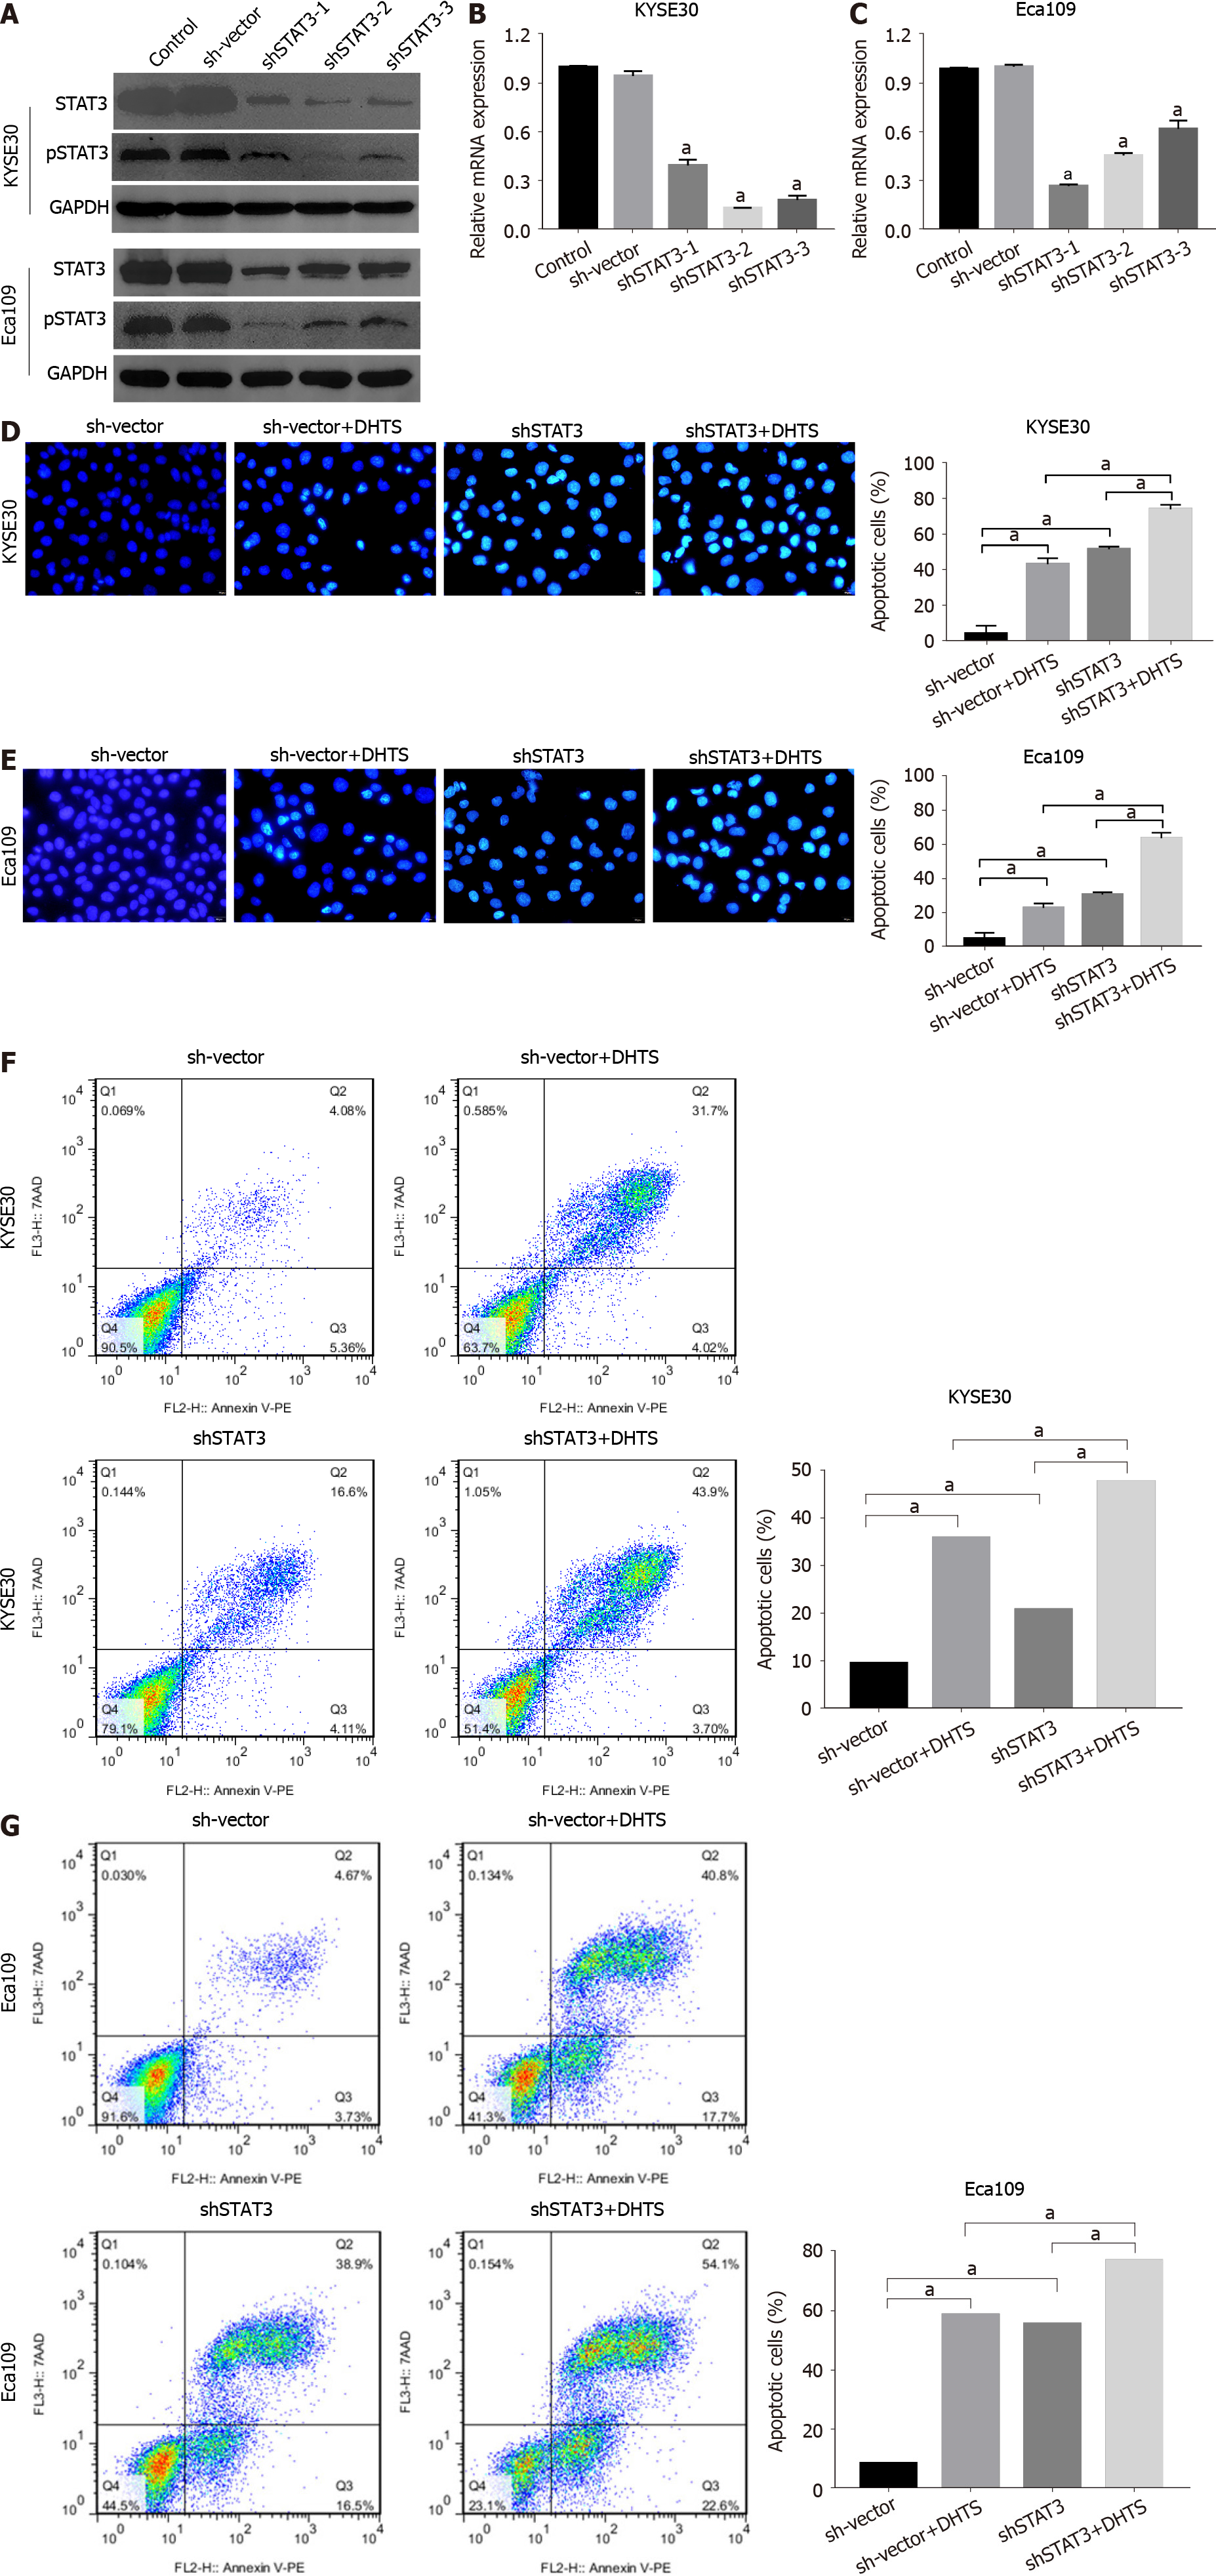
Figure 7 STAT3 knockdown promotes dihydrotanshinone I-induced apoptosis in esophageal squamous cell carcinoma cells.
A: Knockdown efficiency of STAT3 and phosphorylated STAT3 identified using Western blot in esophageal squamous cell carcinoma cells; B and C: Knockdown efficiency of STAT3 identified using RT-qPCR in KYSE30 cells and Eca109 cells; D: Apoptosis-related morphological changes in STAT3 knockdown cells detected using Hoechst 33258 staining in KYSE30/sh-vector and KYSE30/shSTAT3 cells treated with 0.5 μmol/L DHTS; E: Apoptosis-related morphologic changes detected using Hoechst 33258 staining in Eca109/sh-vector and Eca109/shSTAT3 cells treated with 5 μmol/L DHTS; F: Cell apoptosis analyzed using flow cytometry with annexin V-PE/7-ADD double staining in KYSE30/sh-vector and KYSE30/shSTAT3 cells treated with 0.5 μmol/L DHTS; G: Cell apoptosis analyzed using flow cytometry with annexin V-PE/7-ADD double staining in Eca109/sh-vector and Eca109/shSTAT3 cells treated with 5 μmol/L. aP < 0.05.
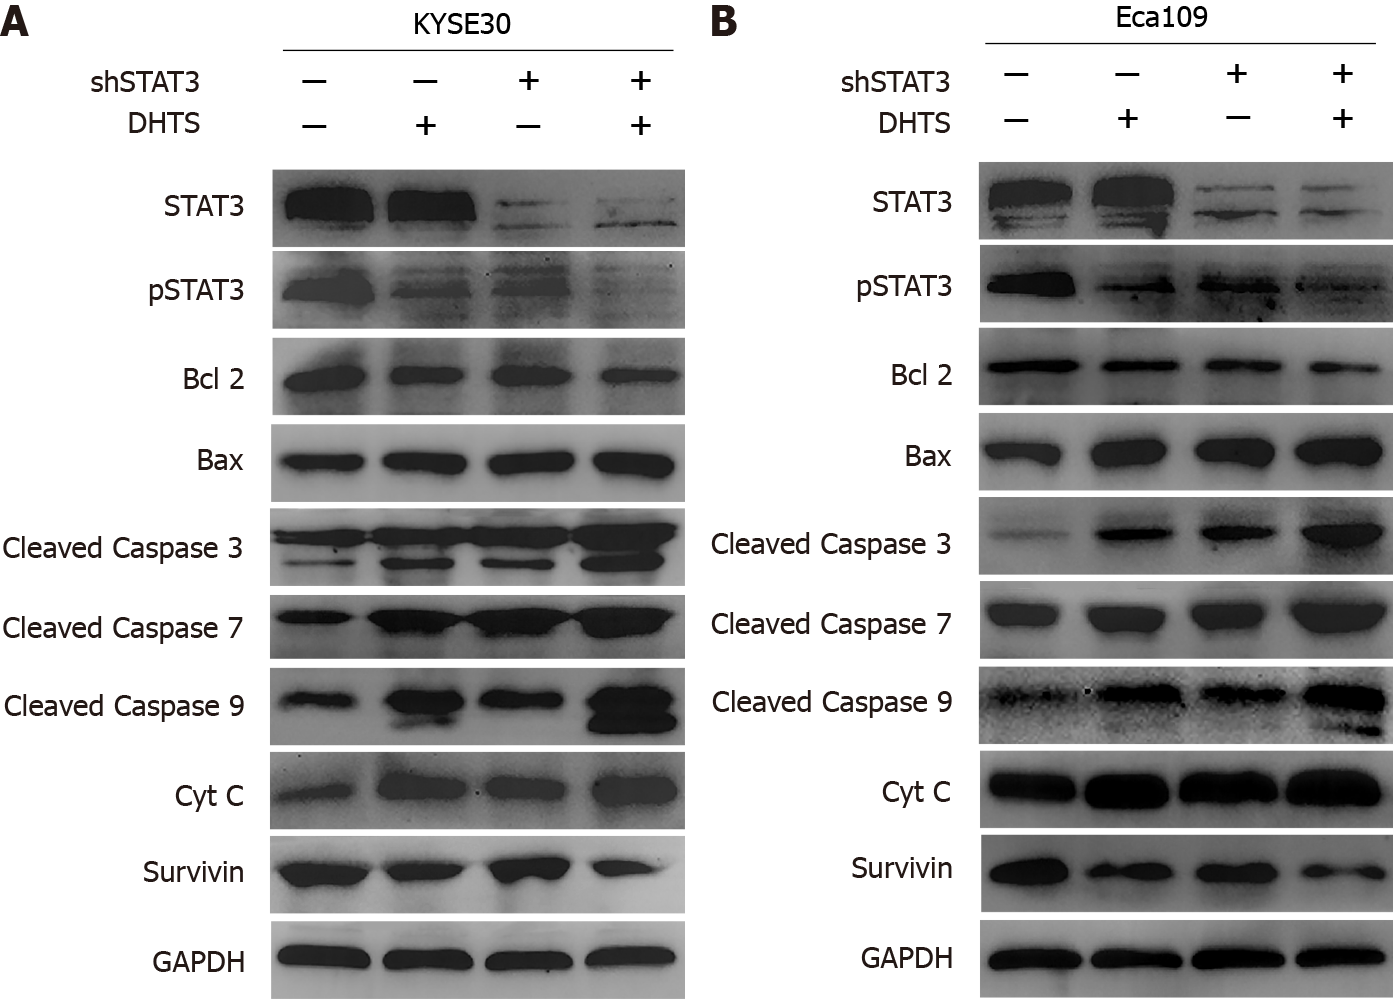
Figure 8 STAT3 knockdown synergizes with dihydrotanshinone I in the activation of the mitochondrial pathway in esophageal squamous cell carcinoma cells.
A: KYSE30/sh-vector and KYSE30/shSTAT3 cells were treated with 0.5 μmol/L DHTS, and Western blot was performed to detect the levels of related proteins; B: Eca109/sh-vector and Eca109/shSTAT3 cells were treated with 5 μmol/L dihydrotanshinone I, and Western blot was performed to detect the levels of related proteins.
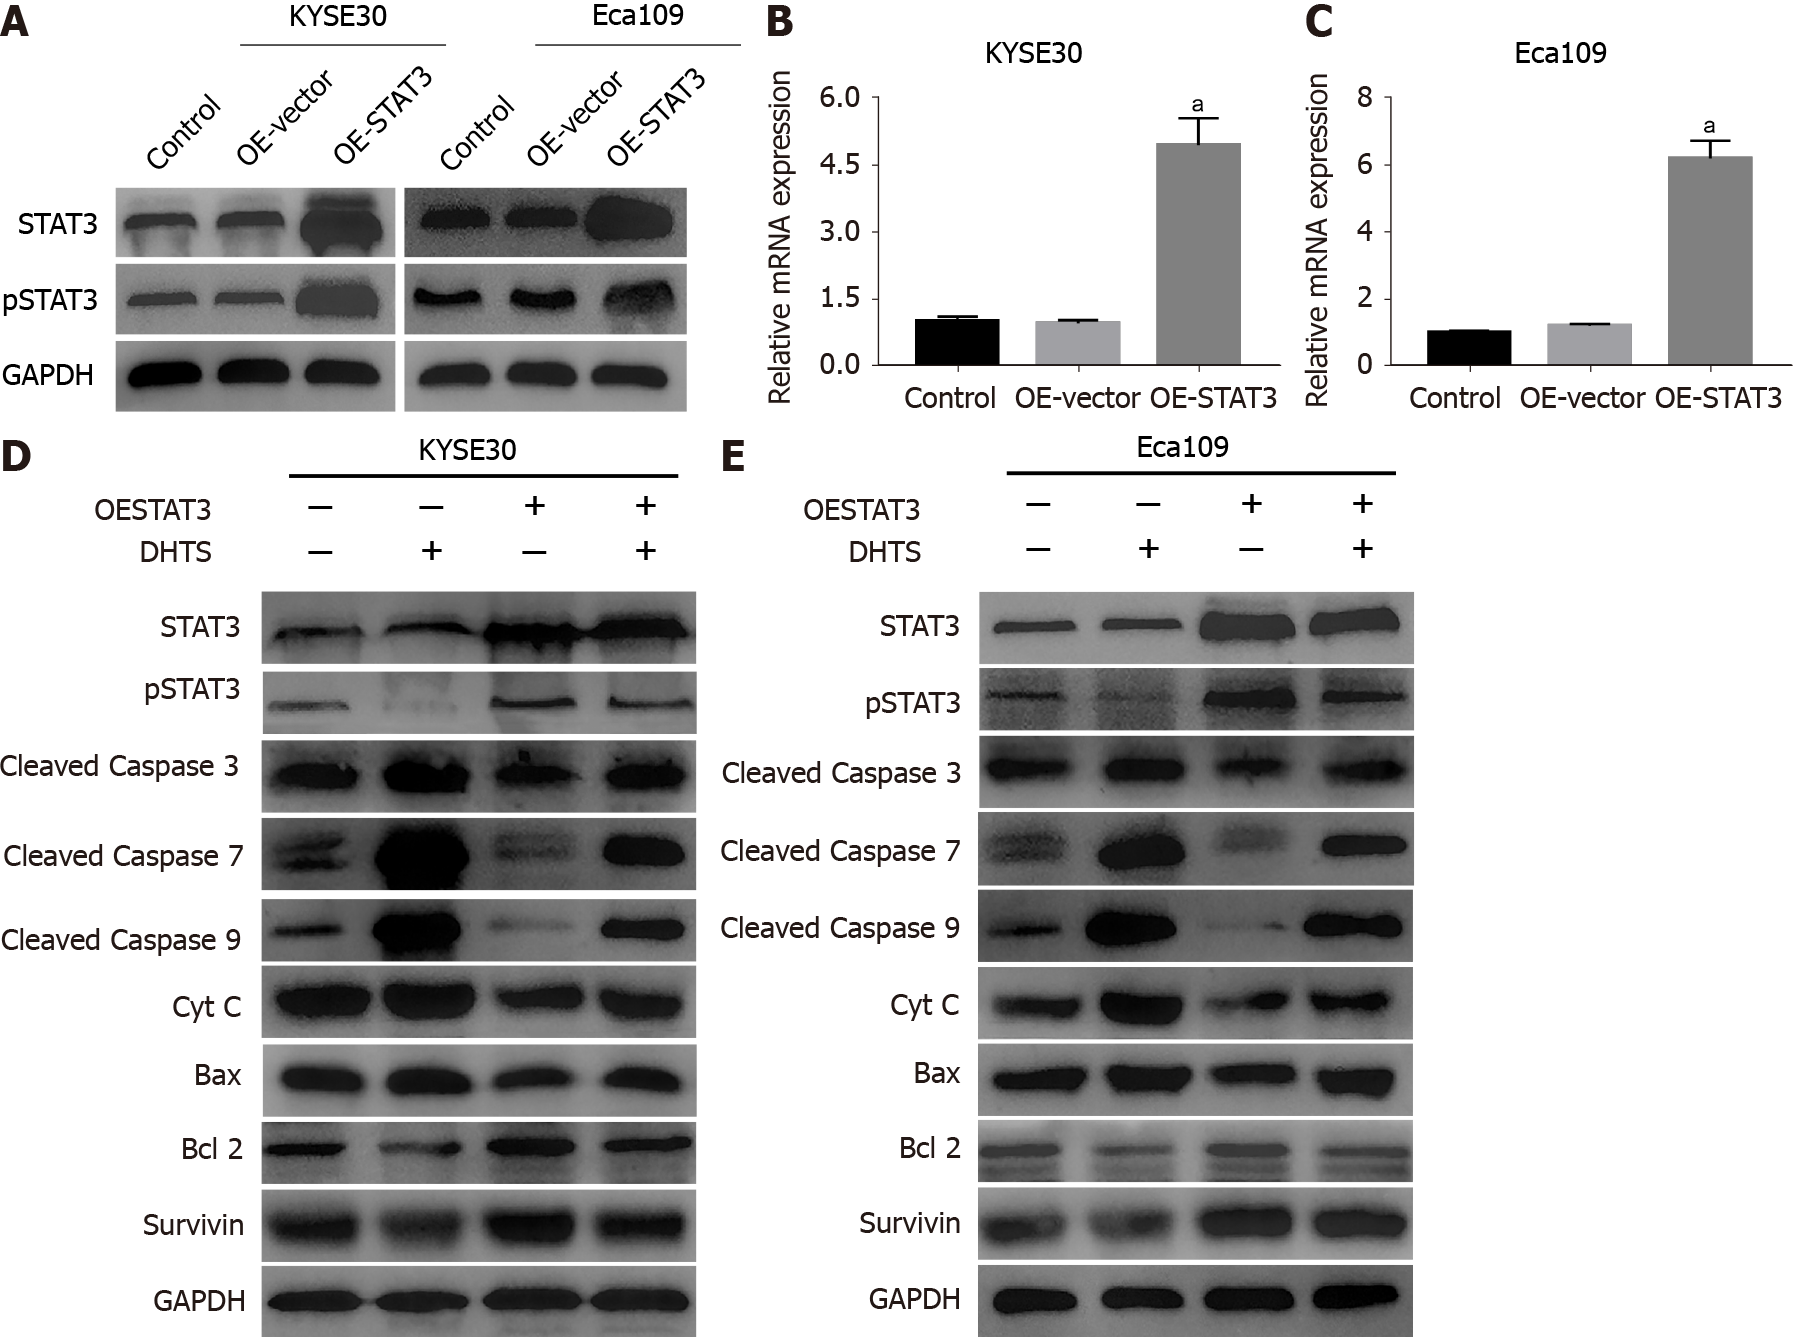
Figure 9 STAT3 overexpression blocks the mitochondrial pathway activated by dihydrotanshinone I in esophageal squamous cell carci
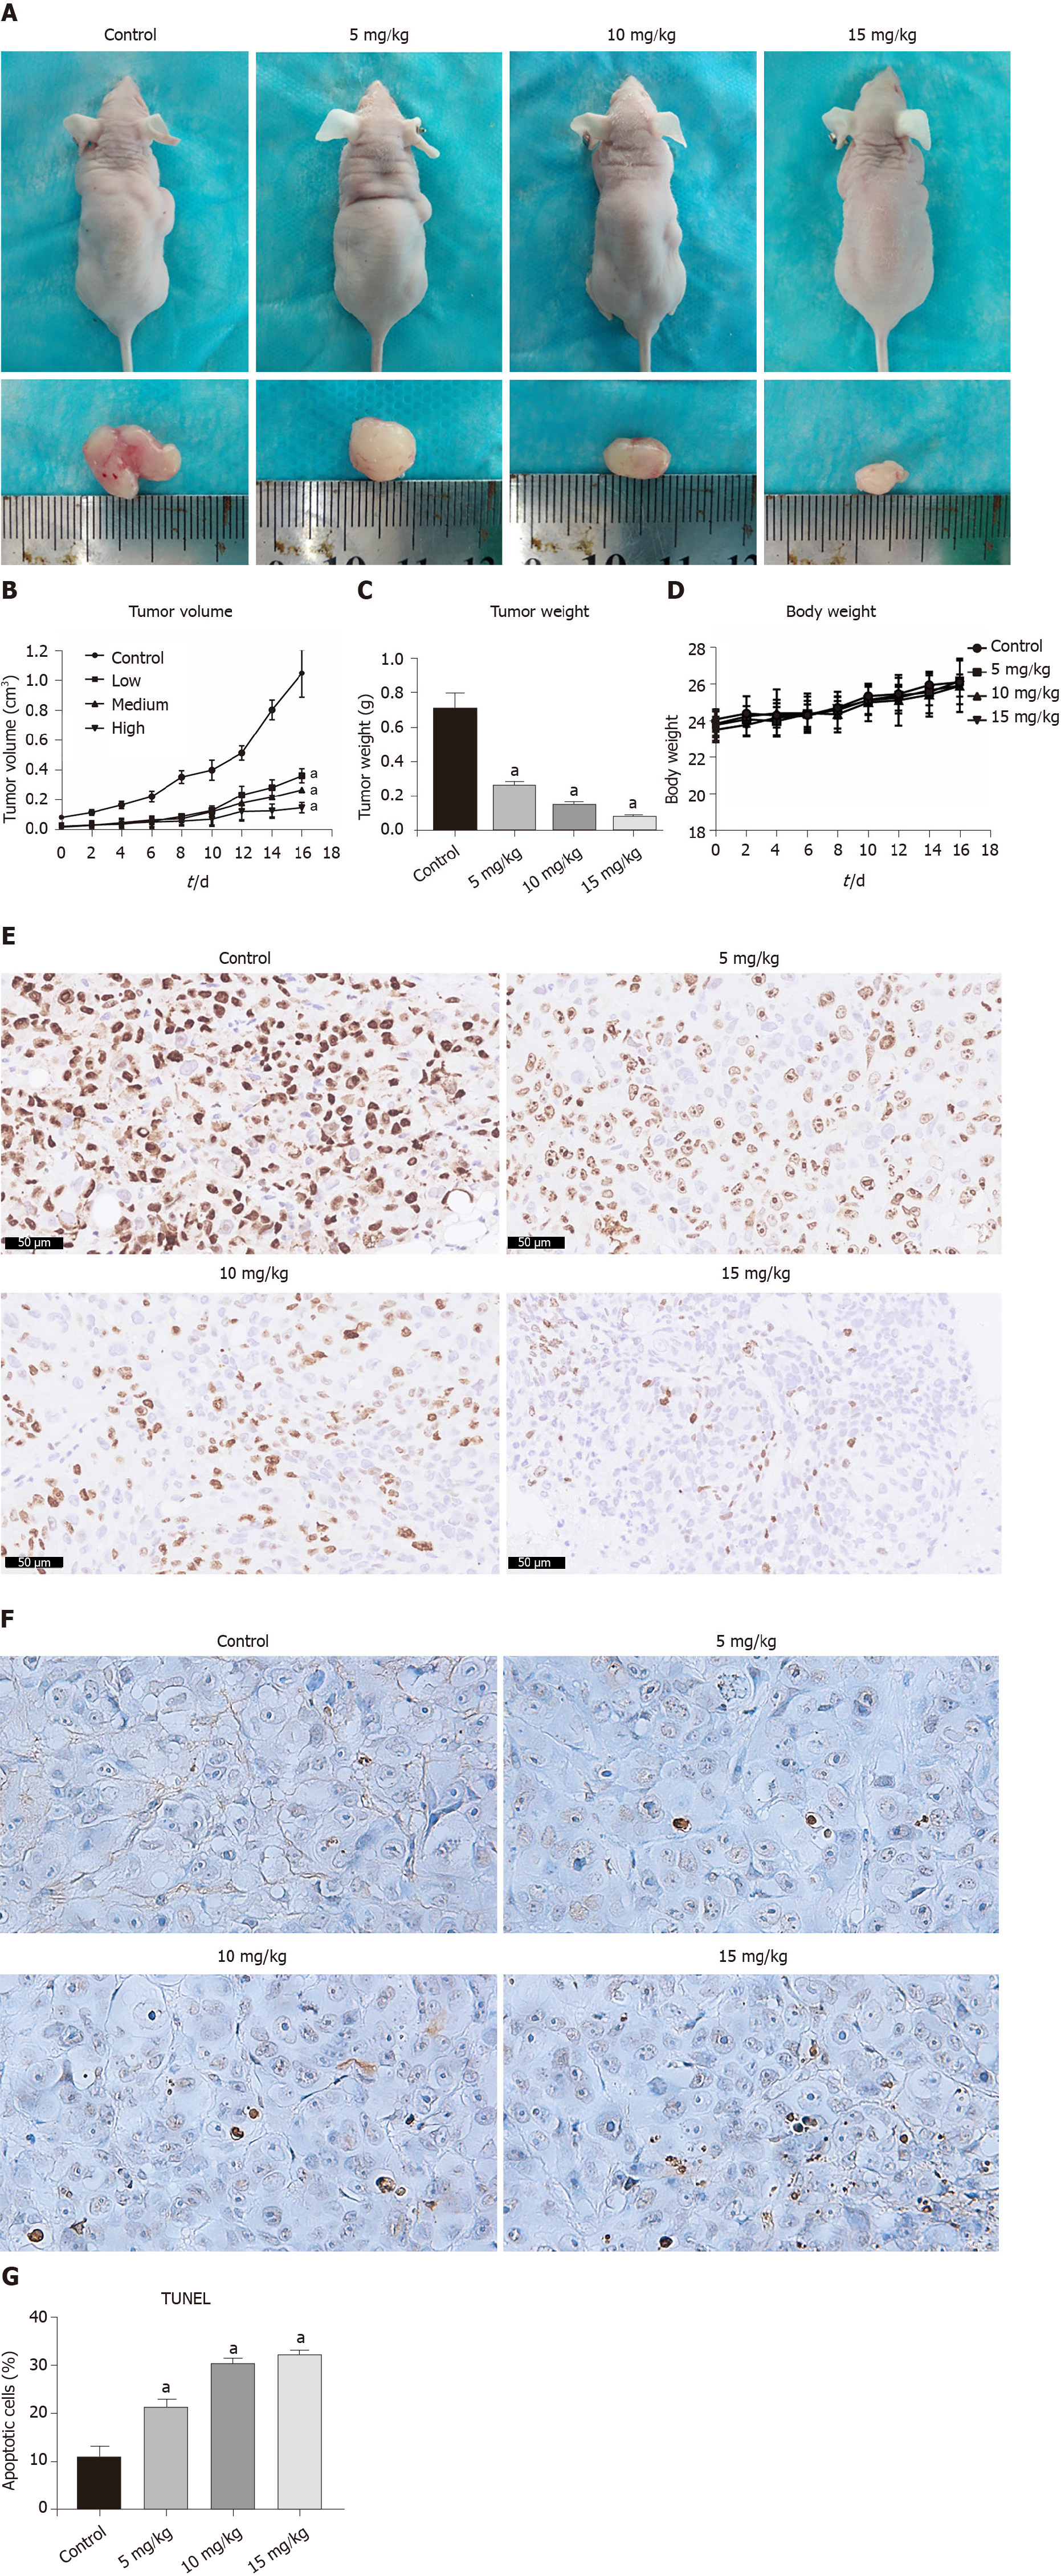
Figure 10 Dihydrotanshinone I inhibits proliferation and induces apoptosis in esophageal squamous cell carcinoma in vivo.
A: Morphology of the subcutaneous implanted tumors; B: Mean tumor volume at each time point; C: Tumor weight obtained at the end of the experiment; D: Recorded body weight of the mice; E: Immunohistochemistry detection of the expression of Ki67 in the tumor tissue; F and G: A TUNEL assay was performed to detect apoptotic cells in the tumor tissue. aP < 0.05 vs control.
- Citation: Qi MM, He PZ, Zhang L, Dong WG. STAT3-mediated activation of mitochondrial pathway contributes to antitumor effect of dihydrotanshinone I in esophageal squamous cell carcinoma cells. World J Gastrointest Oncol 2021; 13(8): 893-914
- URL: https://www.wjgnet.com/1948-5204/full/v13/i8/893.htm
- DOI: https://dx.doi.org/10.4251/wjgo.v13.i8.893


