Copyright
©The Author(s) 2021.
World J Gastrointest Oncol. Mar 15, 2021; 13(3): 161-173
Published online Mar 15, 2021. doi: 10.4251/wjgo.v13.i3.161
Published online Mar 15, 2021. doi: 10.4251/wjgo.v13.i3.161
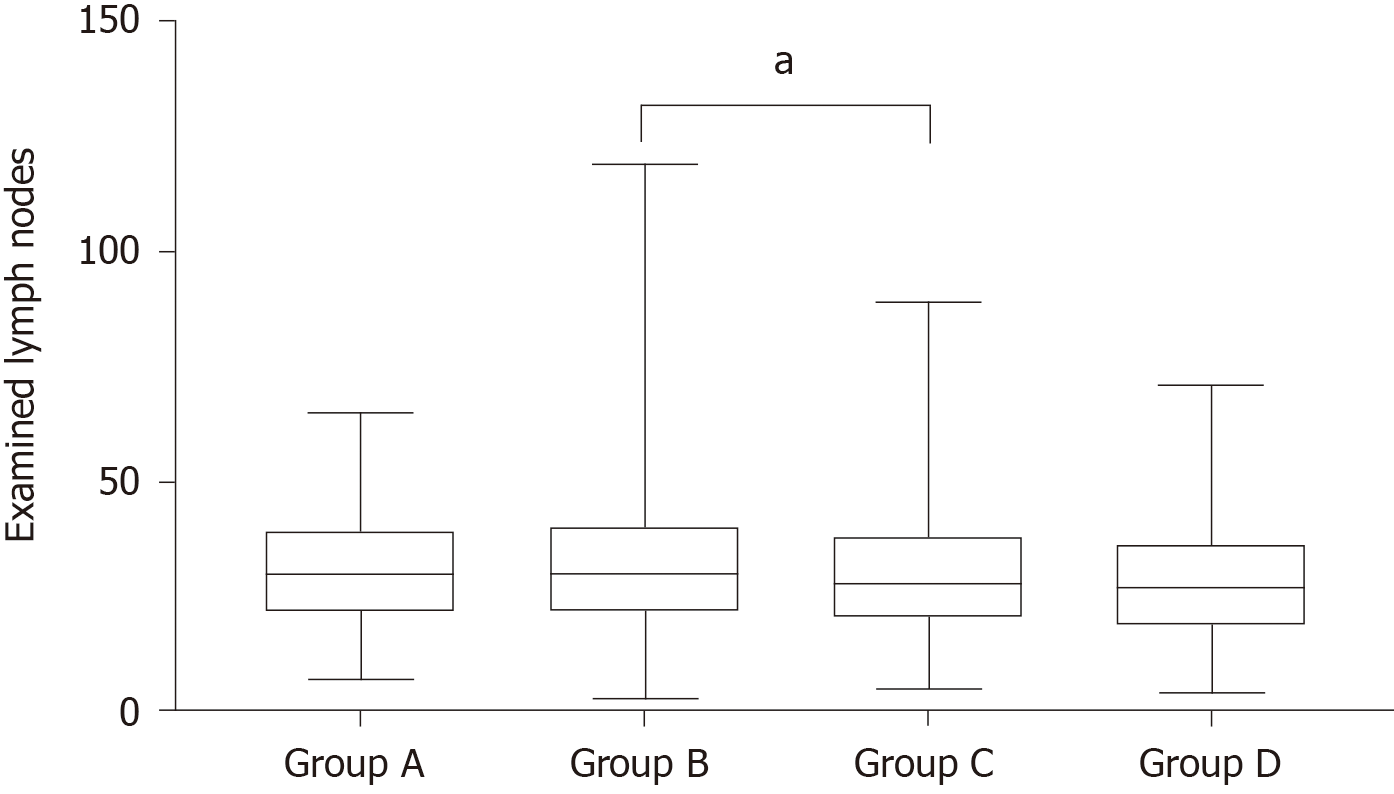
Figure 1 Examined lymph nodes in each group.
aP < 0.05.
Figure 2 Kaplan-Meier curves for overall survival according to body mass index.
A: Kaplan-Meier curves for overall survival are shown for all pathological tumor-node-metastasis (pTNM) stages (log-rank P = 0.039); B: Kaplan-Meier curves for overall survival are shown for pTNM stage I disease (log-rank P = 0.767); C: Kaplan-Meier curves for overall survival are shown for pTNM stage II disease (log-rank P = 0.117); D: Kaplan-Meier curves for overall survival are shown for pTNM stage III disease (log-rank P = 0.041).
- Citation: Ma S, Liu H, Ma FH, Li Y, Jin P, Hu HT, Kang WZ, Li WK, Xiong JP, Tian YT. Low body mass index is an independent predictor of poor long-term prognosis among patients with resectable gastric cancer. World J Gastrointest Oncol 2021; 13(3): 161-173
- URL: https://www.wjgnet.com/1948-5204/full/v13/i3/161.htm
- DOI: https://dx.doi.org/10.4251/wjgo.v13.i3.161


