Copyright
©The Author(s) 2021.
World J Gastrointest Oncol. Nov 15, 2021; 13(11): 1833-1846
Published online Nov 15, 2021. doi: 10.4251/wjgo.v13.i11.1833
Published online Nov 15, 2021. doi: 10.4251/wjgo.v13.i11.1833
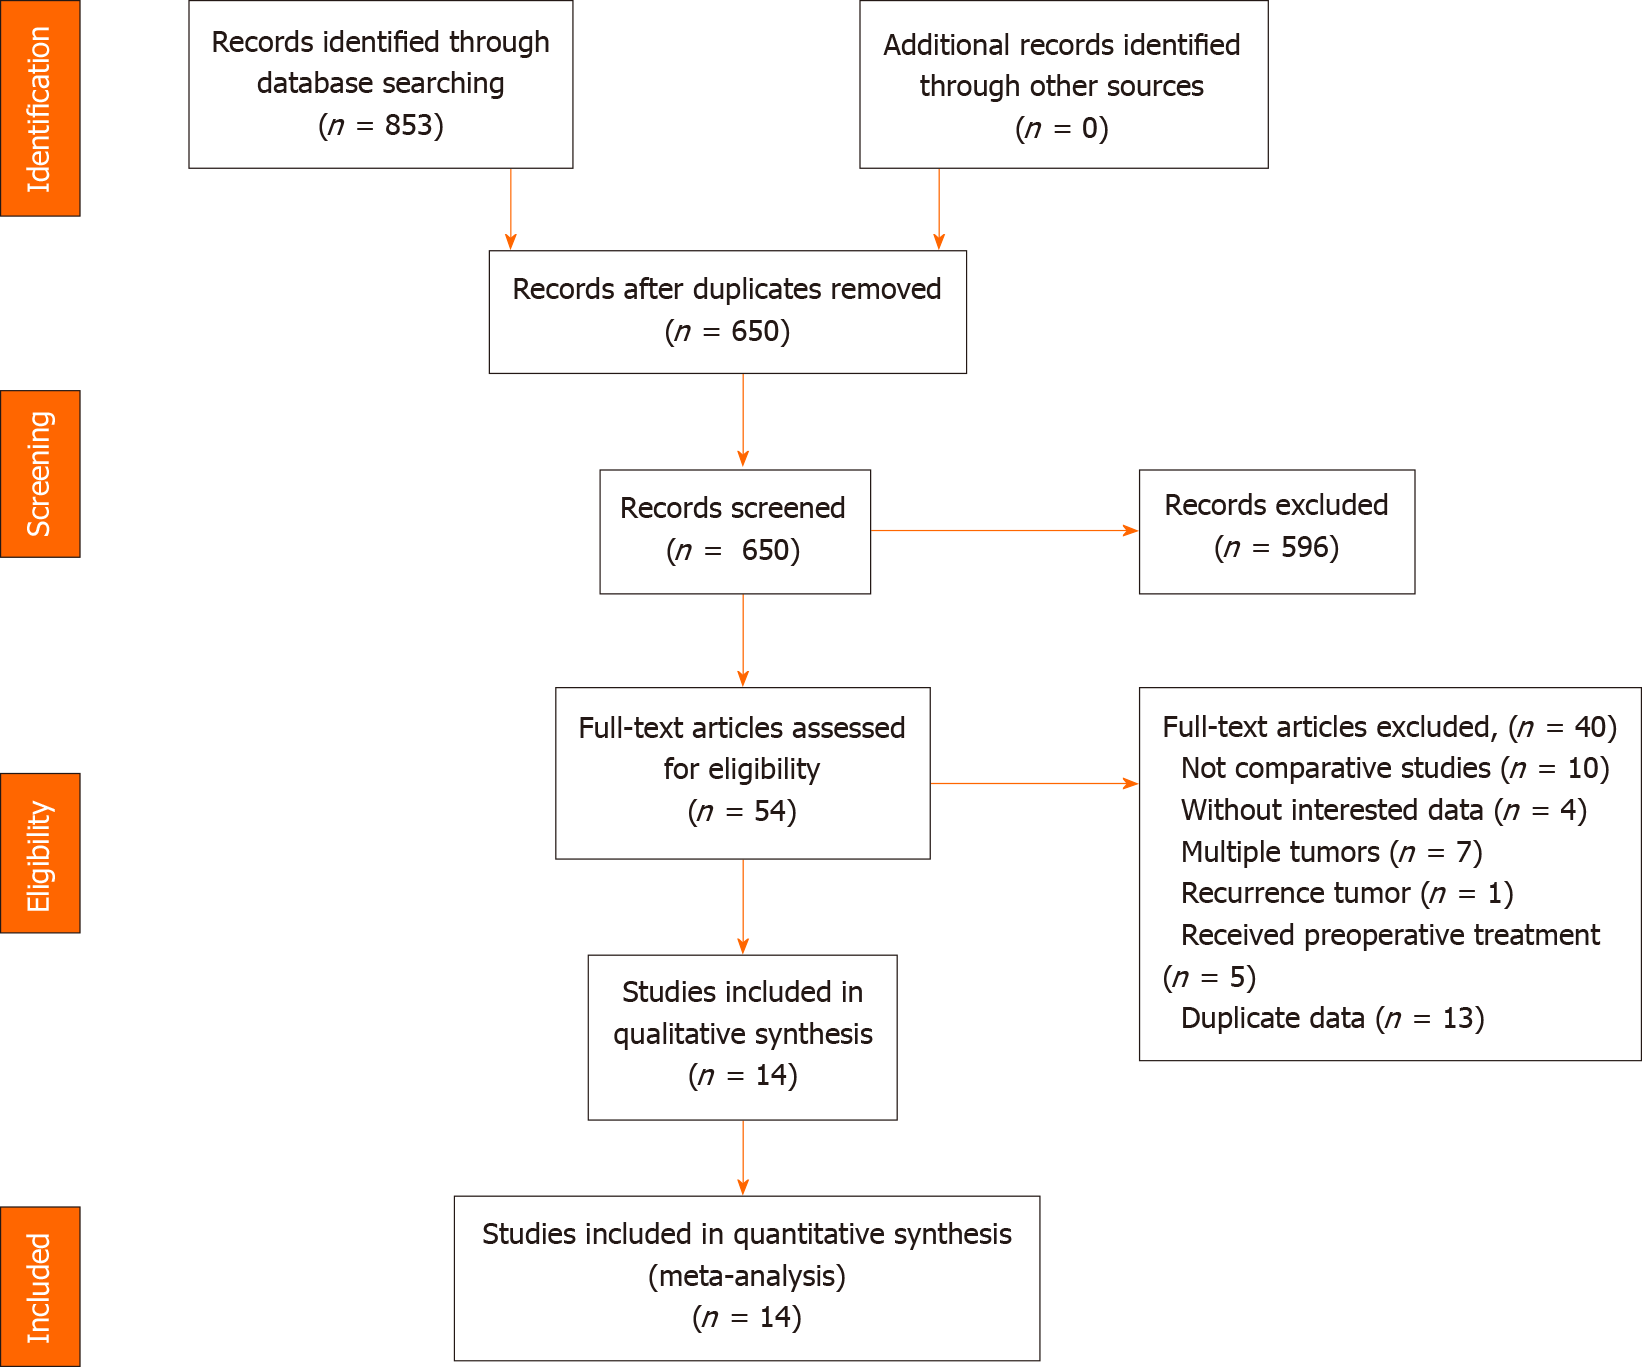
Figure 1 Flow chart of selection process in this meta-analysis.
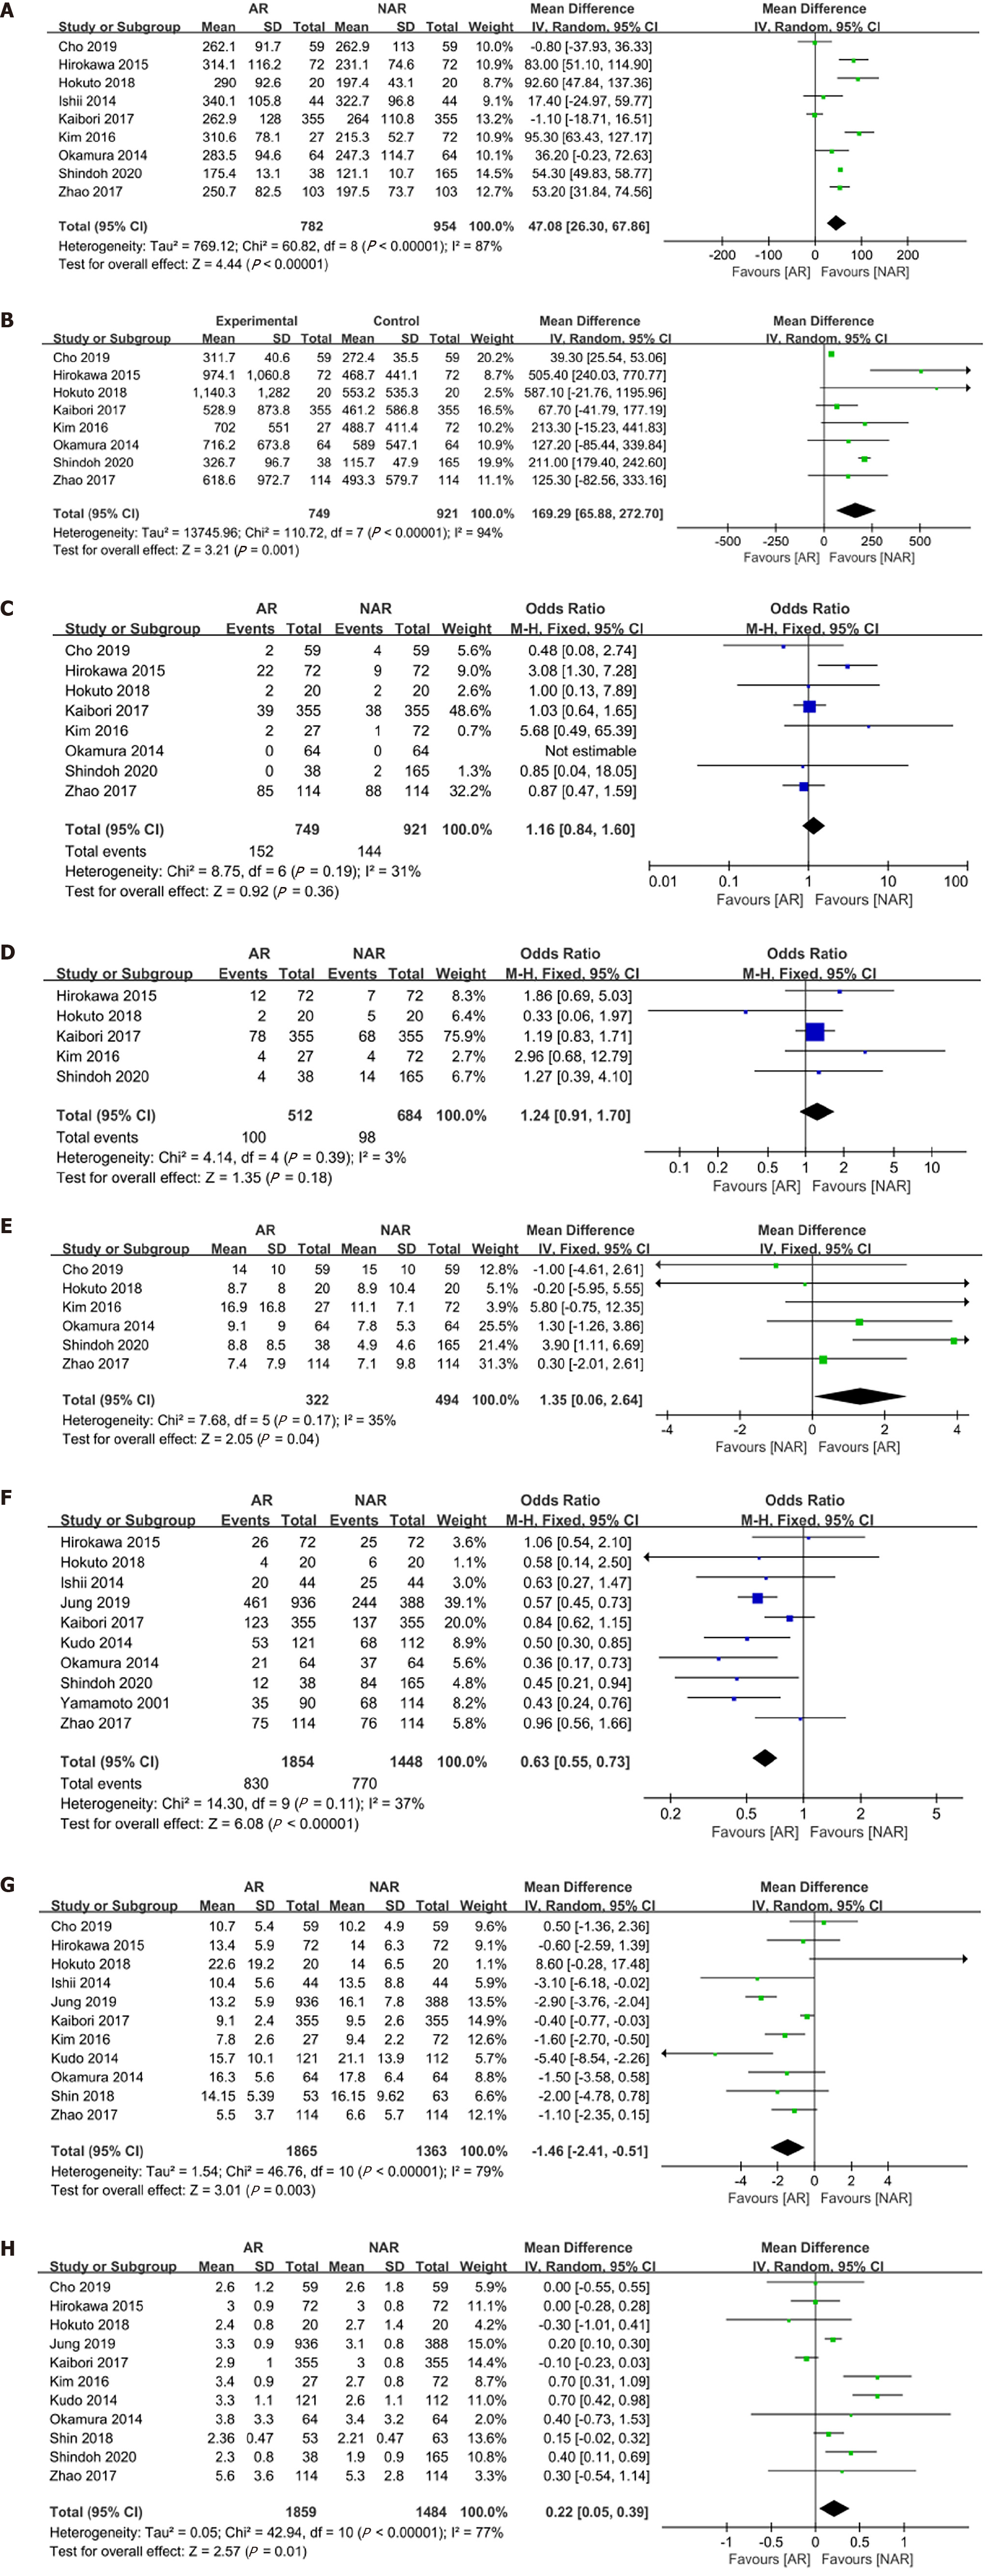
Figure 2 Forest plots of perioperative outcomes.
A: Operating time; B: Blood loss; C: Blood transfusion; D: Postoperative complications; E: Surgical margin; F: Cirrhosis; G: Indocyanine green retention at 15 min; H: Tumor size. CI: Confidence interval.
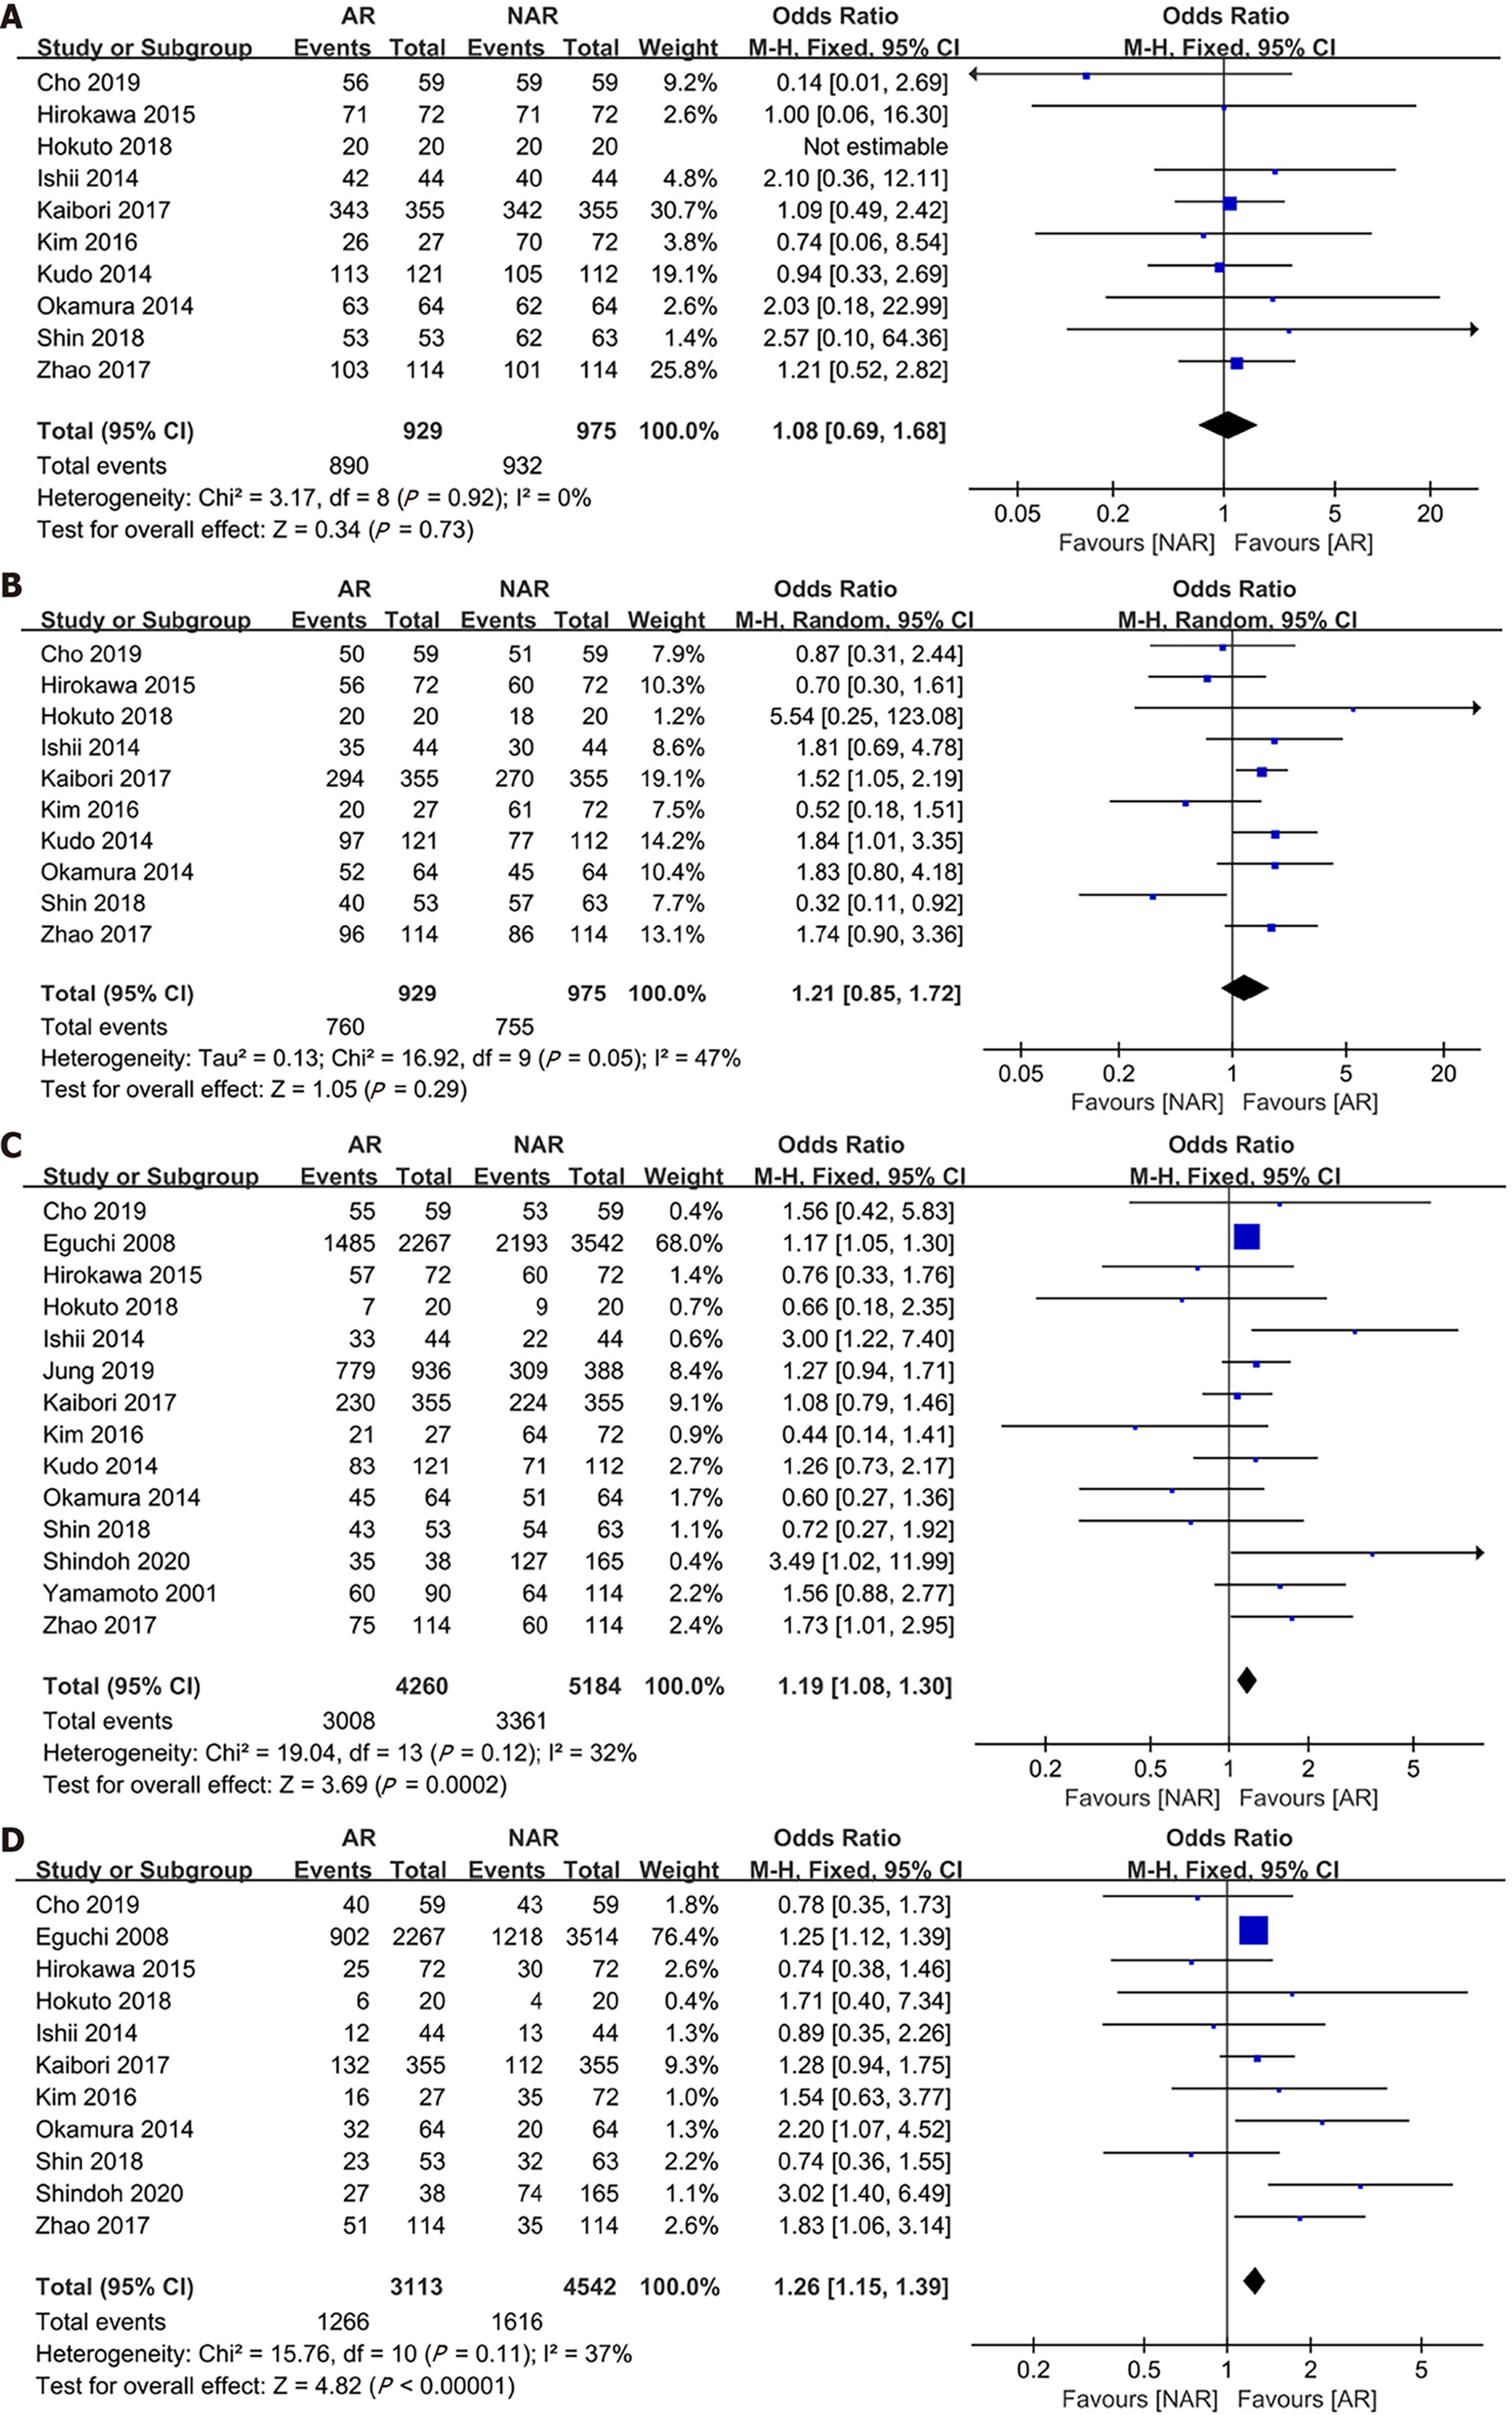
Figure 3 Forest plots of primary outcomes.
A: 1-year overall survival (OS); B: 1-year disease-free survival (DFS); C: 5-year OS; D: 5-year DFS. CI: Confidence interval.
Figure 4 Sensitivity analysis and funnel plot of 5-year overall survival for subjects with hepatectomy using anatomical resection vs non-anatomical liver resection.
A: Sensitivity analysis; B: Funnel plot.
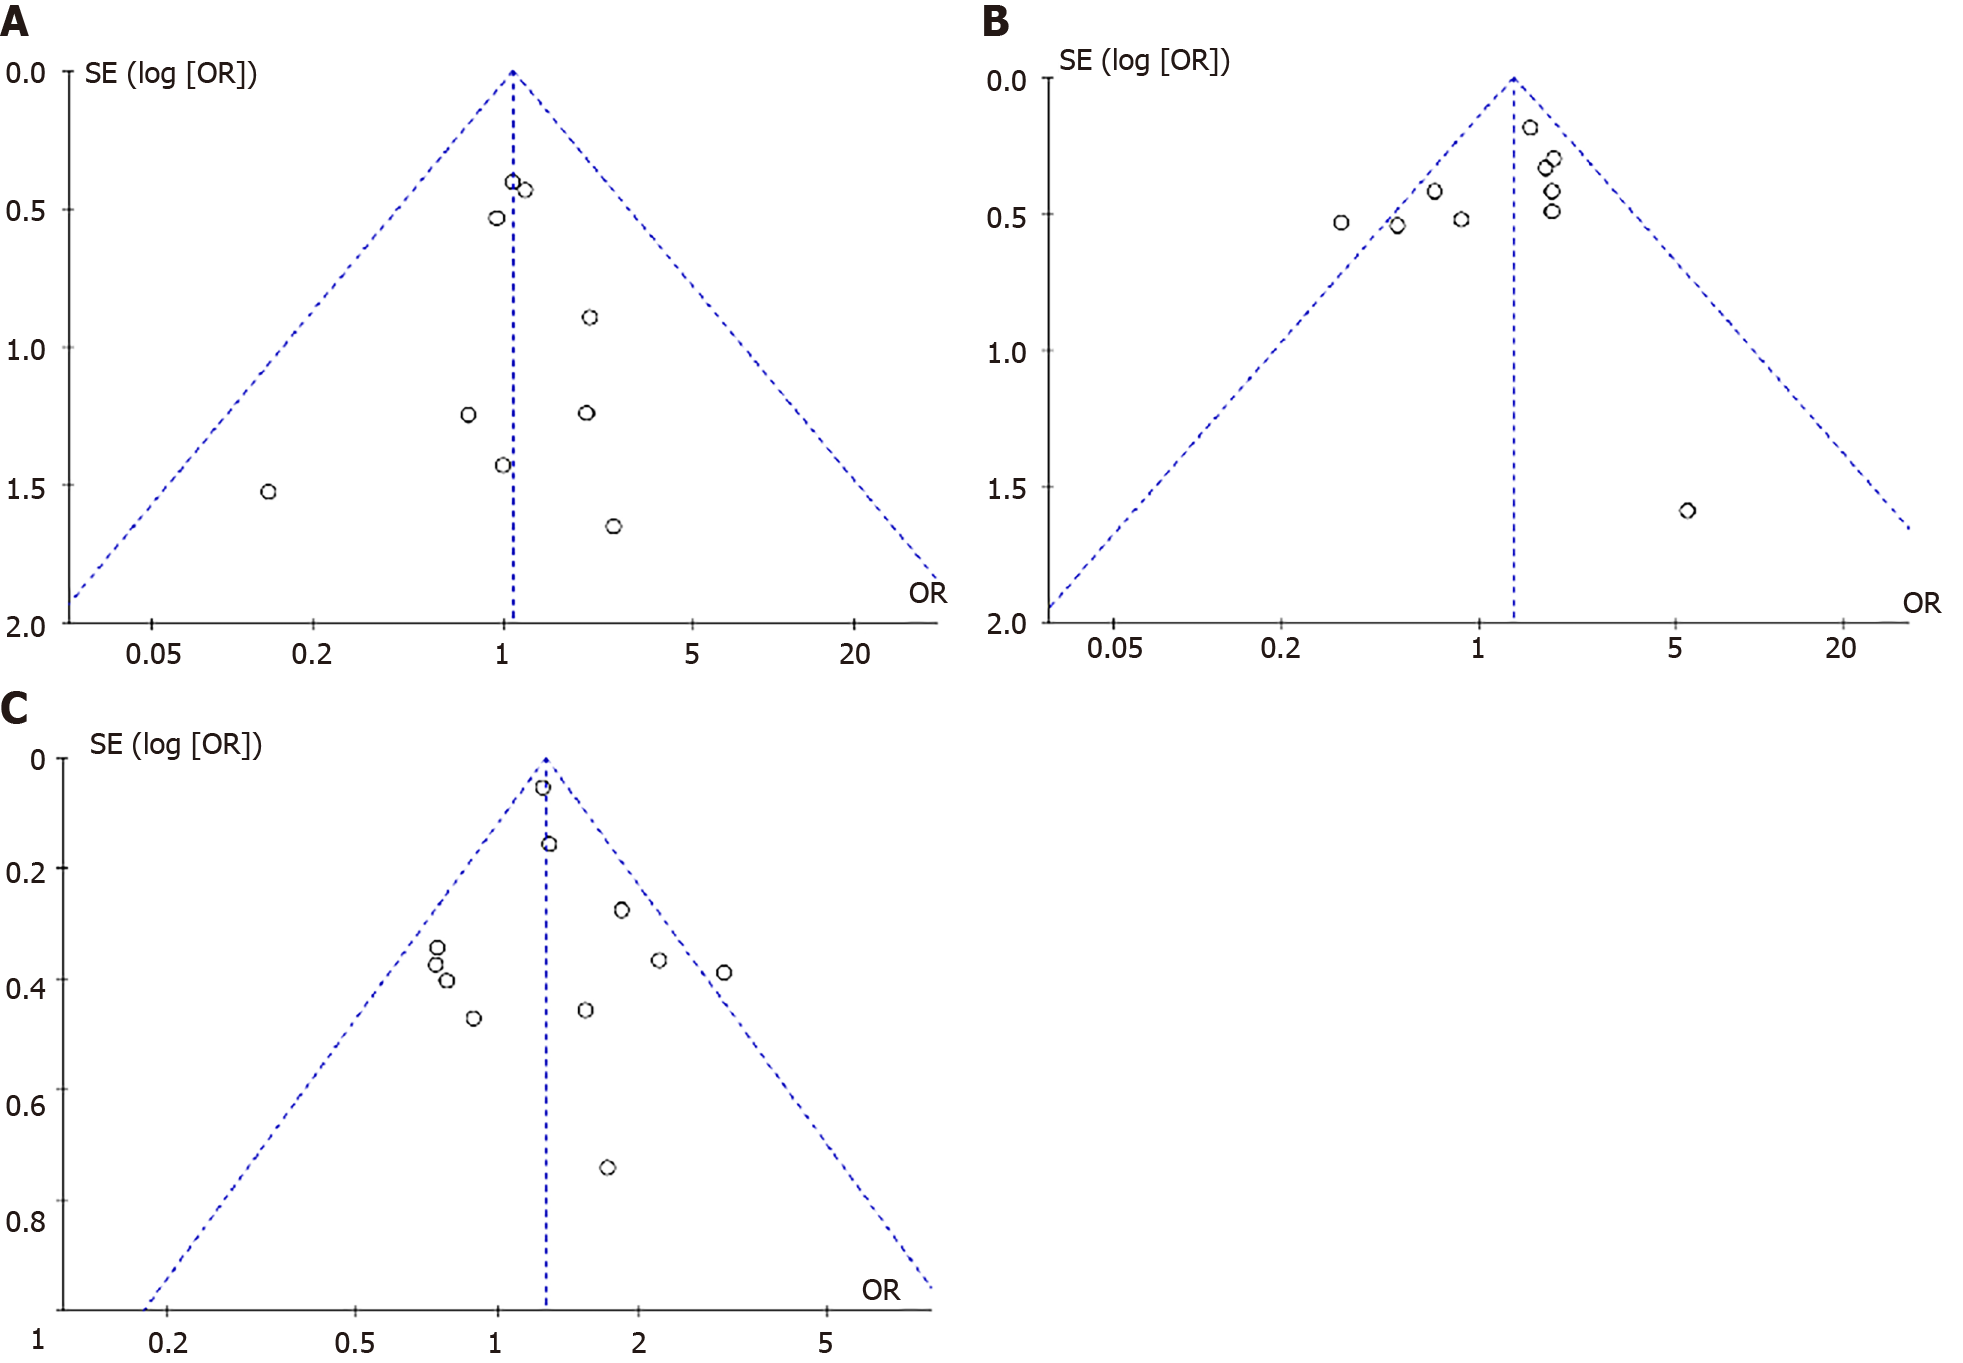
Figure 5 Funnel plots of primary outcomes.
A: 1-year overall survival; B: 1-year disease-free survival (DFS); C: 5-year DFS. OR: Odds ratio.
- Citation: Liu H, Hu FJ, Li H, Lan T, Wu H. Anatomical vs nonanatomical liver resection for solitary hepatocellular carcinoma: A systematic review and meta-analysis. World J Gastrointest Oncol 2021; 13(11): 1833-1846
- URL: https://www.wjgnet.com/1948-5204/full/v13/i11/1833.htm
- DOI: https://dx.doi.org/10.4251/wjgo.v13.i11.1833


