Copyright
©The Author(s) 2021.
World J Gastrointest Oncol. Oct 15, 2021; 13(10): 1518-1531
Published online Oct 15, 2021. doi: 10.4251/wjgo.v13.i10.1518
Published online Oct 15, 2021. doi: 10.4251/wjgo.v13.i10.1518
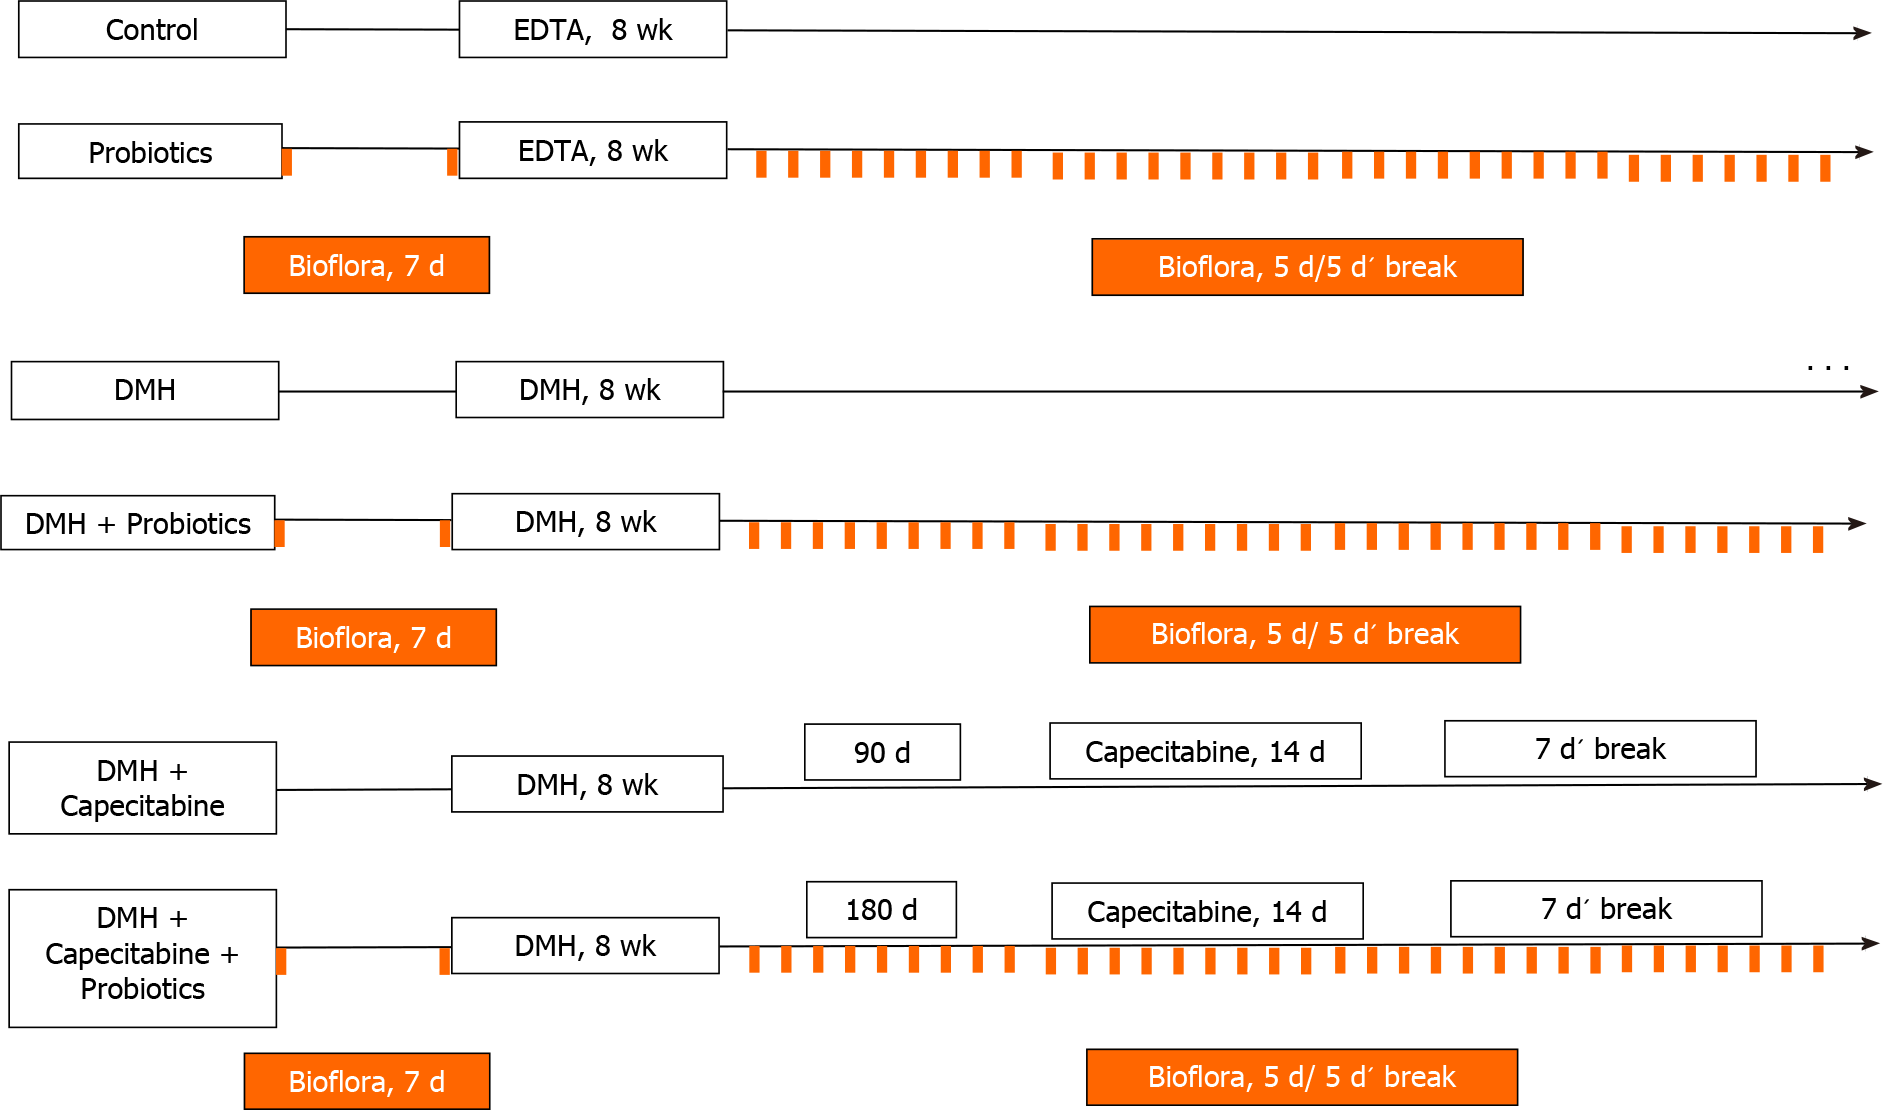
Figure 1 Experimental design.
This figure shows a diagram of the treatment received by each group of animals. In all cases the treatment was continued until the moment of euthanasia or the end of their life. This figure is original for this work. DMH: 1,2-Dimethylhidrazine dihydrochloride; EDTA: Ethylene diamine tetra-acetic acid.
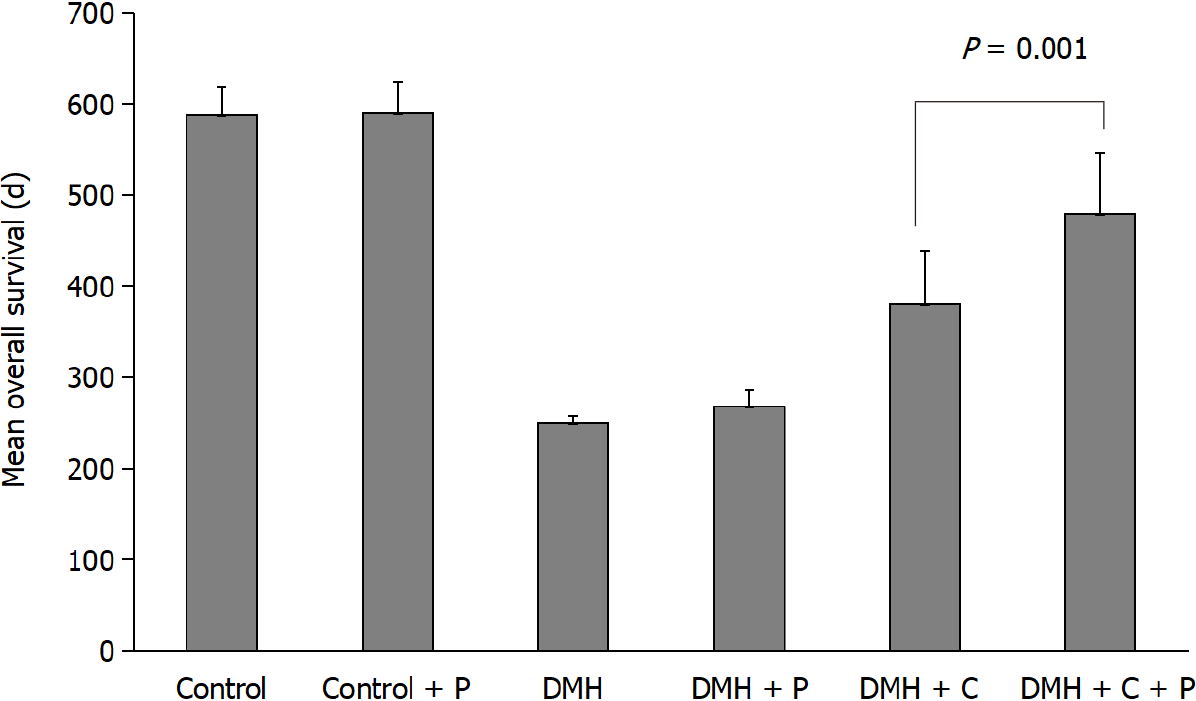
Figure 2 Mean overall survival of each experimental group.
The bars represent the average survival of the animals in each group at the end of the experiment. The statistical analysis shows a significant increase in the mean overall survival of the animals from the 1,2-Dimethylhidrazine dihydrochloride (DMH) + Capecitabine (C) + Probiotics group with respect to the DMH + C group (P = 0.001). This Figure is original for this work. DMH: 1,2-Dimethylhidrazine dihydrochloride; C: Capecitabine; P: Probiotics.
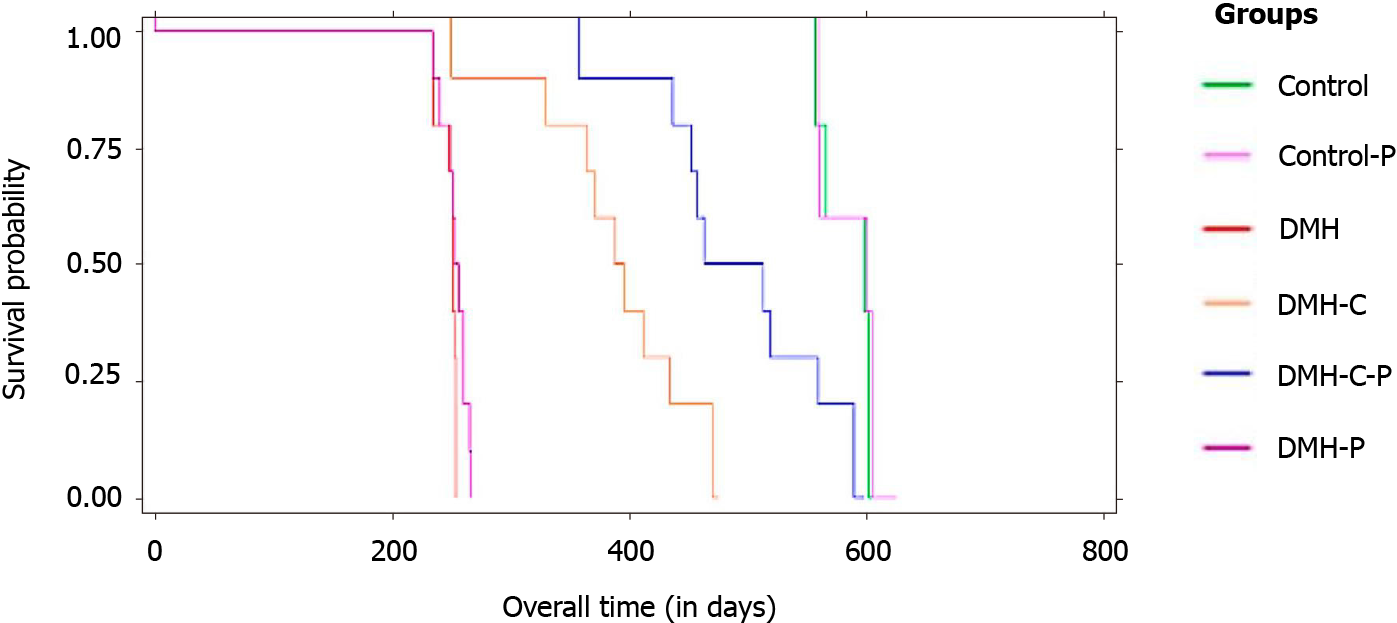
Figure 3 Kaplan-Meier curves of overall survival.
The overall survival of the groups was compared using the log-rank test and included the entire follow-up period. Significant difference is observed in survival time between the 1,2-Dimethylhidrazine dihydrochloride-capecitabine (DMH-C) group (in orange) and DMH-C-probiotics group (in blue) (P = 0.0001). This Figure is original for this work. DMH: 1,2-Dimethylhidrazine dihydrochloride; C: Capecitabine; P: Probiotics.
Figure 4 Light micrograph of three hematoxylin-eosin stained sections from large intestine where a mucinous carcinoma with different degrees of infiltration is observed (magnification: 100 ×).
A: 1,2-Dimethylhidrazine dihydrochloride (DMH) group the carcinoma invades the sub-serosa and serosa layers of the colonic wall; B: DMH-capecitabine (DMH-C) group the tumor involves the muscular layer; C: Animal’s carcinoma treated with probiotics, DMH-C-probiotics, shows invasion only until the muscular without compromise (orange arrows). This Figure is original for this work.
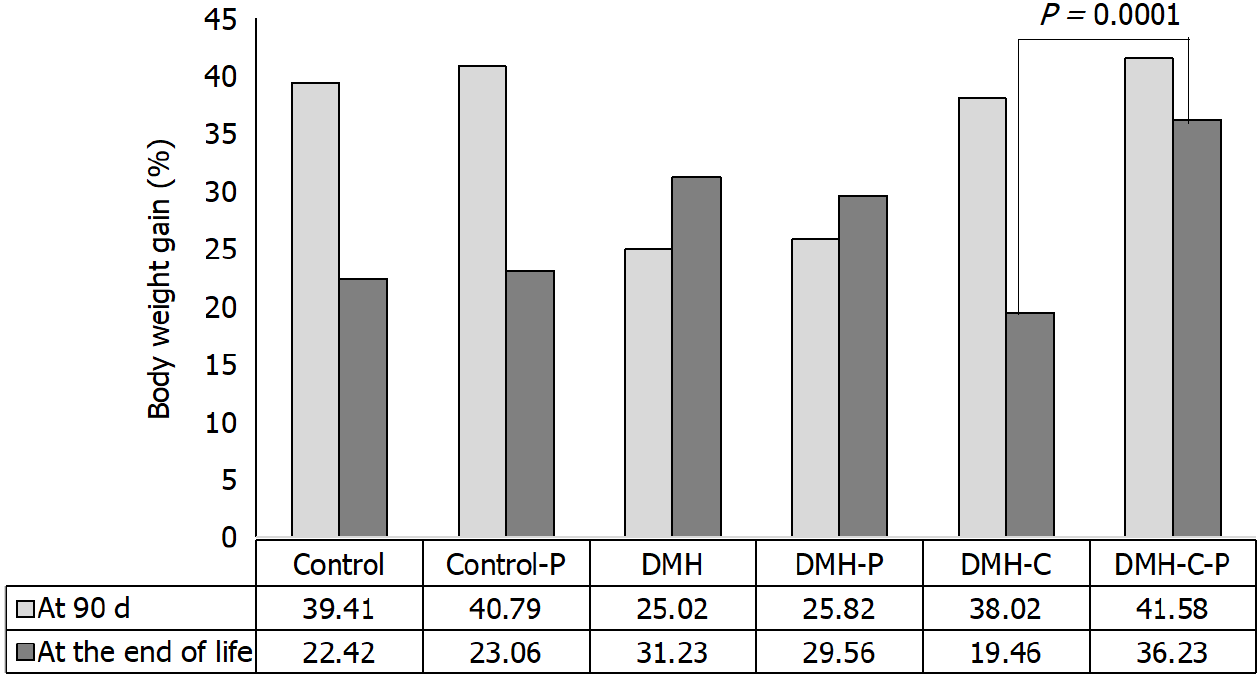
Figure 5 Differences in the body weight gain percentage.
The body weight of each rat was measured at 90 d after the end of tumor induction and then at the end of life. A statistically significant body weight gain is observed in the 1,2-Dimethylhidrazine dihydrochloride (DMH) + Capecitabine (C) + Probiotics group with respect to the DMH + C group (P = 0.0001). This Figure is original for this work. DMH: 1,2-Dimethylhidrazine dihydrochloride; C: Capecitabine; P: Probiotics.
- Citation: Gigola G, Carriere P, Novoa Díaz MB, Perdigon G, Zwenger AO, Gentili C. Survival effect of probiotics in a rat model of colorectal cancer treated with capecitabine. World J Gastrointest Oncol 2021; 13(10): 1518-1531
- URL: https://www.wjgnet.com/1948-5204/full/v13/i10/1518.htm
- DOI: https://dx.doi.org/10.4251/wjgo.v13.i10.1518


