Copyright
©The Author(s) 2021.
World J Gastrointest Oncol. Oct 15, 2021; 13(10): 1317-1335
Published online Oct 15, 2021. doi: 10.4251/wjgo.v13.i10.1317
Published online Oct 15, 2021. doi: 10.4251/wjgo.v13.i10.1317
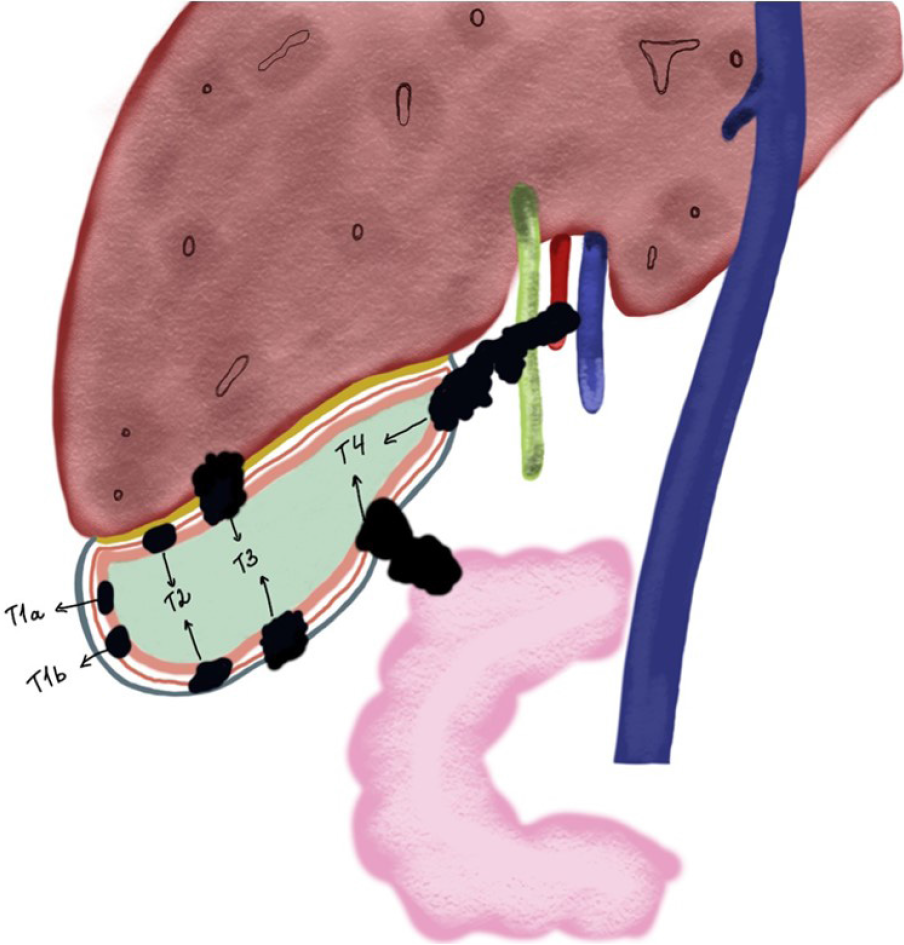
Figure 1
Diagram of gallbladder cancer based on depth of tumor invasion is shown.
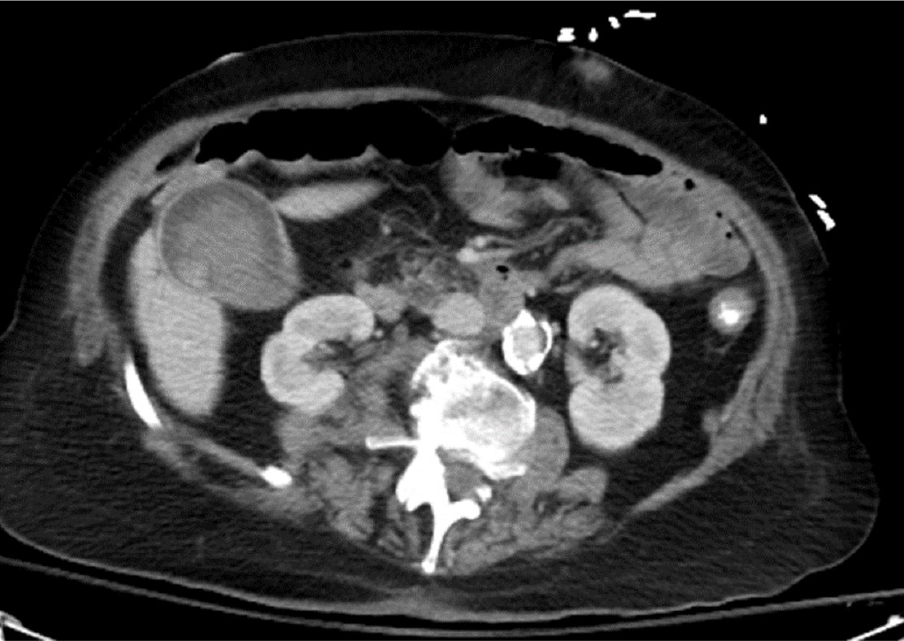
Figure 2 Typical gallbladder cancer on computed tomography scan is shown.
Contrast enhanced tumor is seen in the gallbladder.
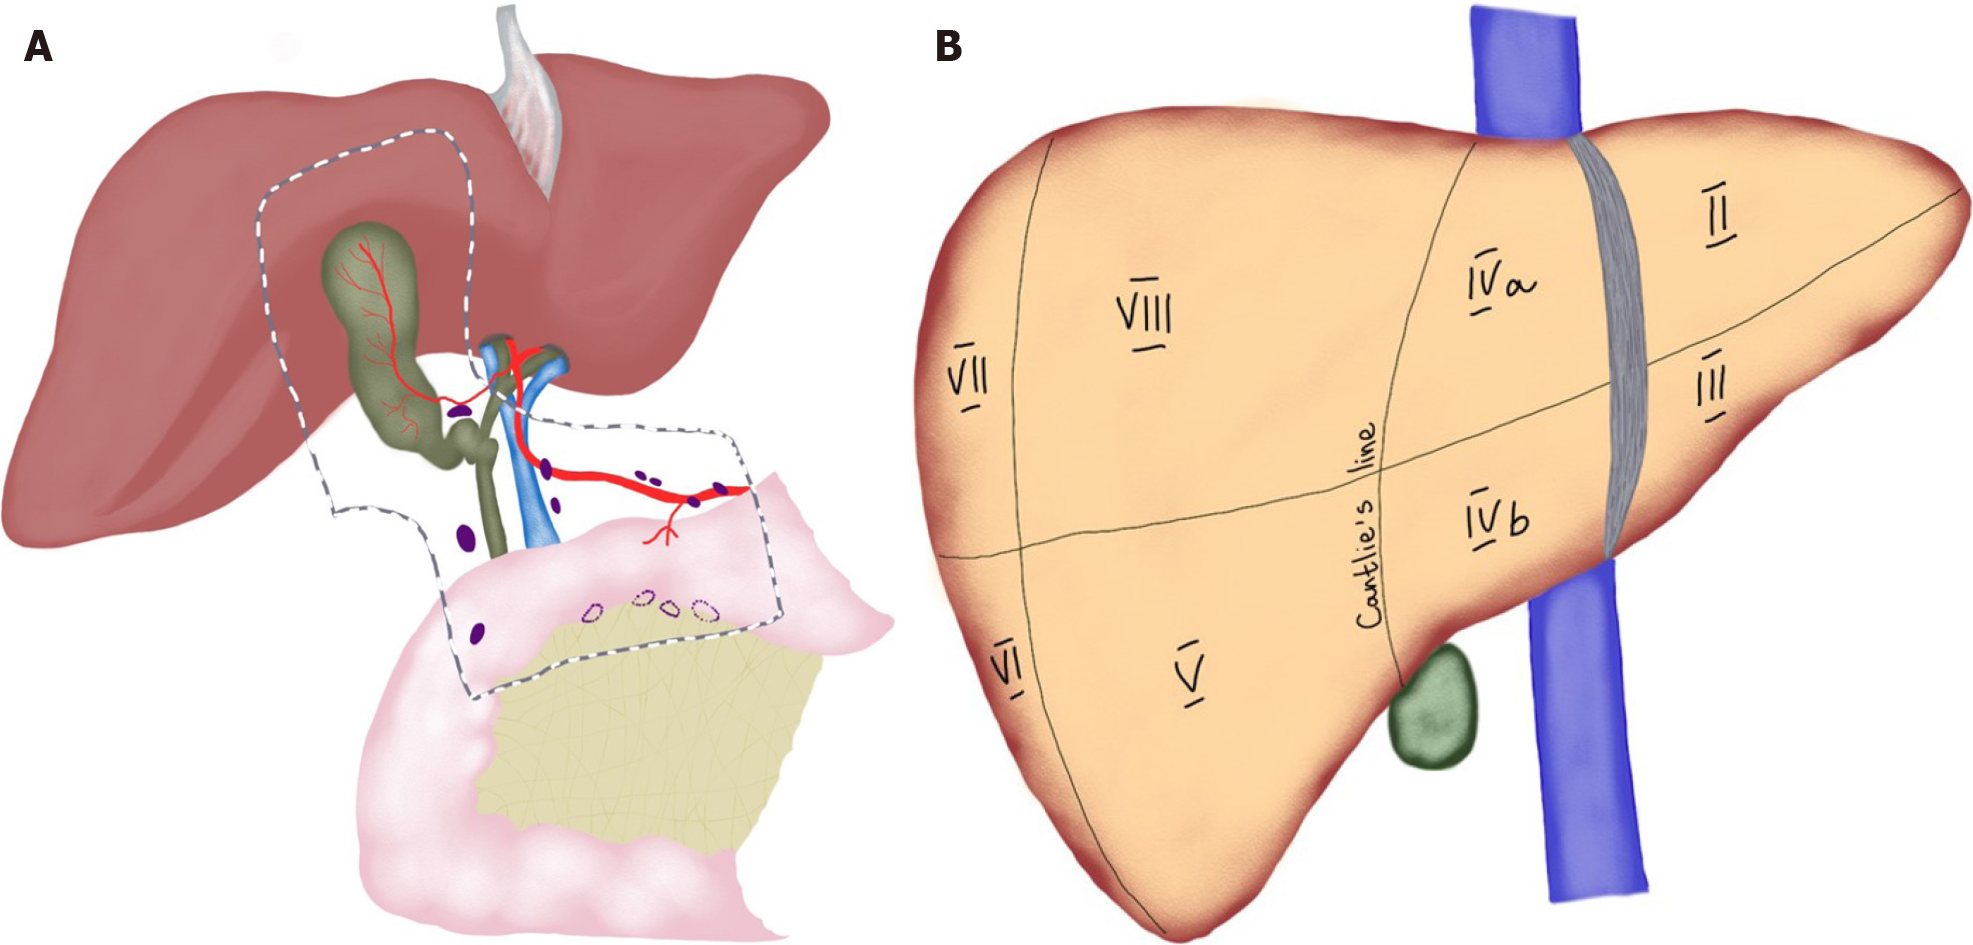
Figure 3 A key anatomy for gallbladder cancer.
A: Lymphatic drainage pattern for gallbladder cancer; B: Liver segments along with Cantlie’s line. Segments IVB and V are frequently involved with gallbladder cancer.
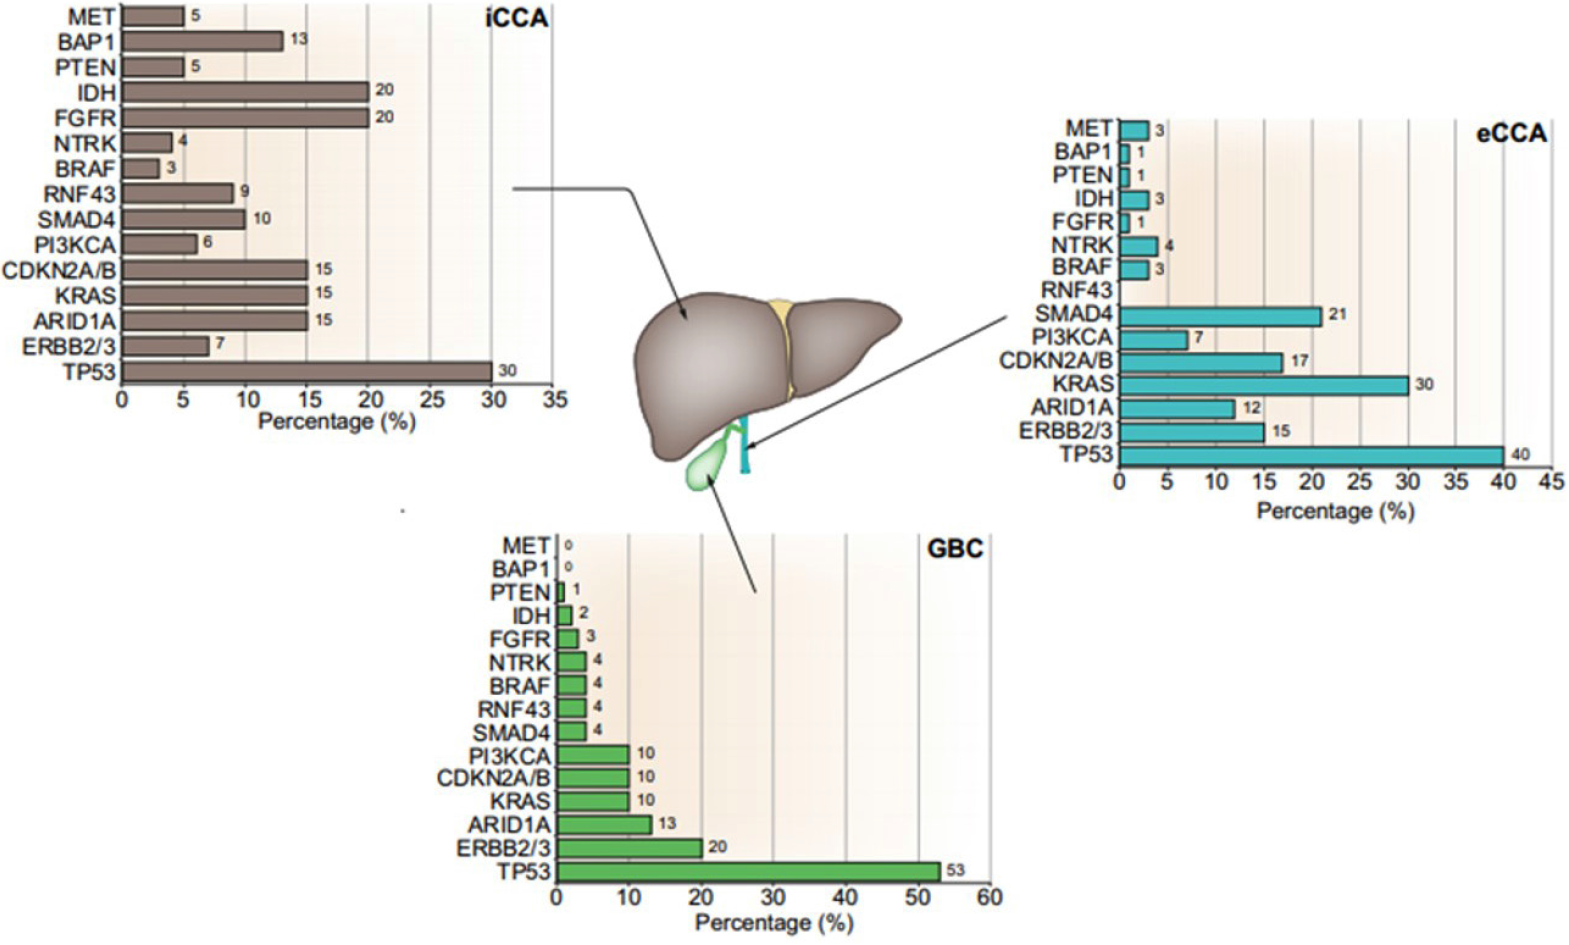
Figure 4 Molecular profiling of biliary tract cancers.
Percentage of main targetable and non-targetable genetic alterations are summarized for intrahepatic cholangiocarcinoma (iCCA), extrahepatic cholangiocarcinoma (eCCA), and gallbladder cancer (GBC). Within targetable alterations, there are clear variations within the molecular profiling of these tumors with a predominance of IDH and FGFR alterations in iCCA and ERBB2/3 (HER2/3) in eCCA and GBC[71]. Citation: Lamarca A, Barriuso J, McNamara MG, Valle JW. Molecular targeted therapies: Ready for "prime time" in biliary tract cancer. J Hepatol 2020; 73(1): 170-185. Copyright ©2020 European Association for the study of the Liver. Published by Elsevier B.V[71]. CCA: Cholangiocarcinoma; eCCA: Extrahepatic cholangiocarcinoma; GBC: Gallbladder cancer; iCCA: Intrahepatic cholangiocarcinoma.
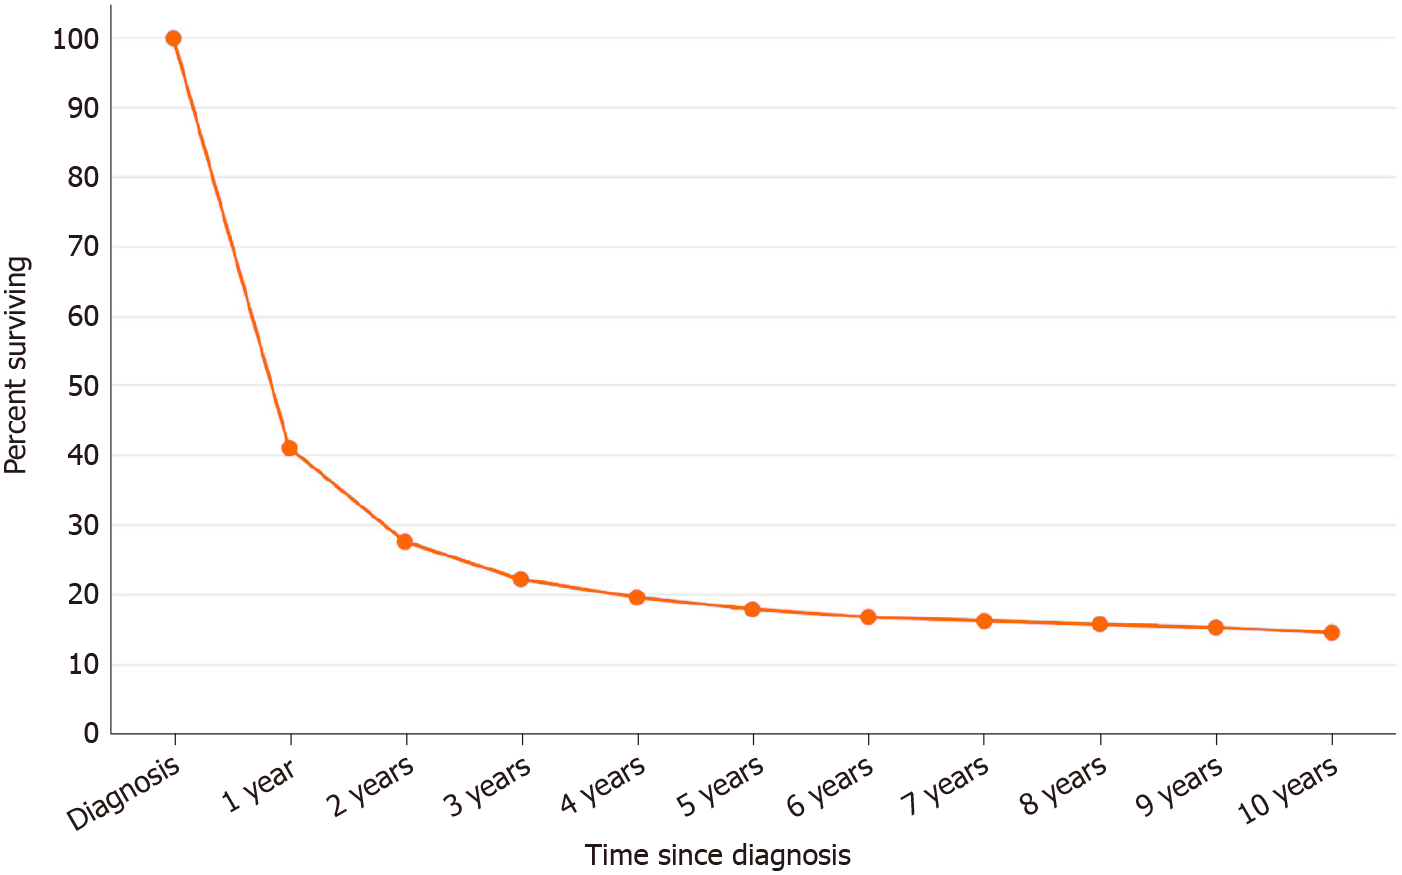
Figure 5
Overall survival for gallbladder cancer based on SEER database.
- Citation: Okumura K, Gogna S, Gachabayov M, Felsenreich DM, McGuirk M, Rojas A, Quintero L, Seshadri R, Gu K, Dong XD. Gallbladder cancer: Historical treatment and new management options. World J Gastrointest Oncol 2021; 13(10): 1317-1335
- URL: https://www.wjgnet.com/1948-5204/full/v13/i10/1317.htm
- DOI: https://dx.doi.org/10.4251/wjgo.v13.i10.1317


