Copyright
©The Author(s) 2021.
World J Gastrointest Oncol. Jan 15, 2021; 13(1): 37-57
Published online Jan 15, 2021. doi: 10.4251/wjgo.v13.i1.37
Published online Jan 15, 2021. doi: 10.4251/wjgo.v13.i1.37
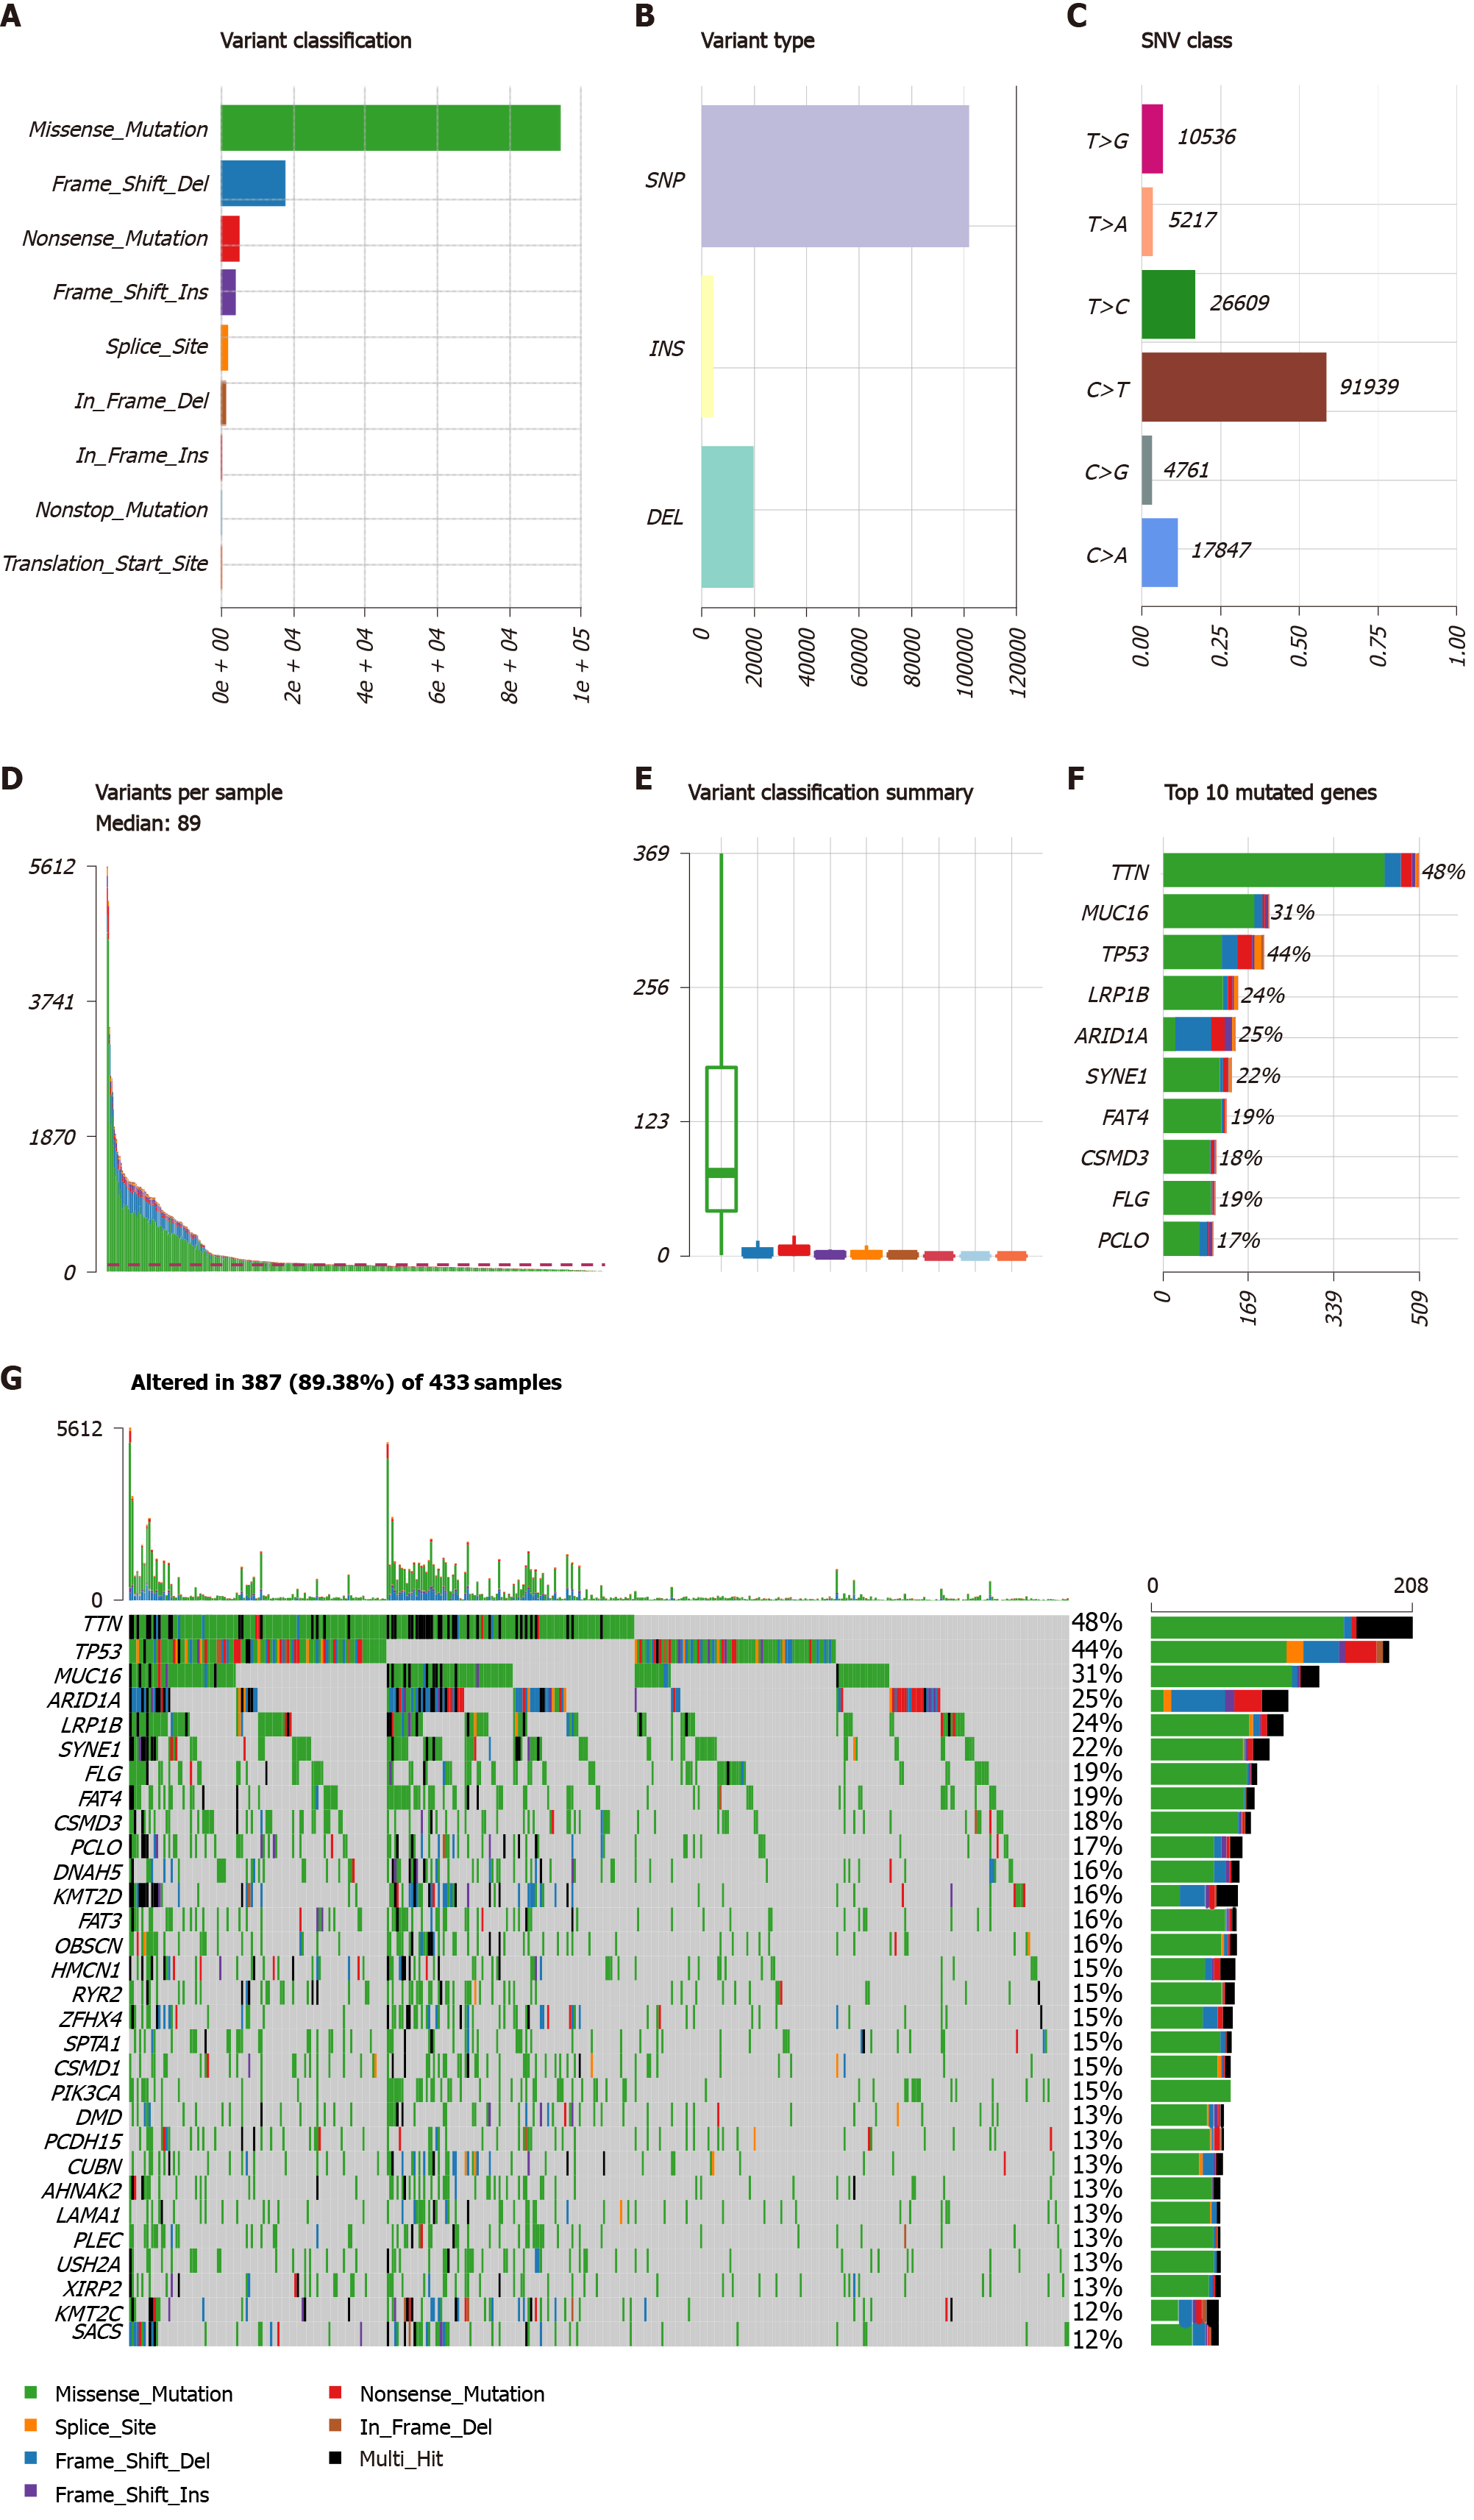
Figure 1 Mutational genomic landscape in The Cancer Genome Atlas gastric cancer cohort.
A: Variant categories; B: Variant types; C: Single nucleotide variant types; D: Number of variants per sample; E: Summary of variant categories; F: Top 10 mutated genes. G: Waterfall map of the top 30 mutated genes and their status of variant categories. Various colors with annotations at the bottom represent the different variant categories while the barplot above the legend exhibits the value of tumor mutational burden. SNV: Single nucleotide variants; SNP: Single nucleotide polymorphism; INS: Insertion; DEL: Deletion; TCGA: The Cancer Genome Atlas.
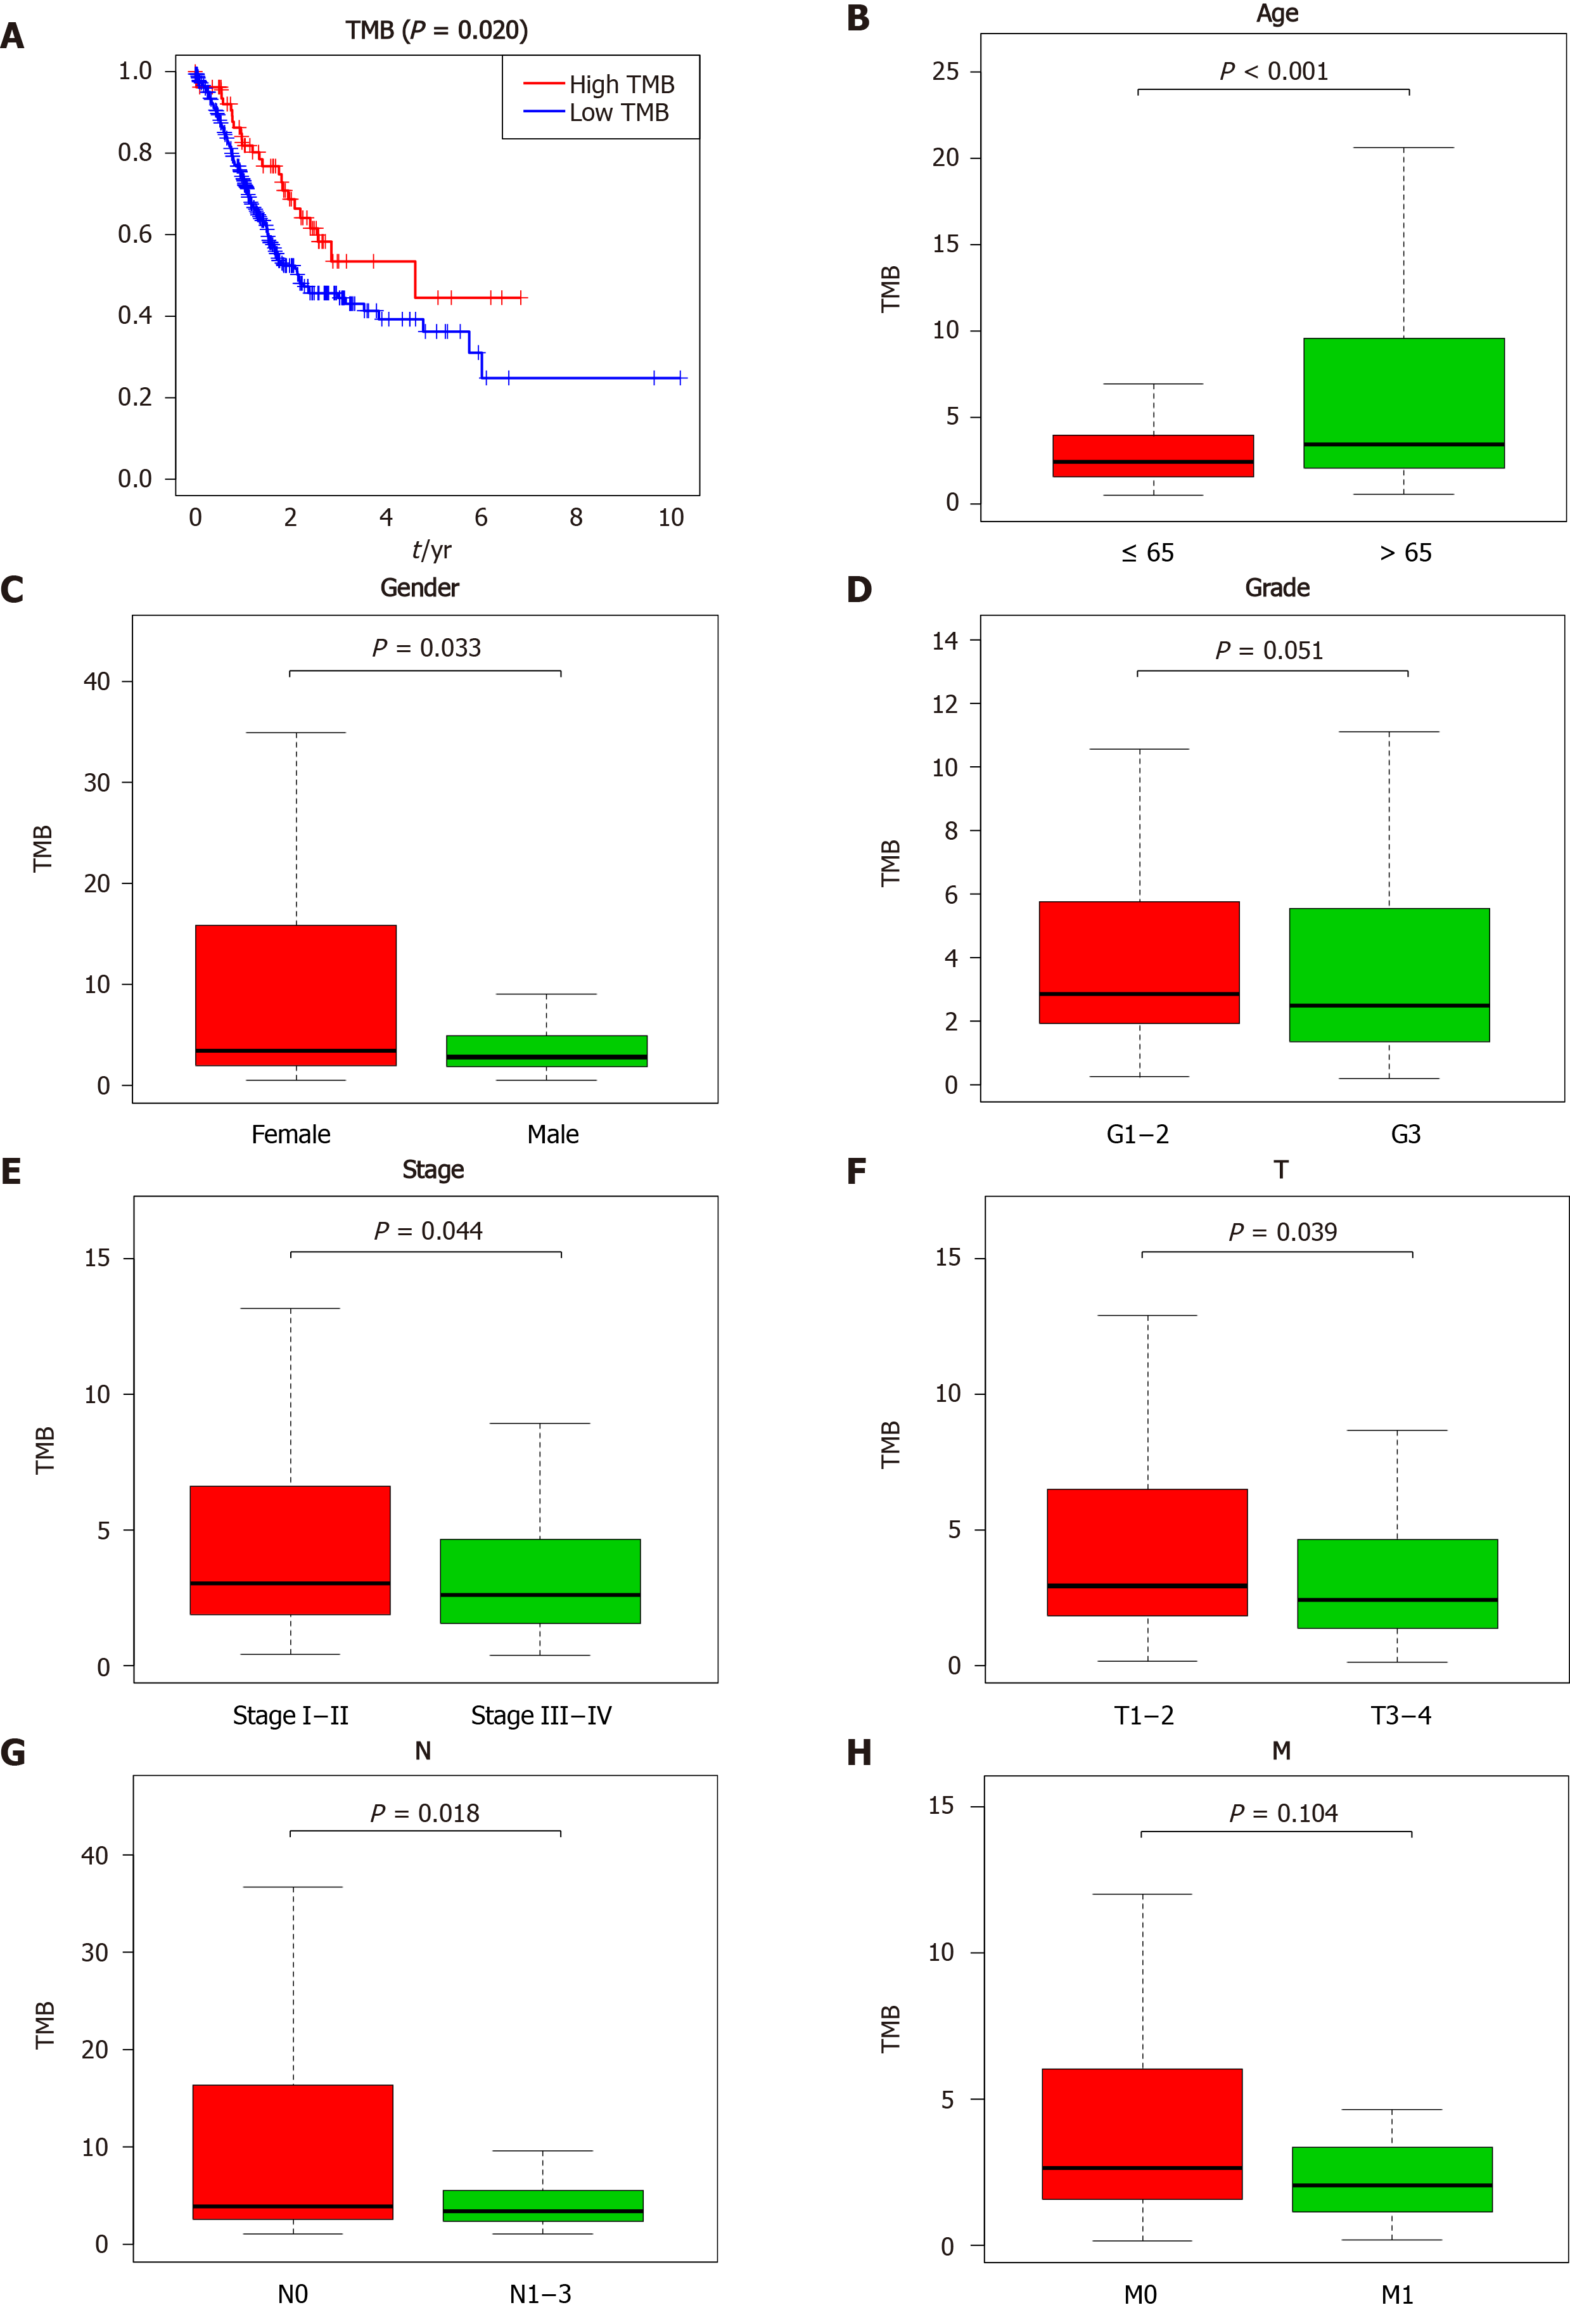
Figure 2 Clinical significance of tumor mutation burden in gastric cancer patients.
A: Survival analysis to explore the overall survival of gastric cancer patients between the high and low tumor mutation burden groups; B-H: Correlation between tumor mutation burden values and clinical characteristics in gastric cancer. TMB: Tumor mutation burden.
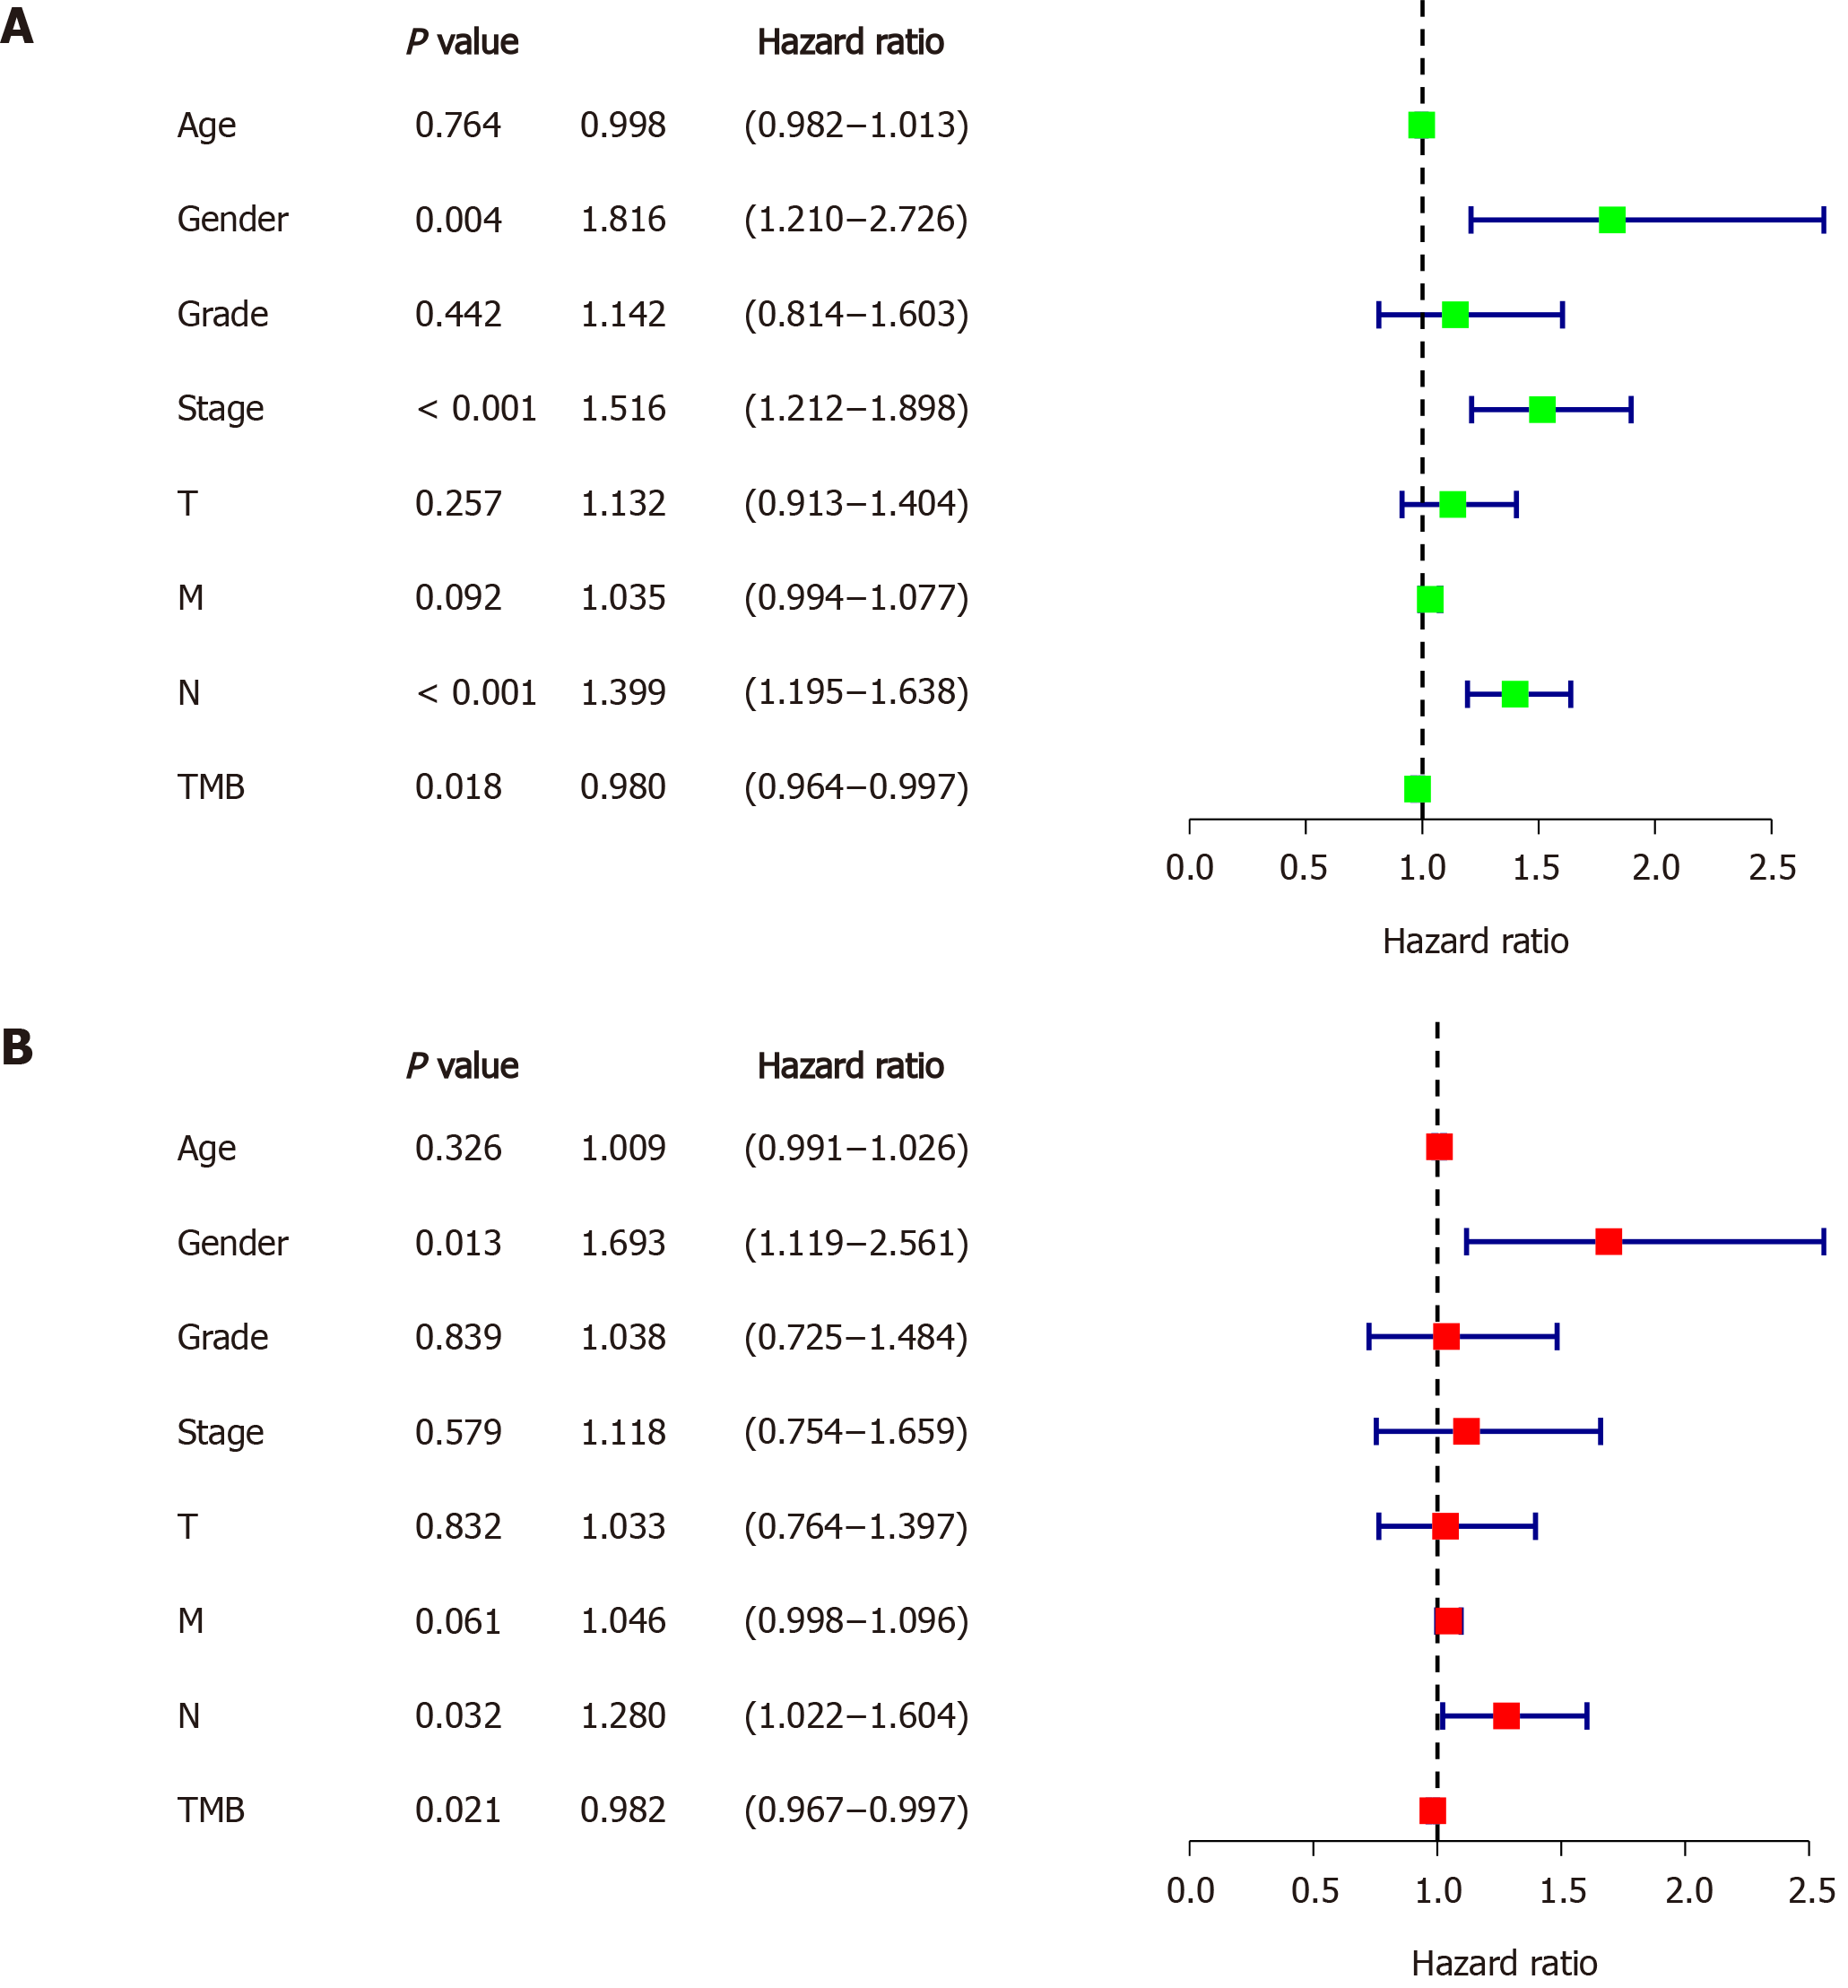
Figure 3 Identifying independent prognostic parameters in gastric cancer.
A: Forrest plot of the univariate Cox regression analysis in gastric cancer; B: Forrest plot of the multivariate Cox regression analysis in gastric cancer. Solid squares indicate the hazard ratios of death, and close-ended horizontal lines represent the 95% confidence intervals. TMB: Tumor mutation burden.
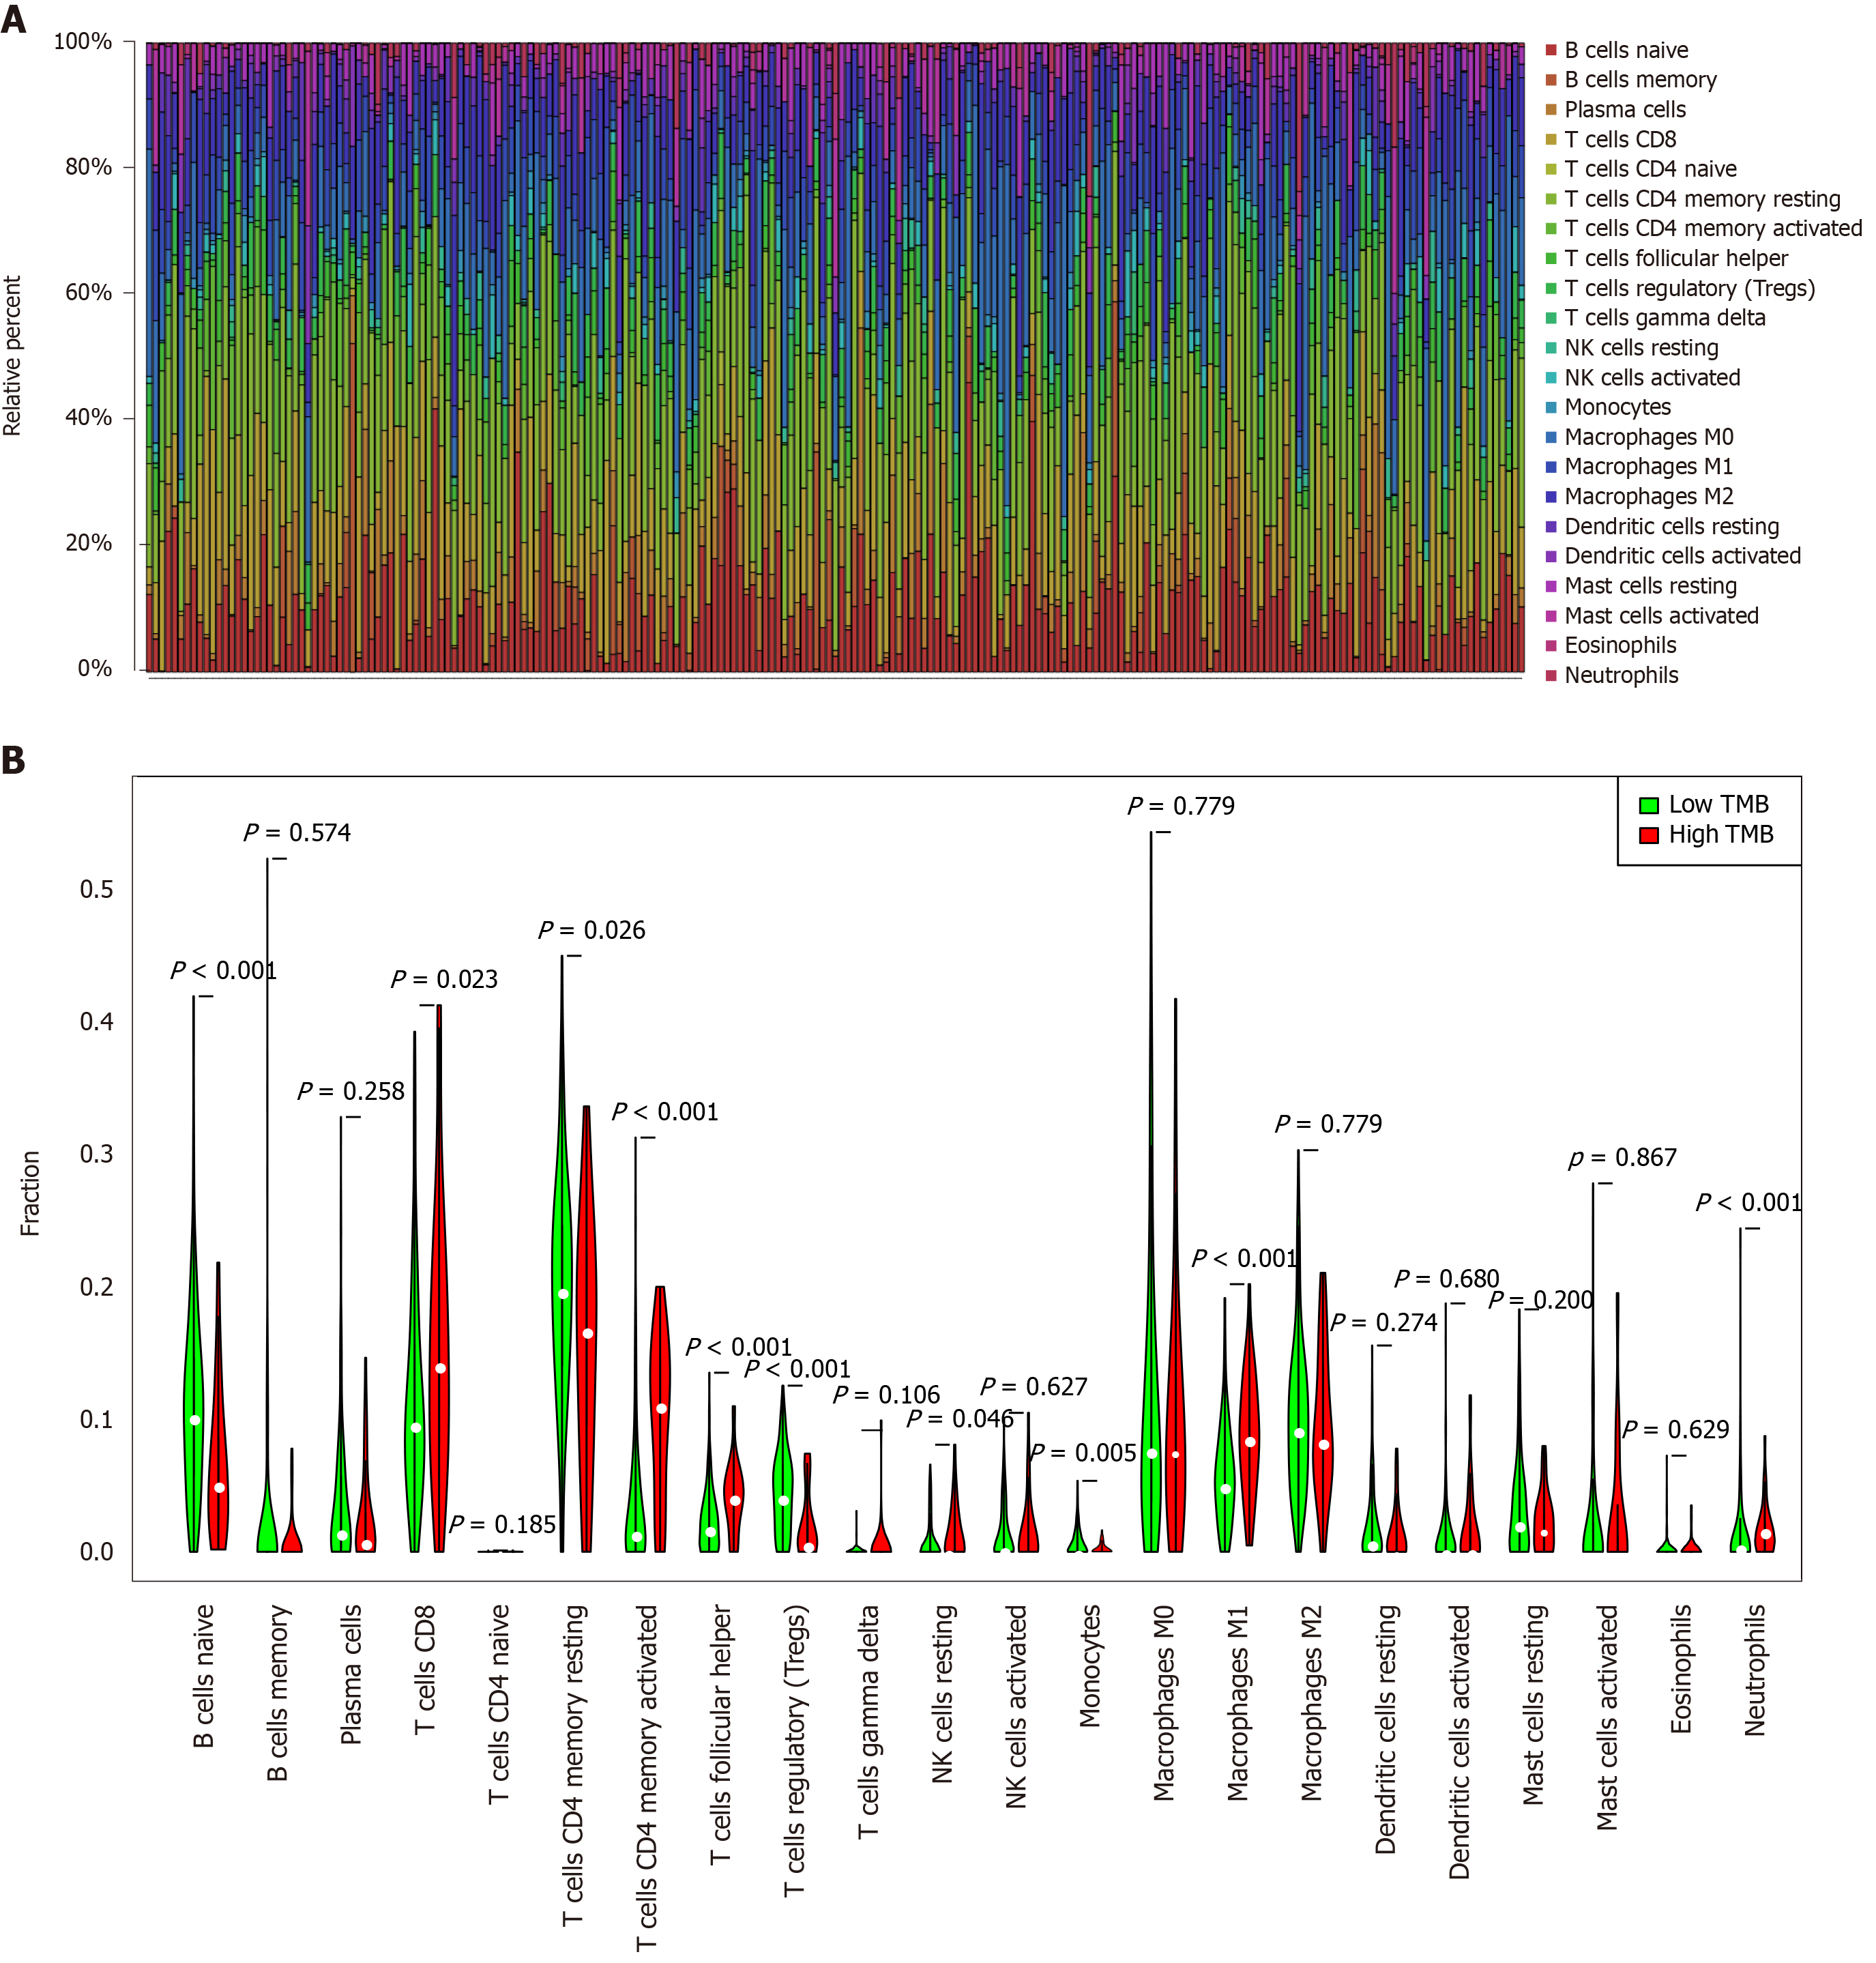
Figure 4 Quantitative analysis of immune infiltration in two groups based on tumor mutation burden status.
A: The box plot of 22 tumor-infiltrating immune cells in each sample; B: Expression comparison of 22 tumor-infiltrating immune cells between the high tumor mutation burden (TMB) and low TMB groups. TMB: Tumor mutation burden.
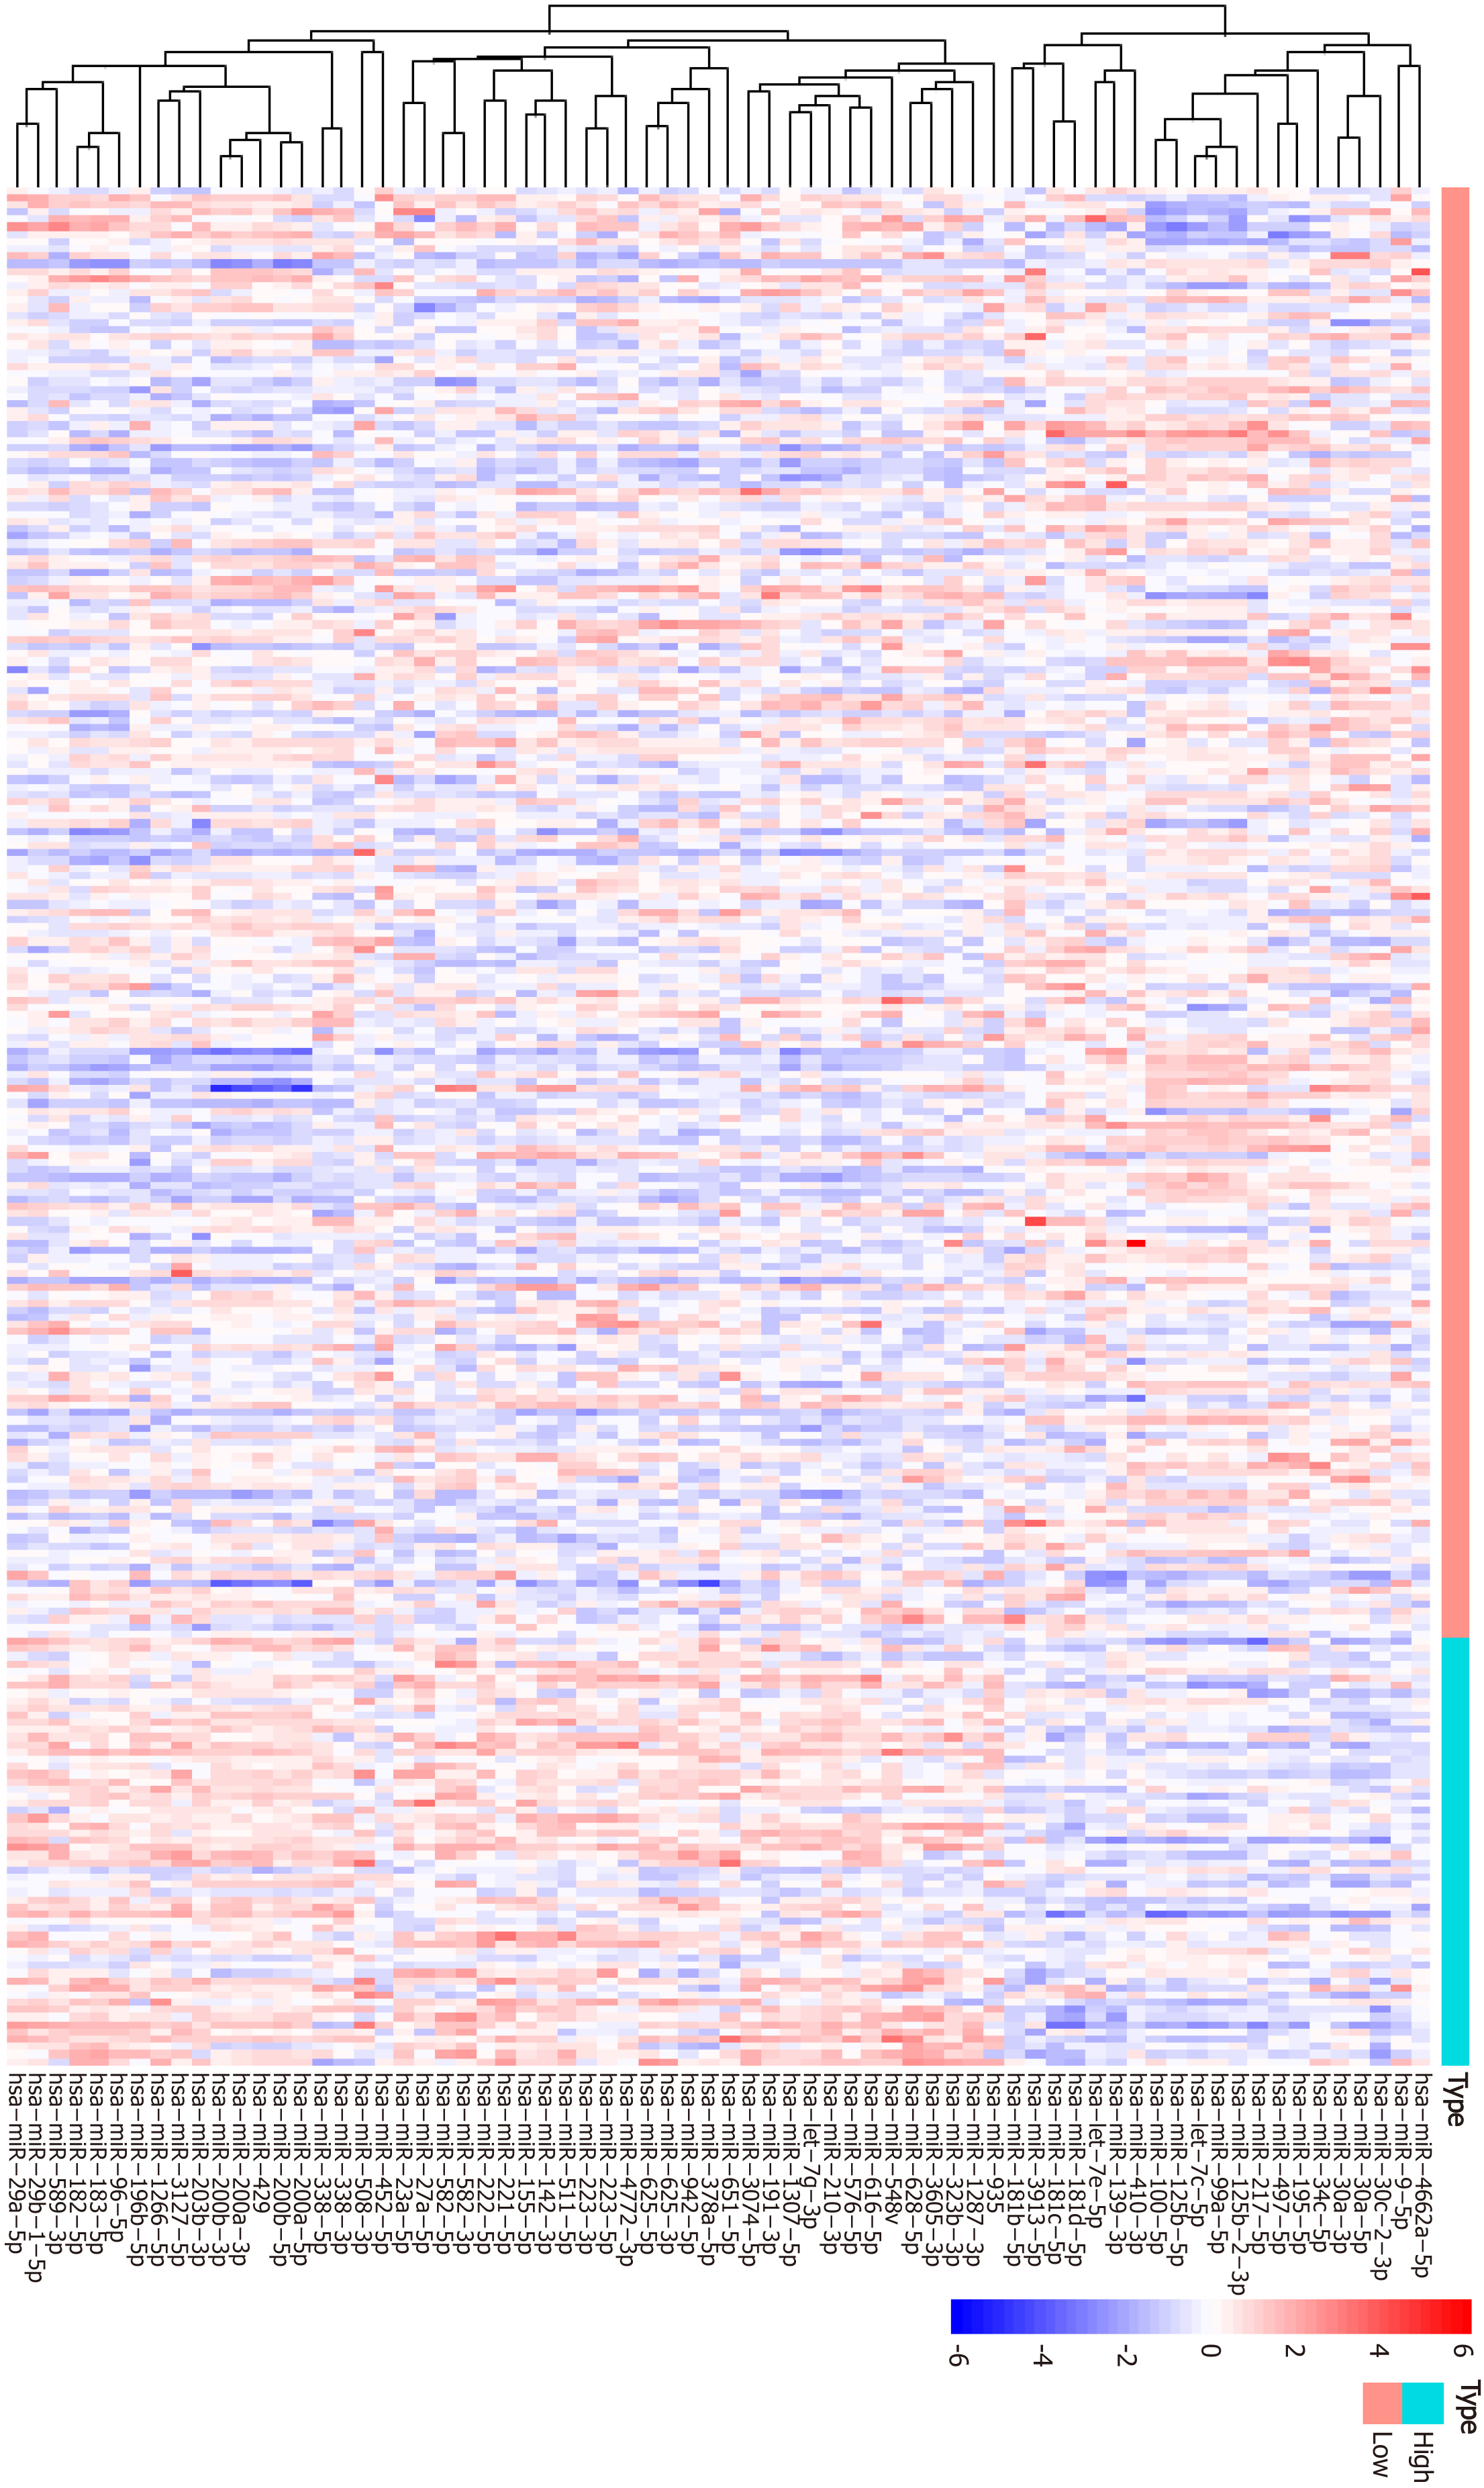
Figure 5 Heatmap of top 50 differentially expressed miRNAs between the high and low tumor mutation burden groups.
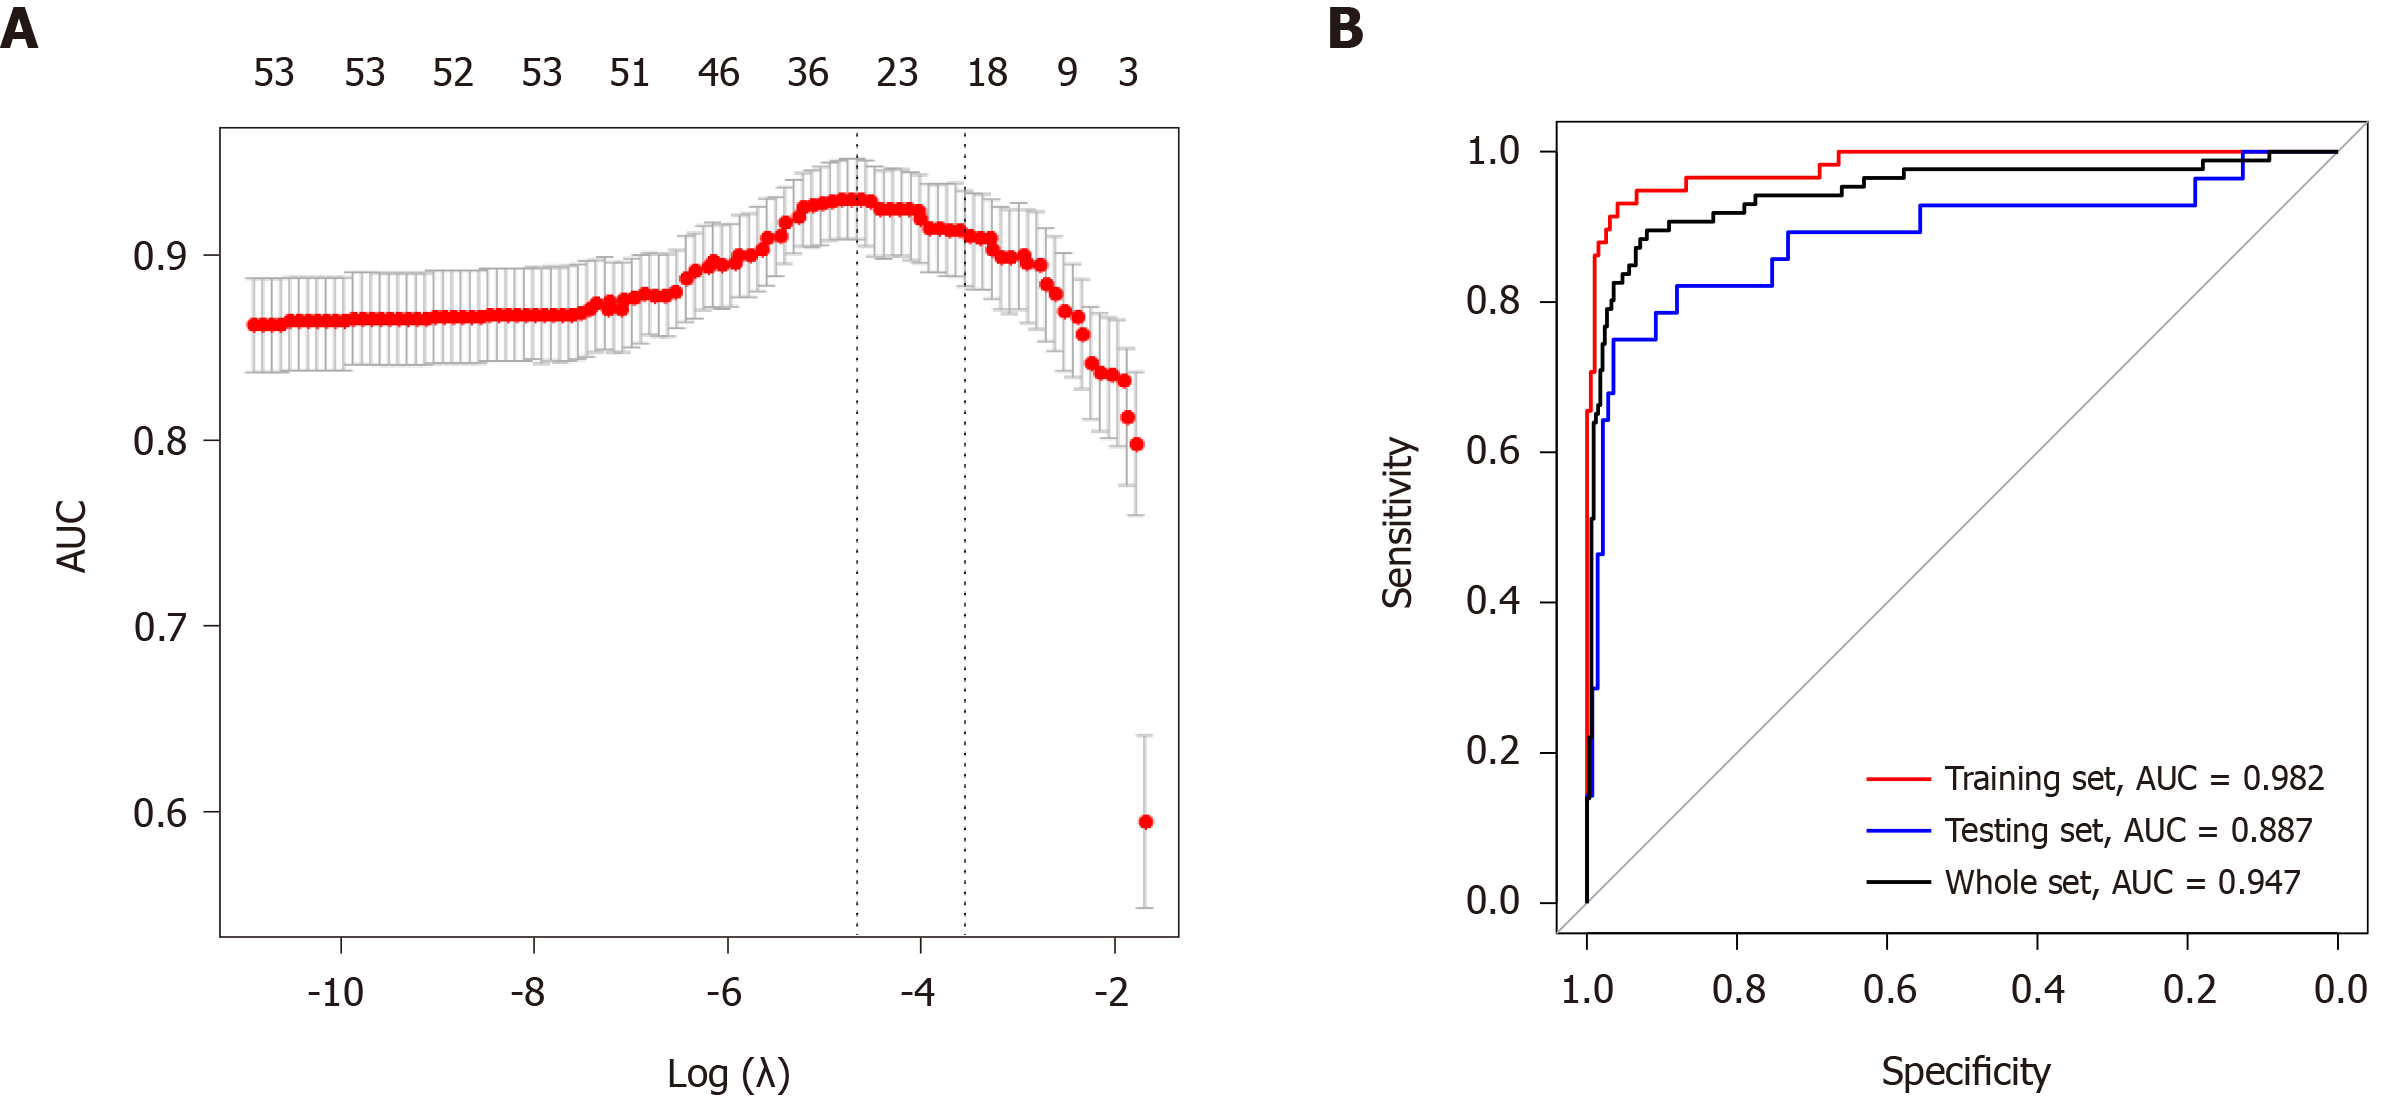
Figure 6 Least absolute shrinkage and selection operator analysis for prognostic features screening and receiver operating characteristic curves for the miRNA-based signature.
A: Least absolute shrinkage and selection operator regression with ten-fold cross-validation obtained 23 prognostic parameters using minimum lambda value; B: Receiver operating characteristic analysis showed that the areas under curves for the training set, the testing set, and the whole set were 0.982, 0.887, and 0.947, respectively. λ: Lambda; AUC: Area under curve.
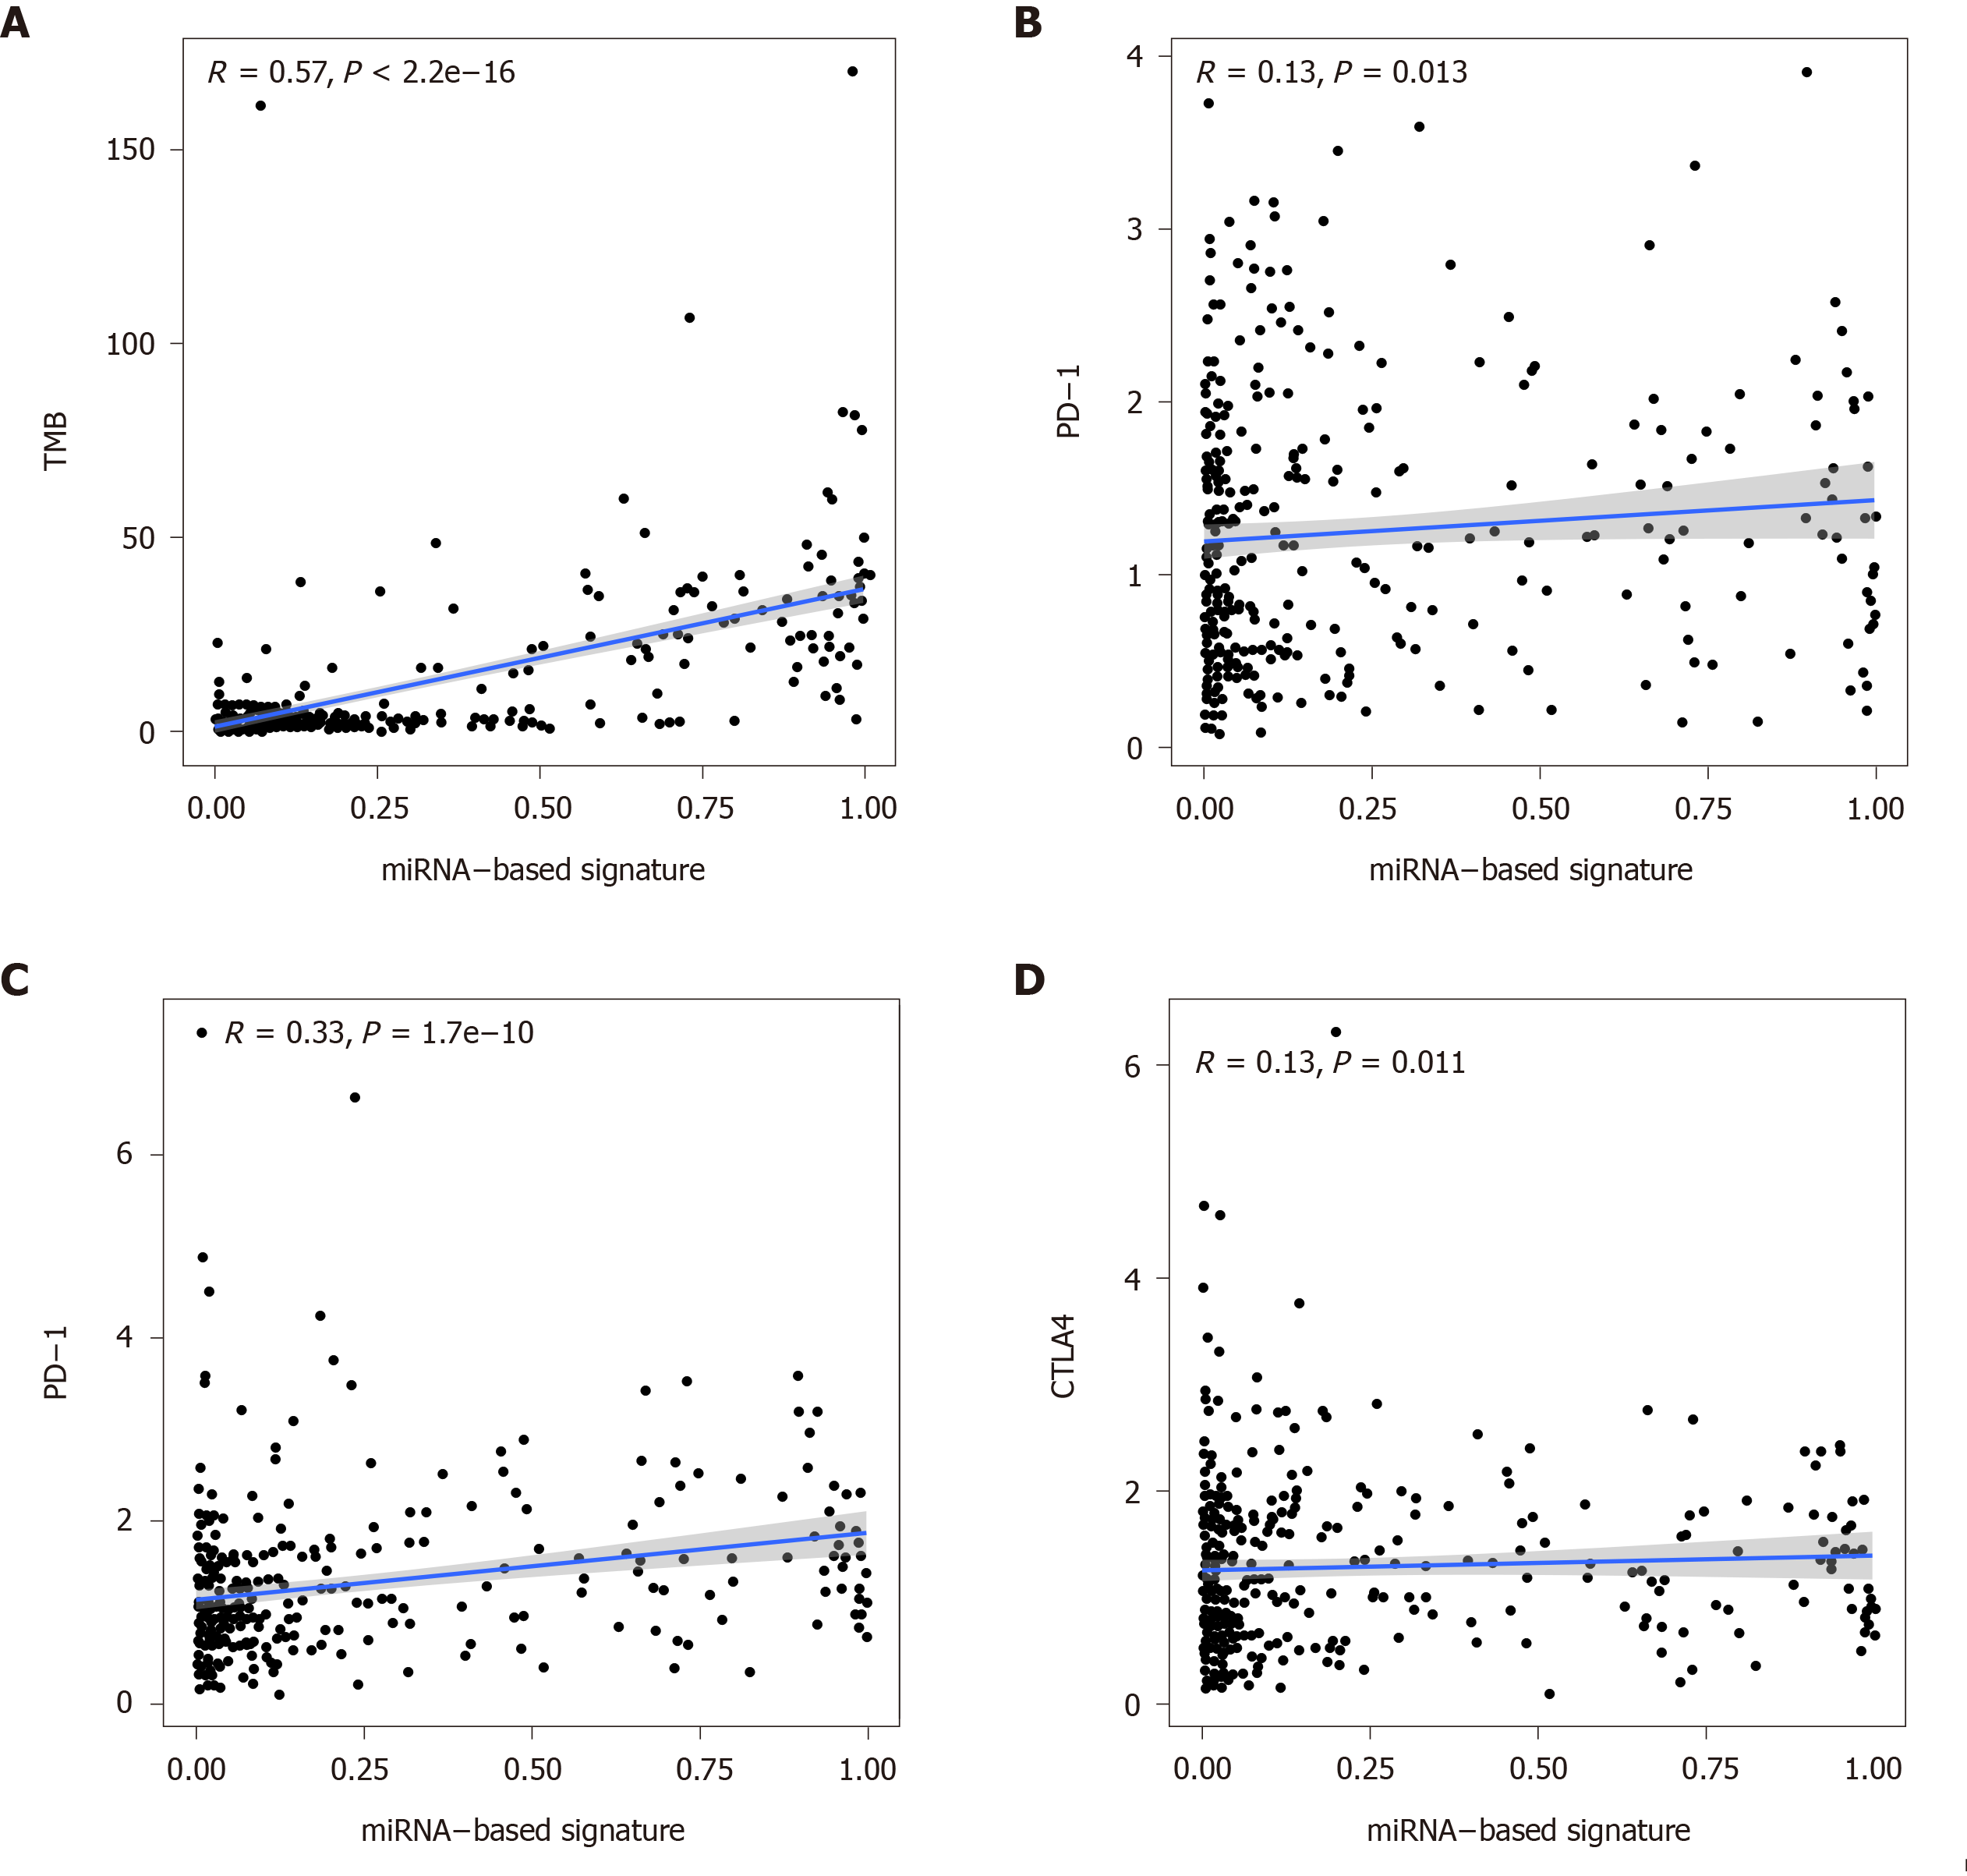
Figure 7 Correlation of the miRNA-based signature with tumor mutation burden values and immune checkpoint molecules (programmed death-1, programmed death ligand-1, and cytotoxic T lymphocyte associated antigen 4).
TMB: Tumor mutation burden; PD-1: Programmed death-1; PD-L1: Programmed death ligand-1; CTLA4: Cytotoxic T lymphocyte associated antigen 4.
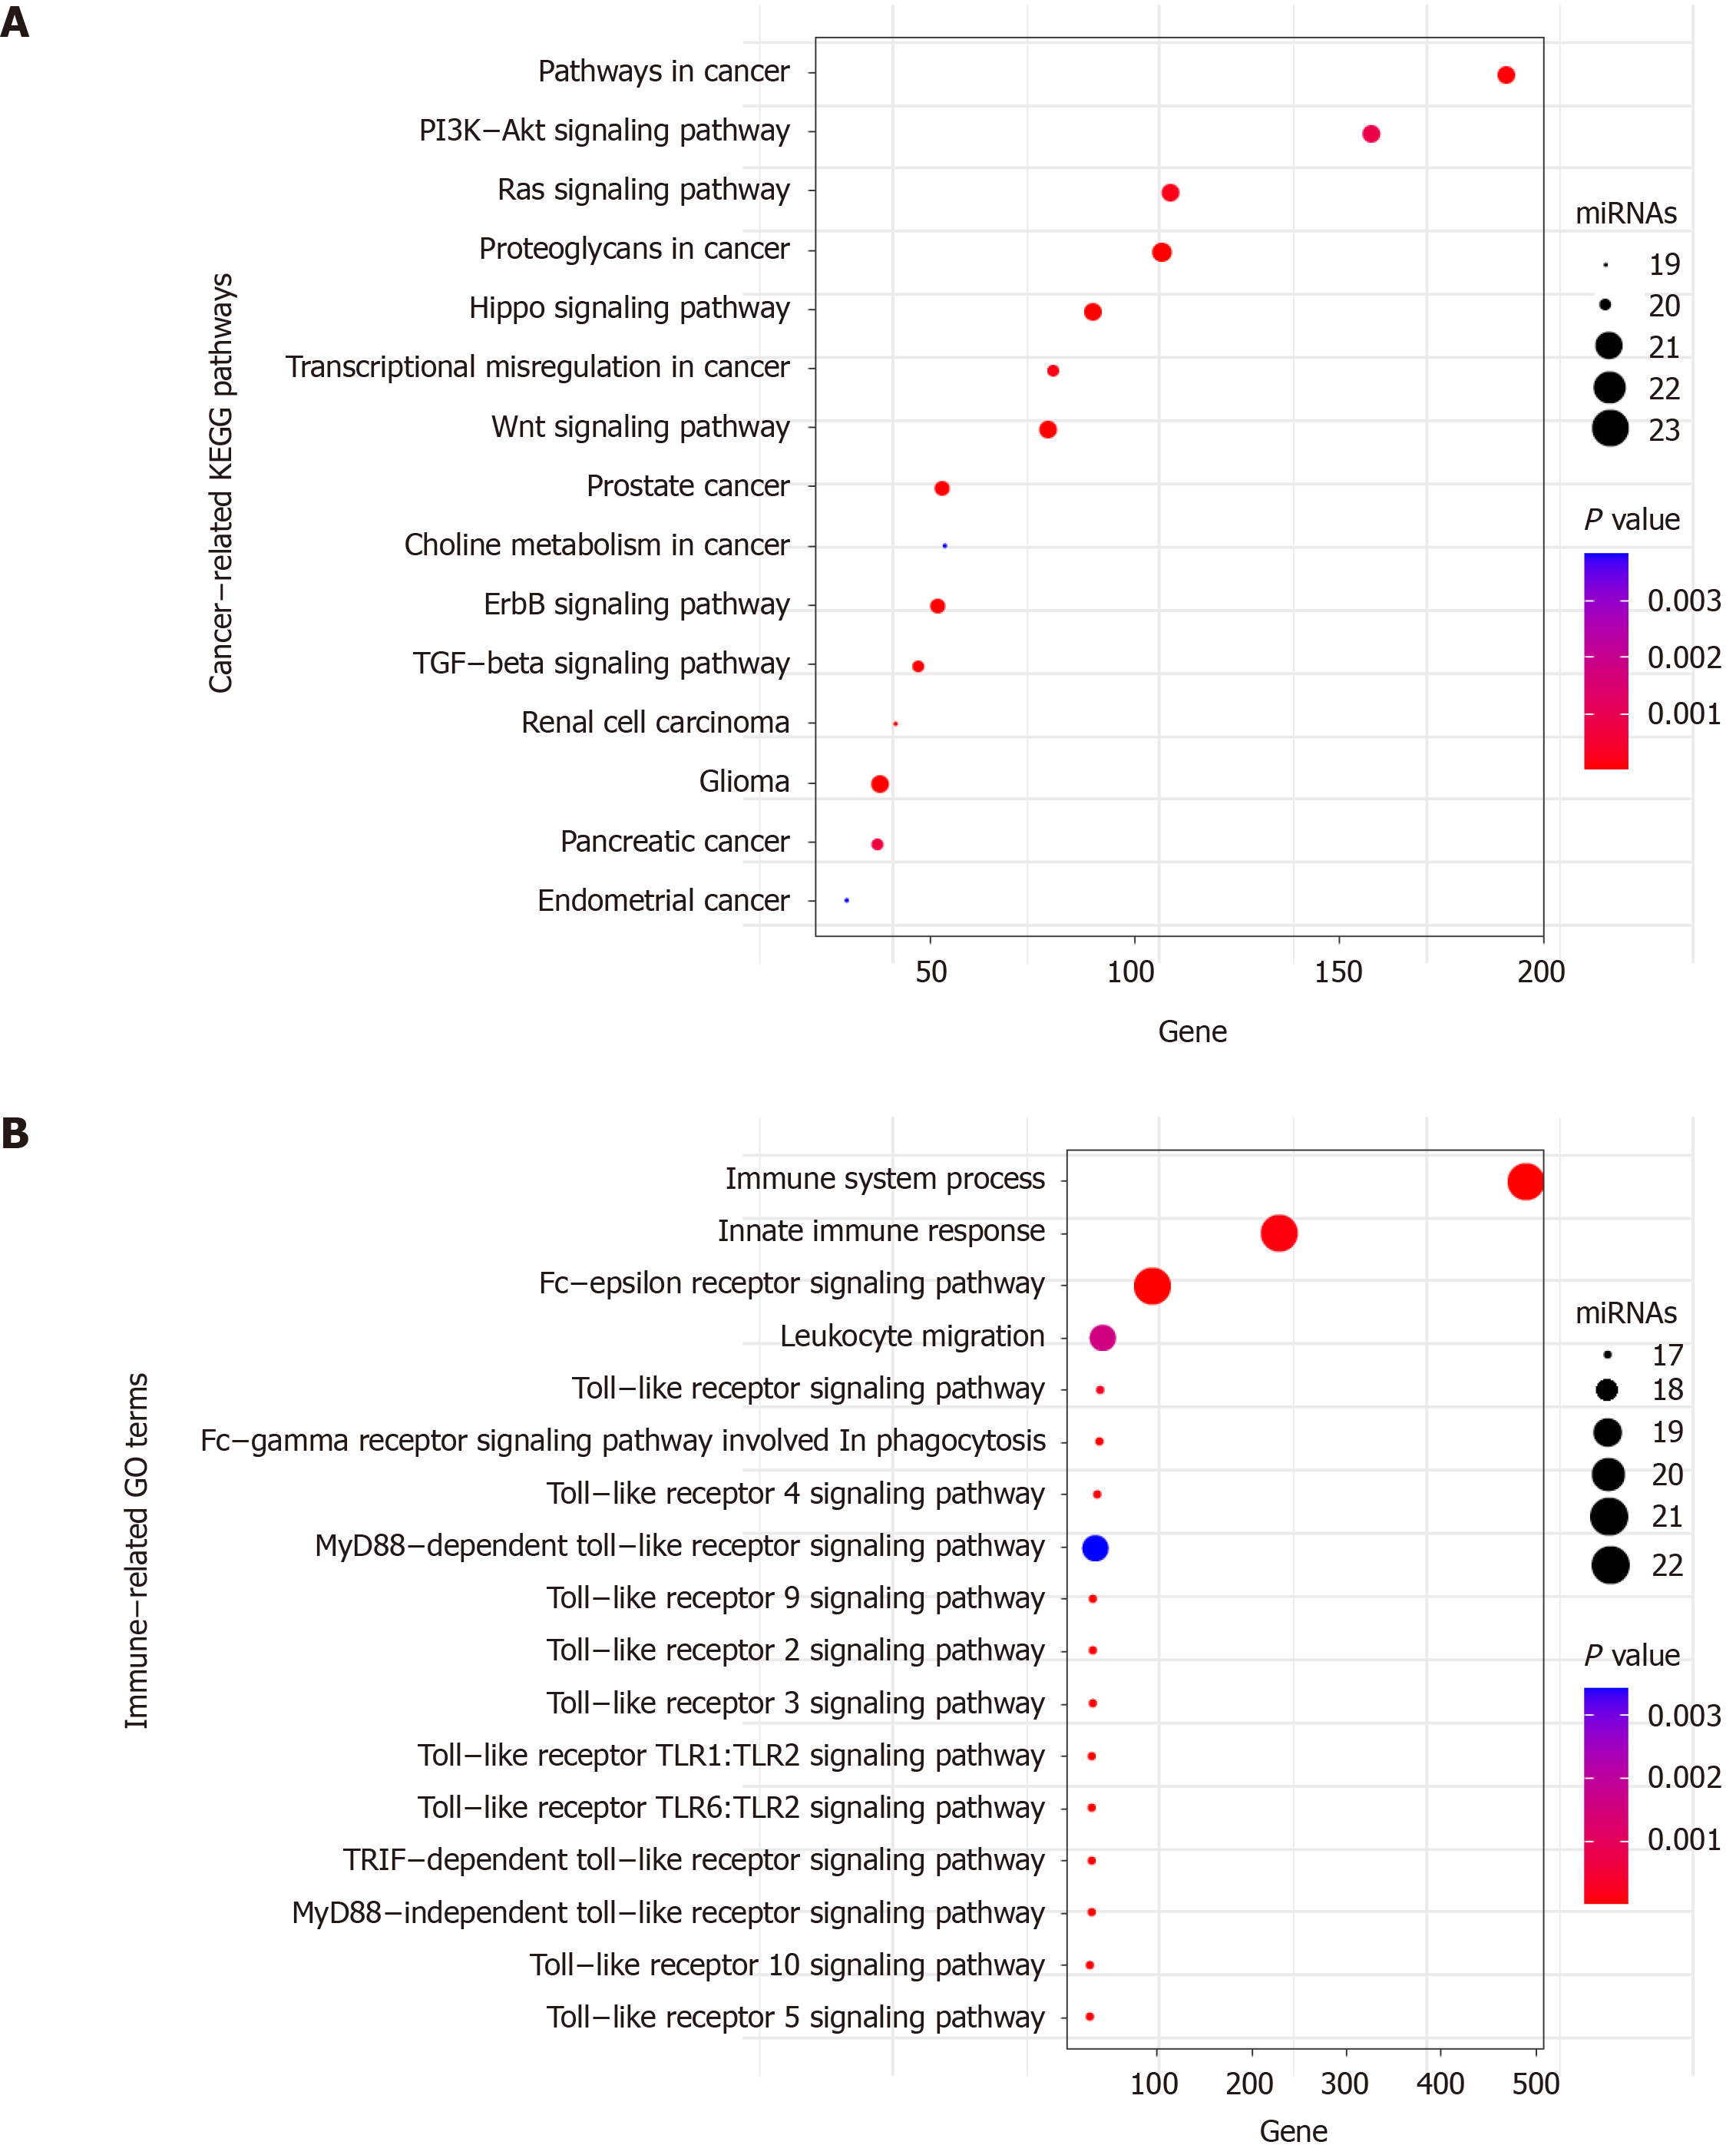
Figure 8 Functional enrichment analysis of the 23 miRNAs.
A: Significant enriched cancer-related KEGG pathways; B: Significant enriched immune-related GO terms. X axis refers to the number of targeted genes. Y axis refers to GO or KEGG entry name. Bubble color refers to the enrichment P value. Bubble size refers to the number of targeting miRNAs.
- Citation: Zhao DY, Sun XZ, Yao SK. Mining The Cancer Genome Atlas database for tumor mutation burden and its clinical implications in gastric cancer. World J Gastrointest Oncol 2021; 13(1): 37-57
- URL: https://www.wjgnet.com/1948-5204/full/v13/i1/37.htm
- DOI: https://dx.doi.org/10.4251/wjgo.v13.i1.37


