Copyright
©The Author(s) 2020.
World J Gastrointest Oncol. Dec 15, 2020; 12(12): 1443-1455
Published online Dec 15, 2020. doi: 10.4251/wjgo.v12.i12.1443
Published online Dec 15, 2020. doi: 10.4251/wjgo.v12.i12.1443
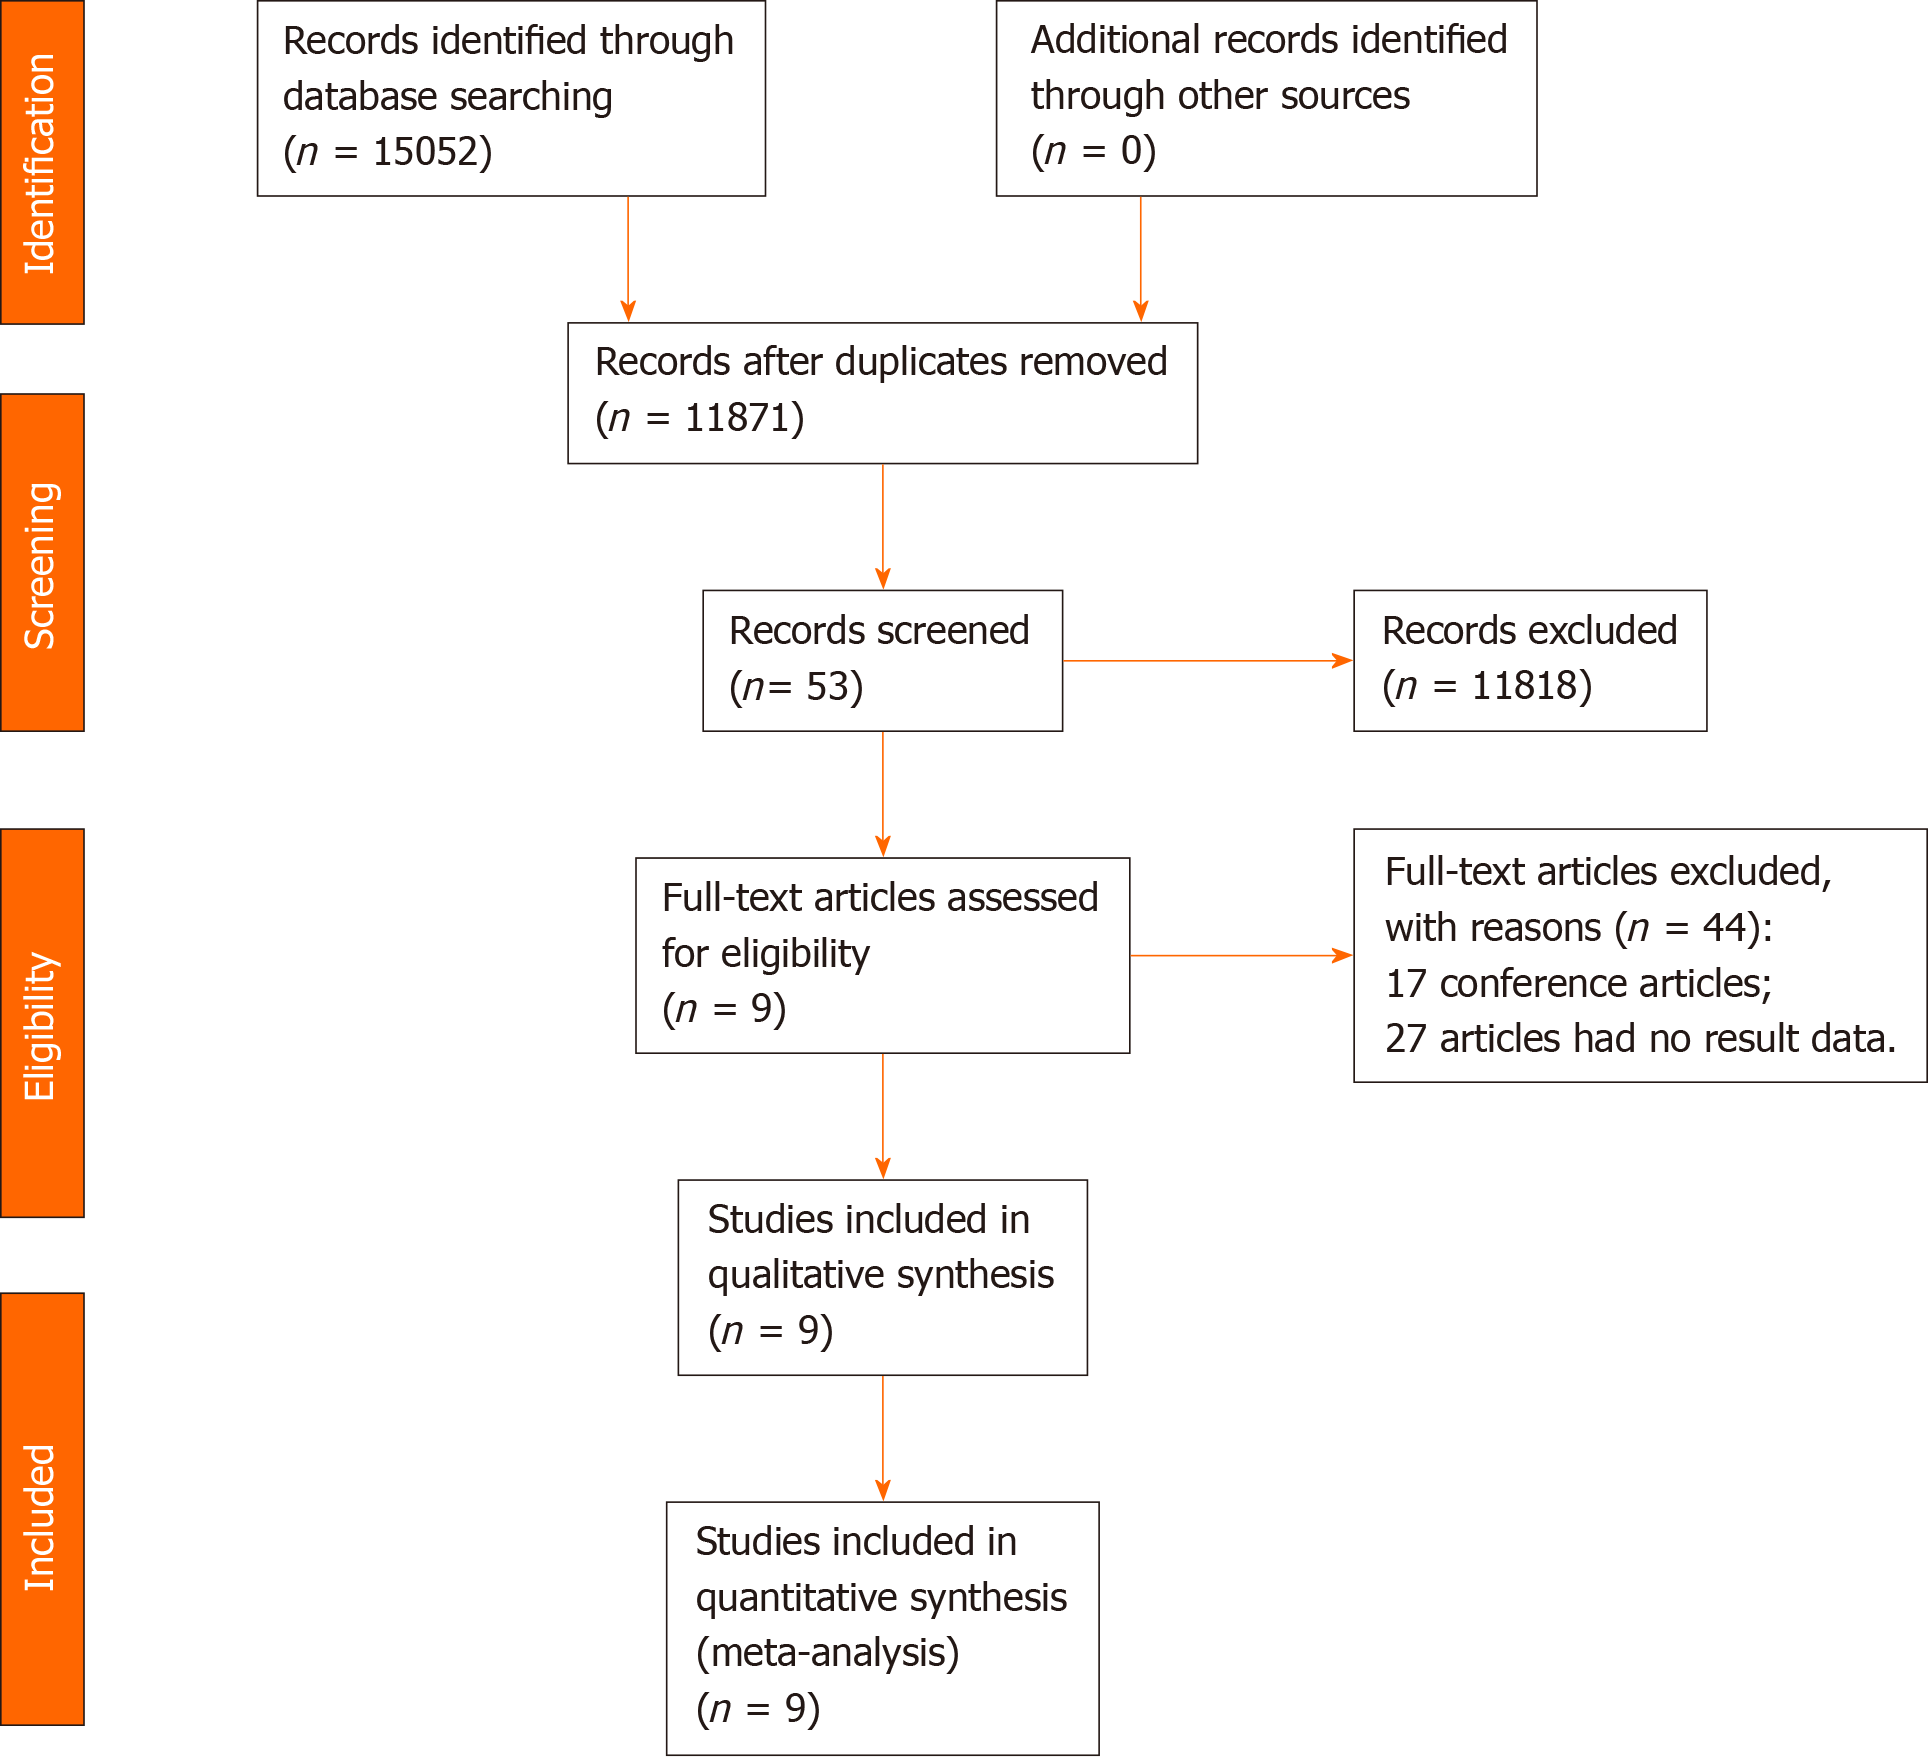
Figure 1 Flowchart of search strategy and study selection.
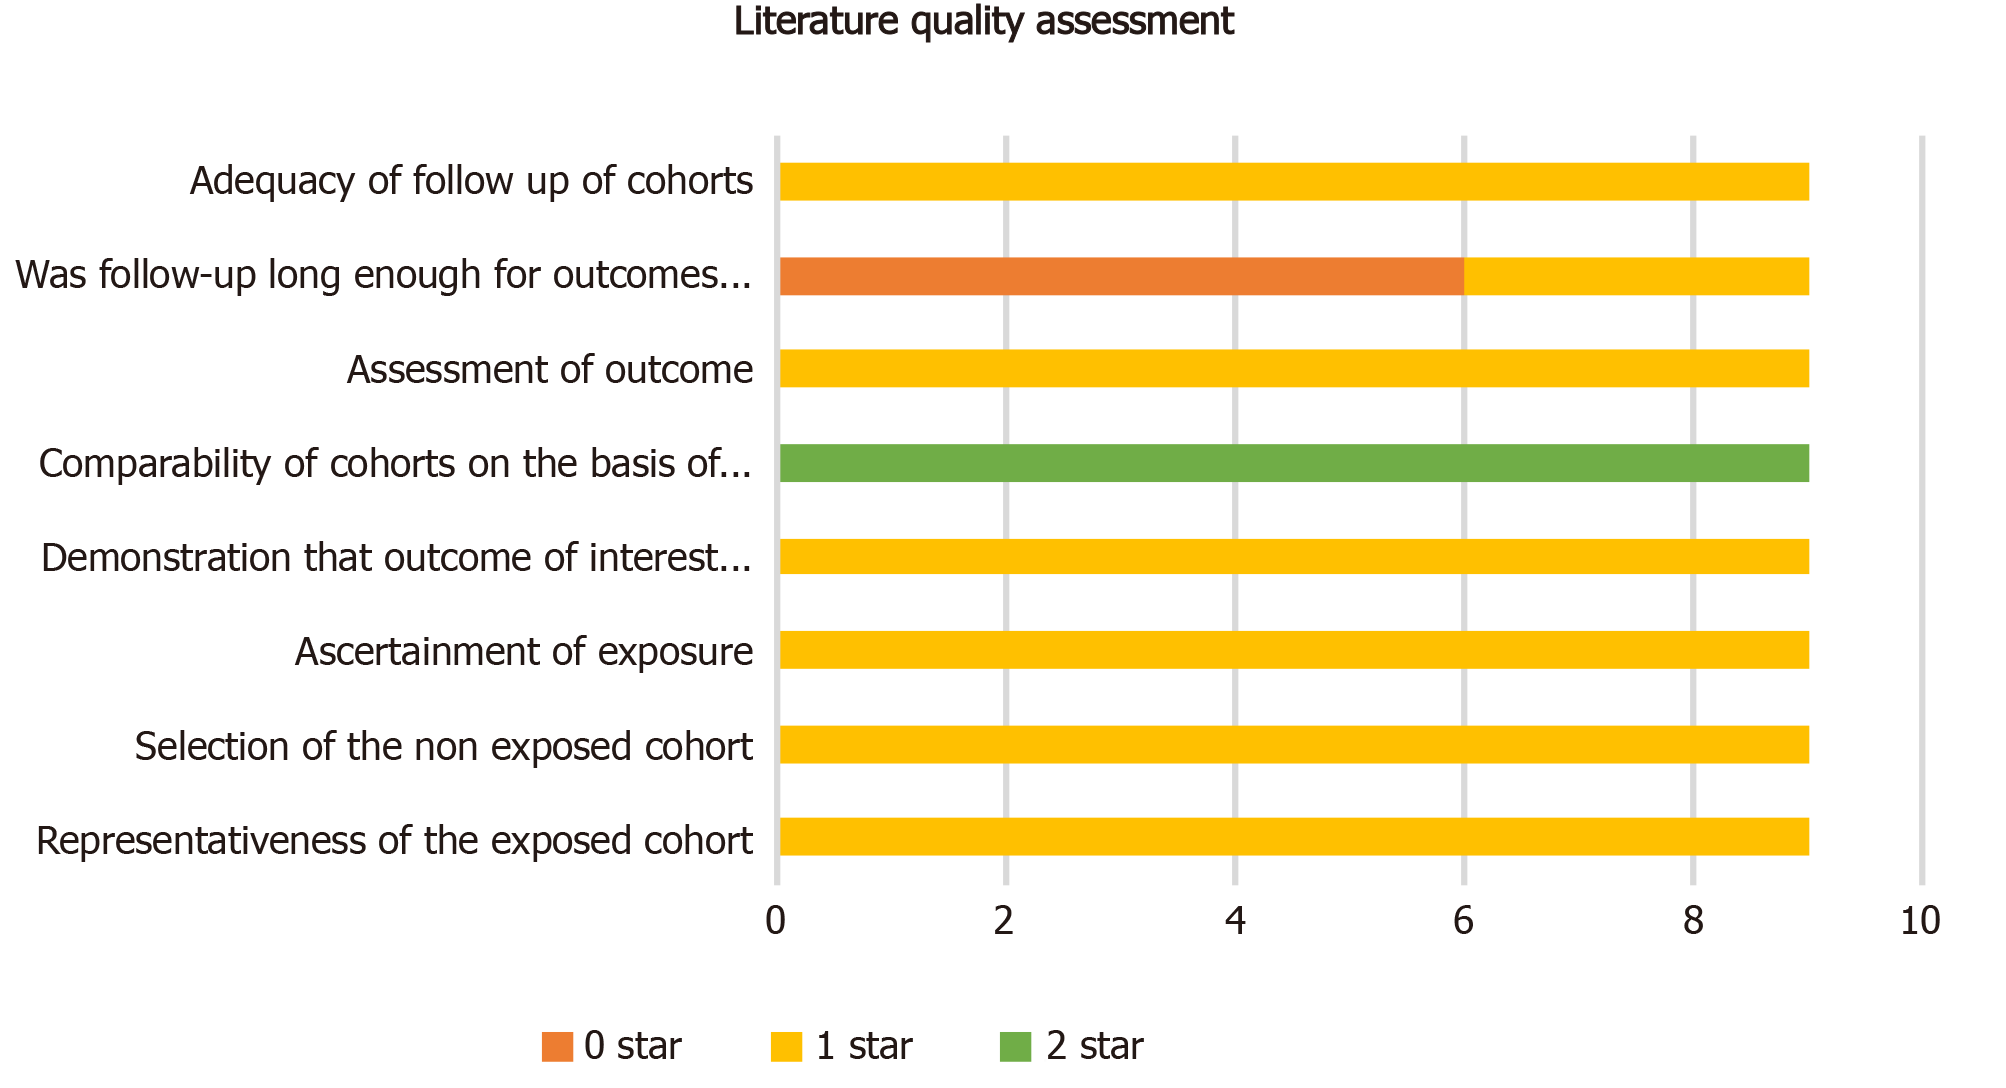
Figure 2 Literature quality assessment based on the Newcastle-Ottawa Scale.
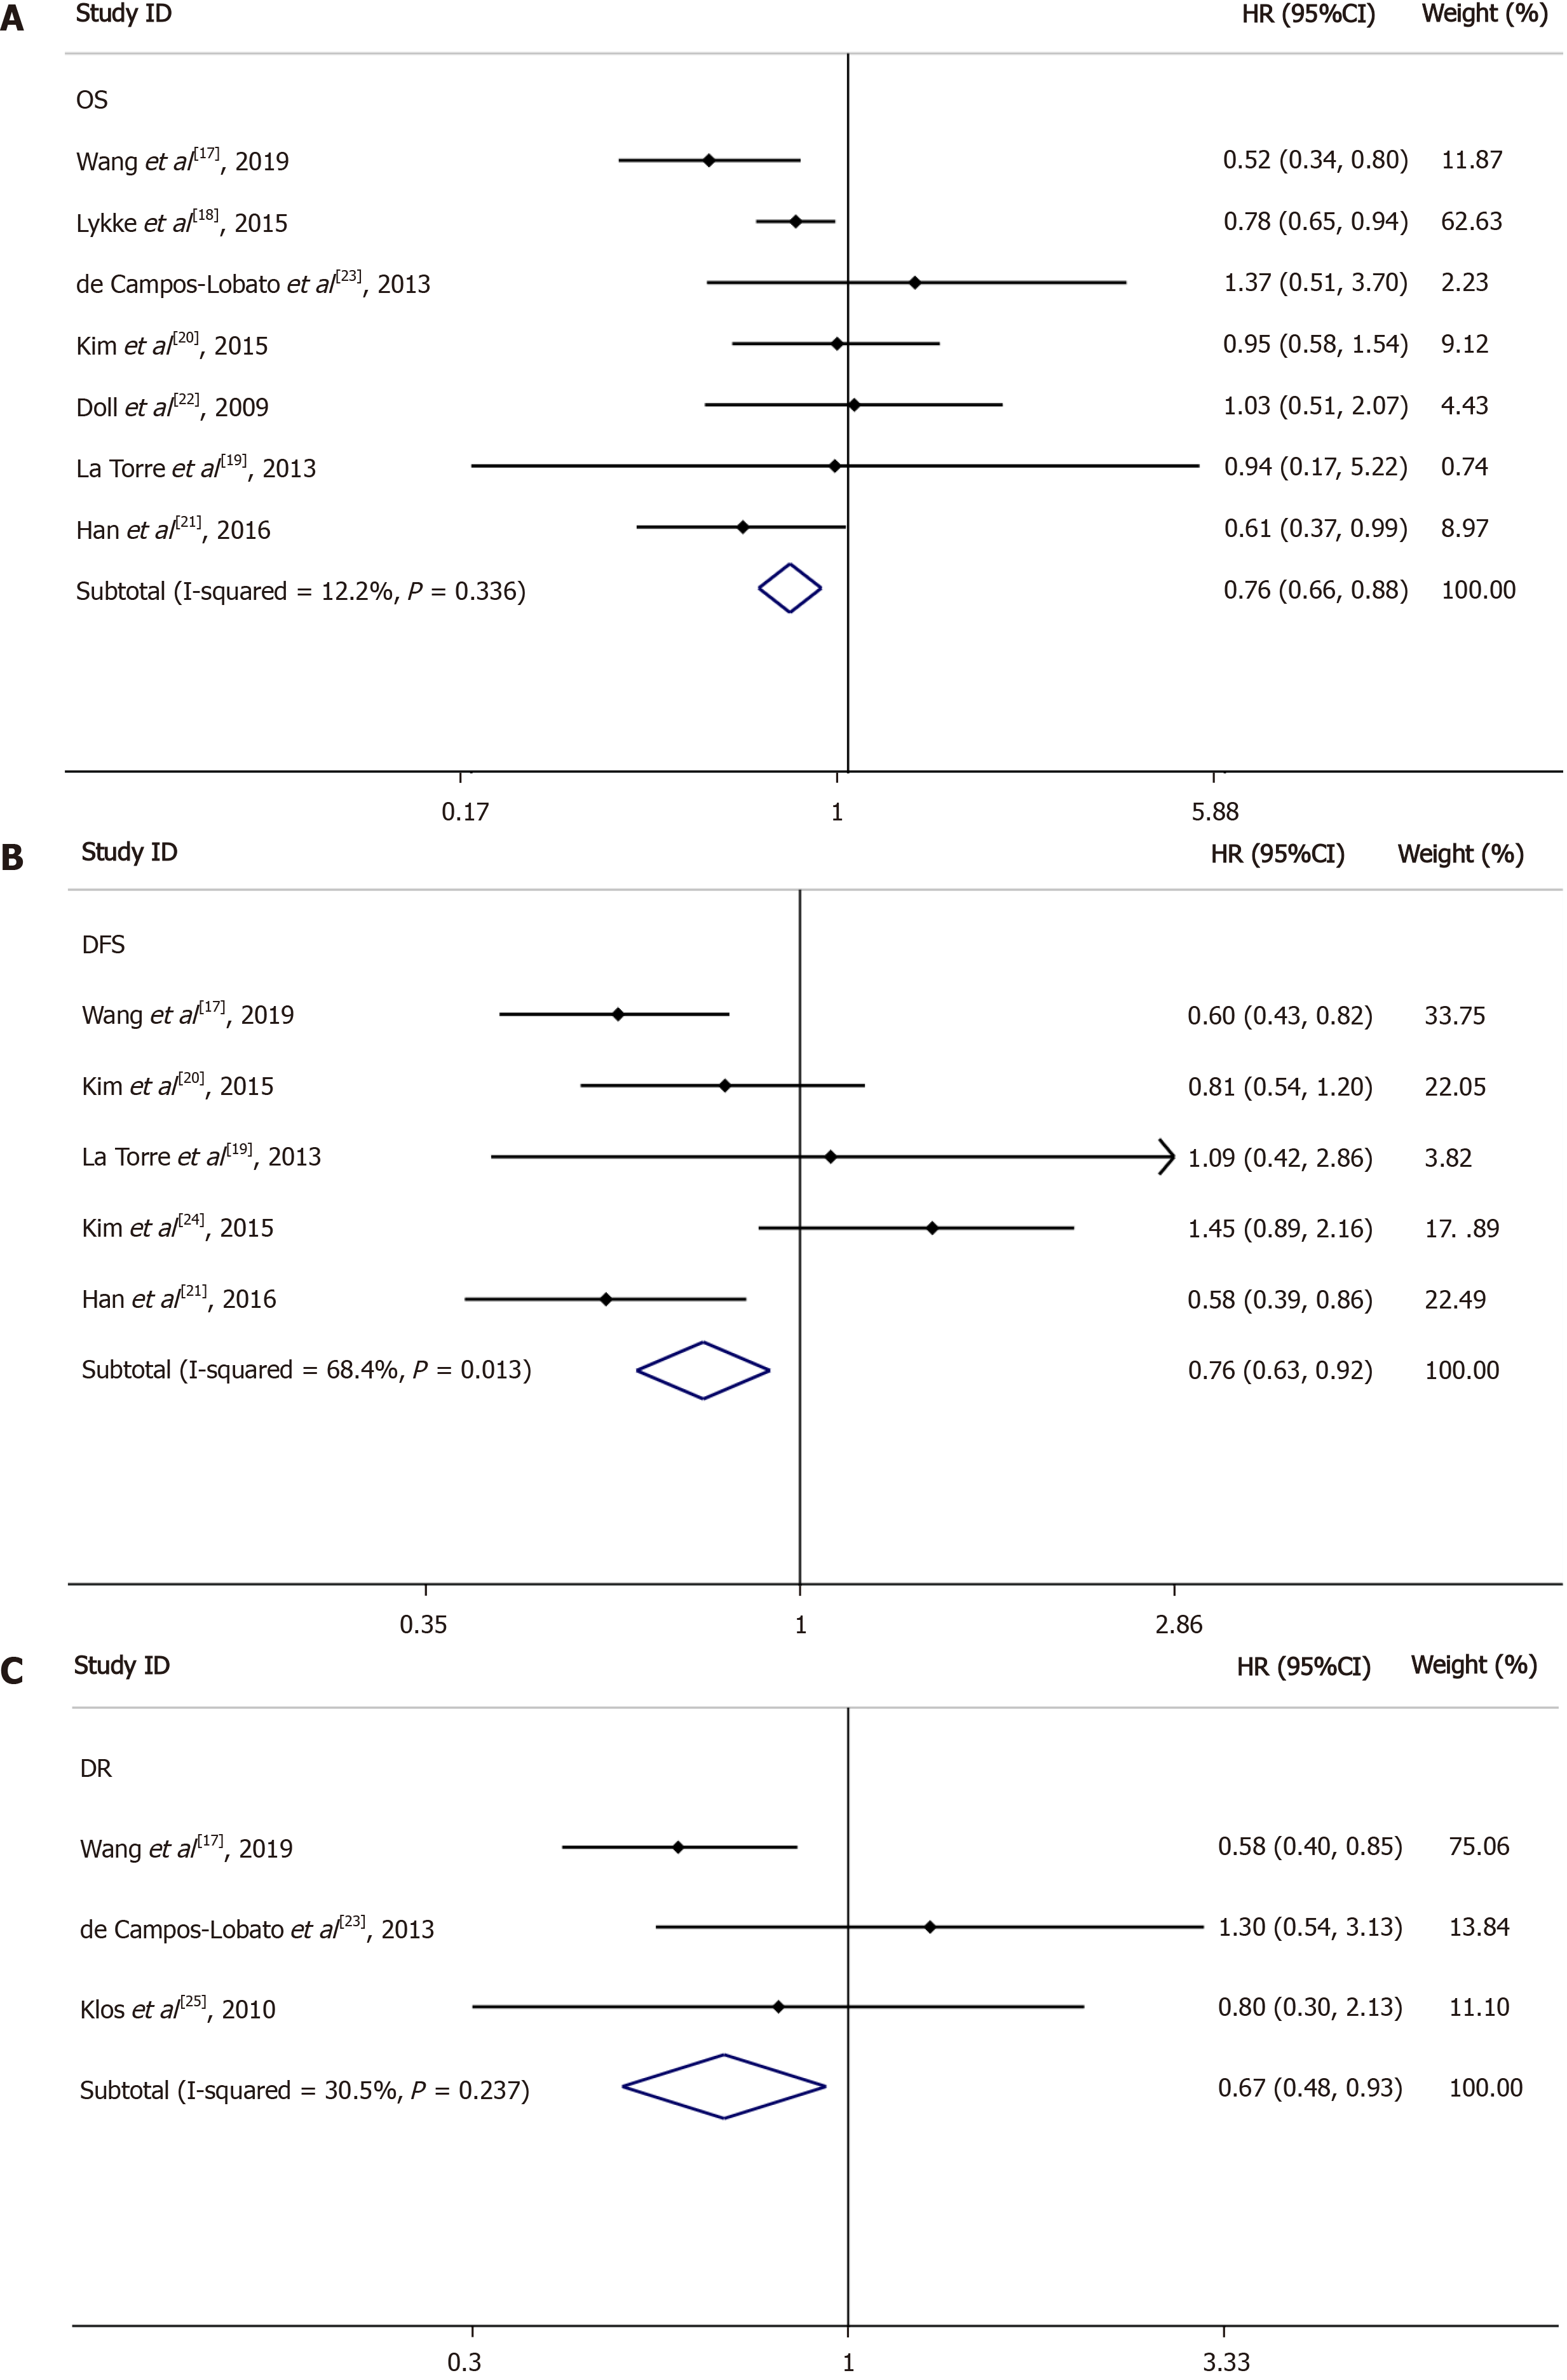
Figure 3 Forest plots for the meta-analyses.
A: Overall survival; B: Disease-free survival; C: Distant recurrence. HR: Hazard ratio; CI: Confidence interval; OS: Overall survival; DFS: Disease-free survival; DR: Distant recurrence.
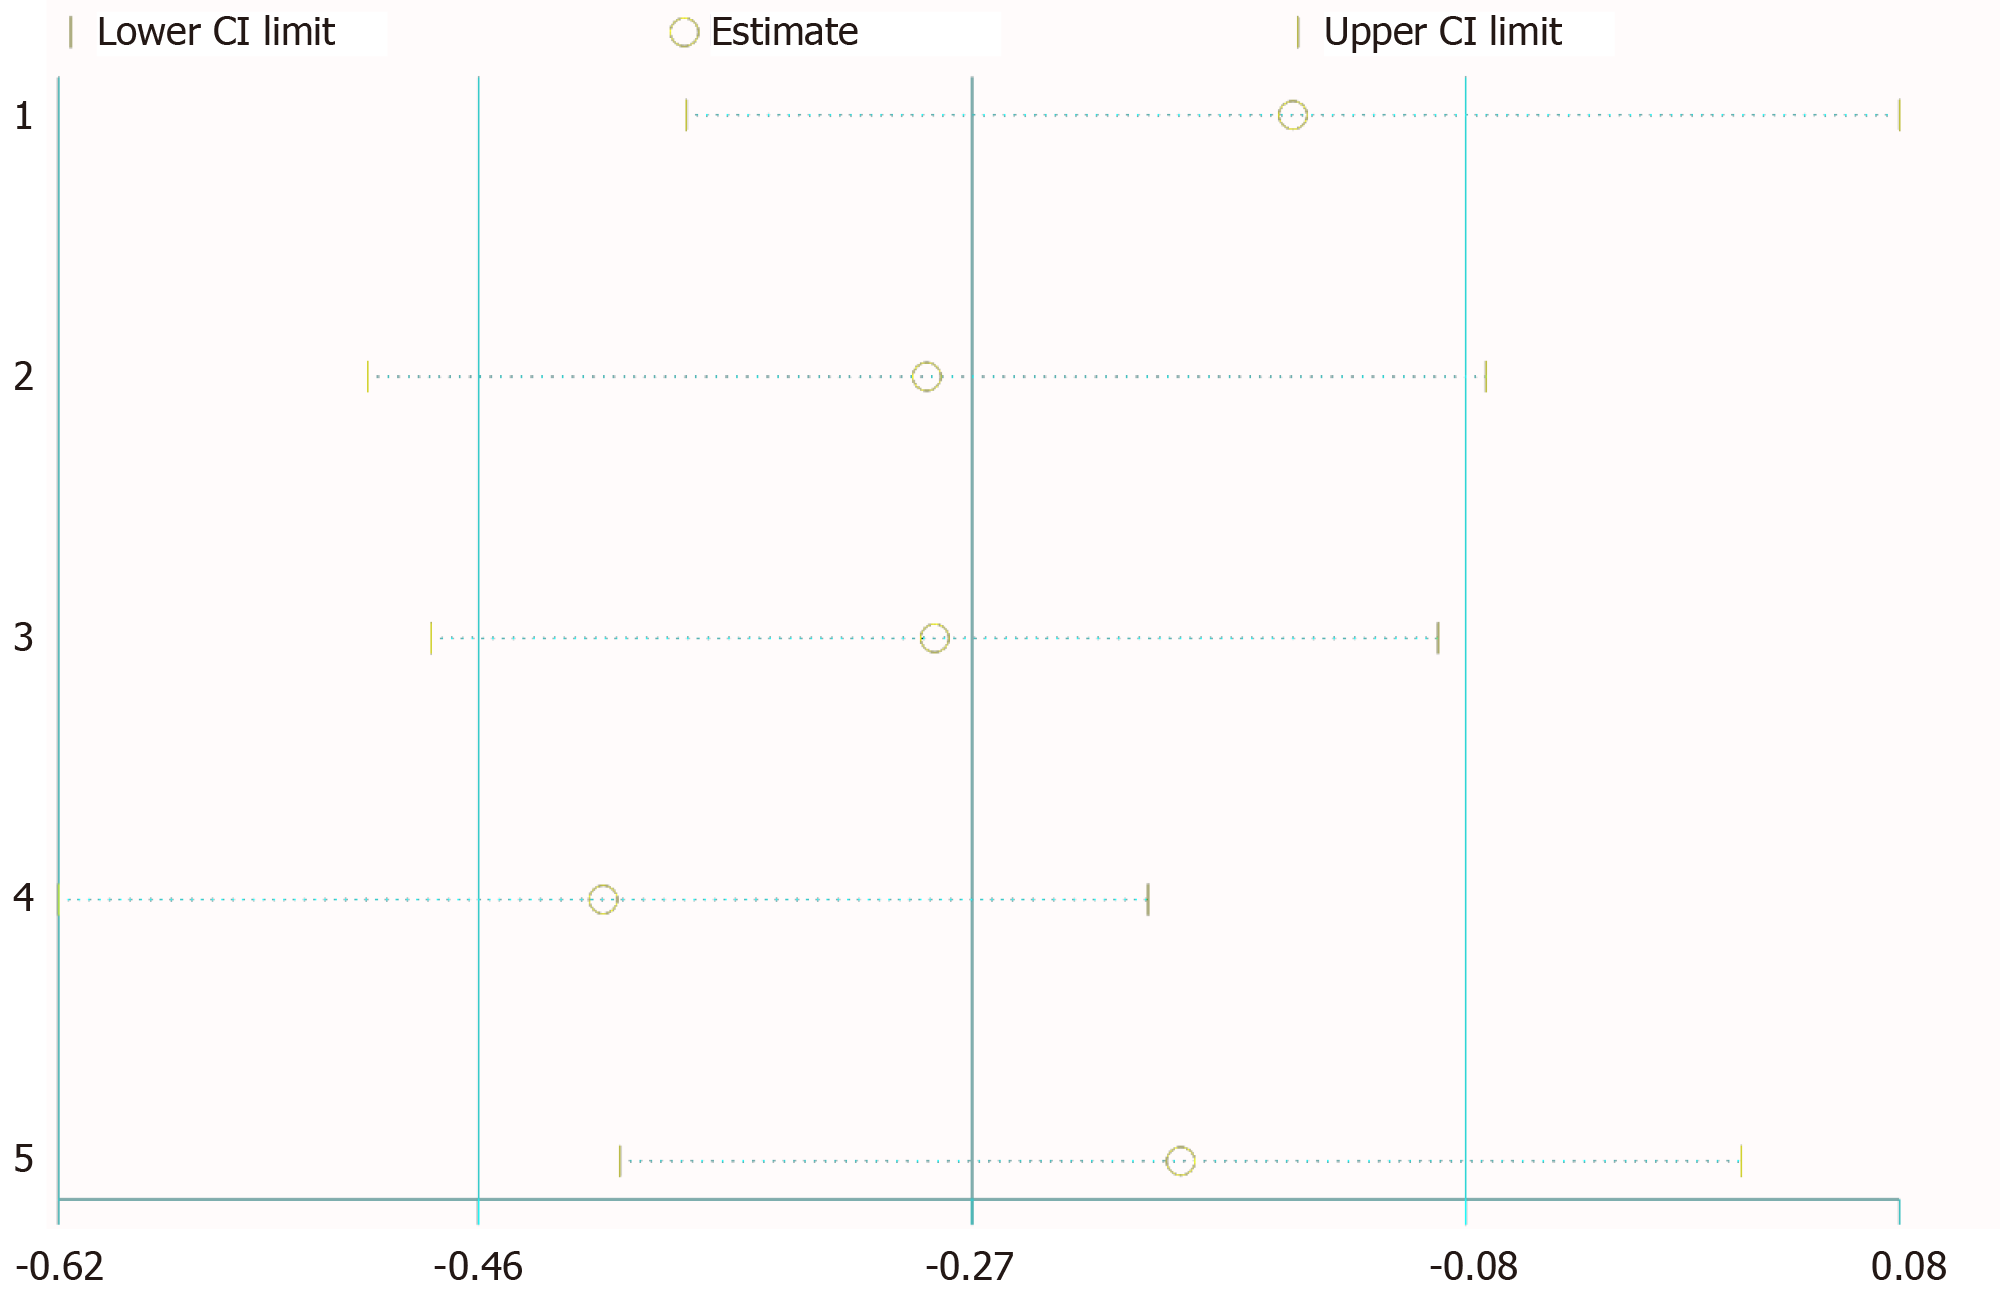
Figure 4 Sensitivity map for the meta-analysis of disease-free survival.
CI: Confidence interval.
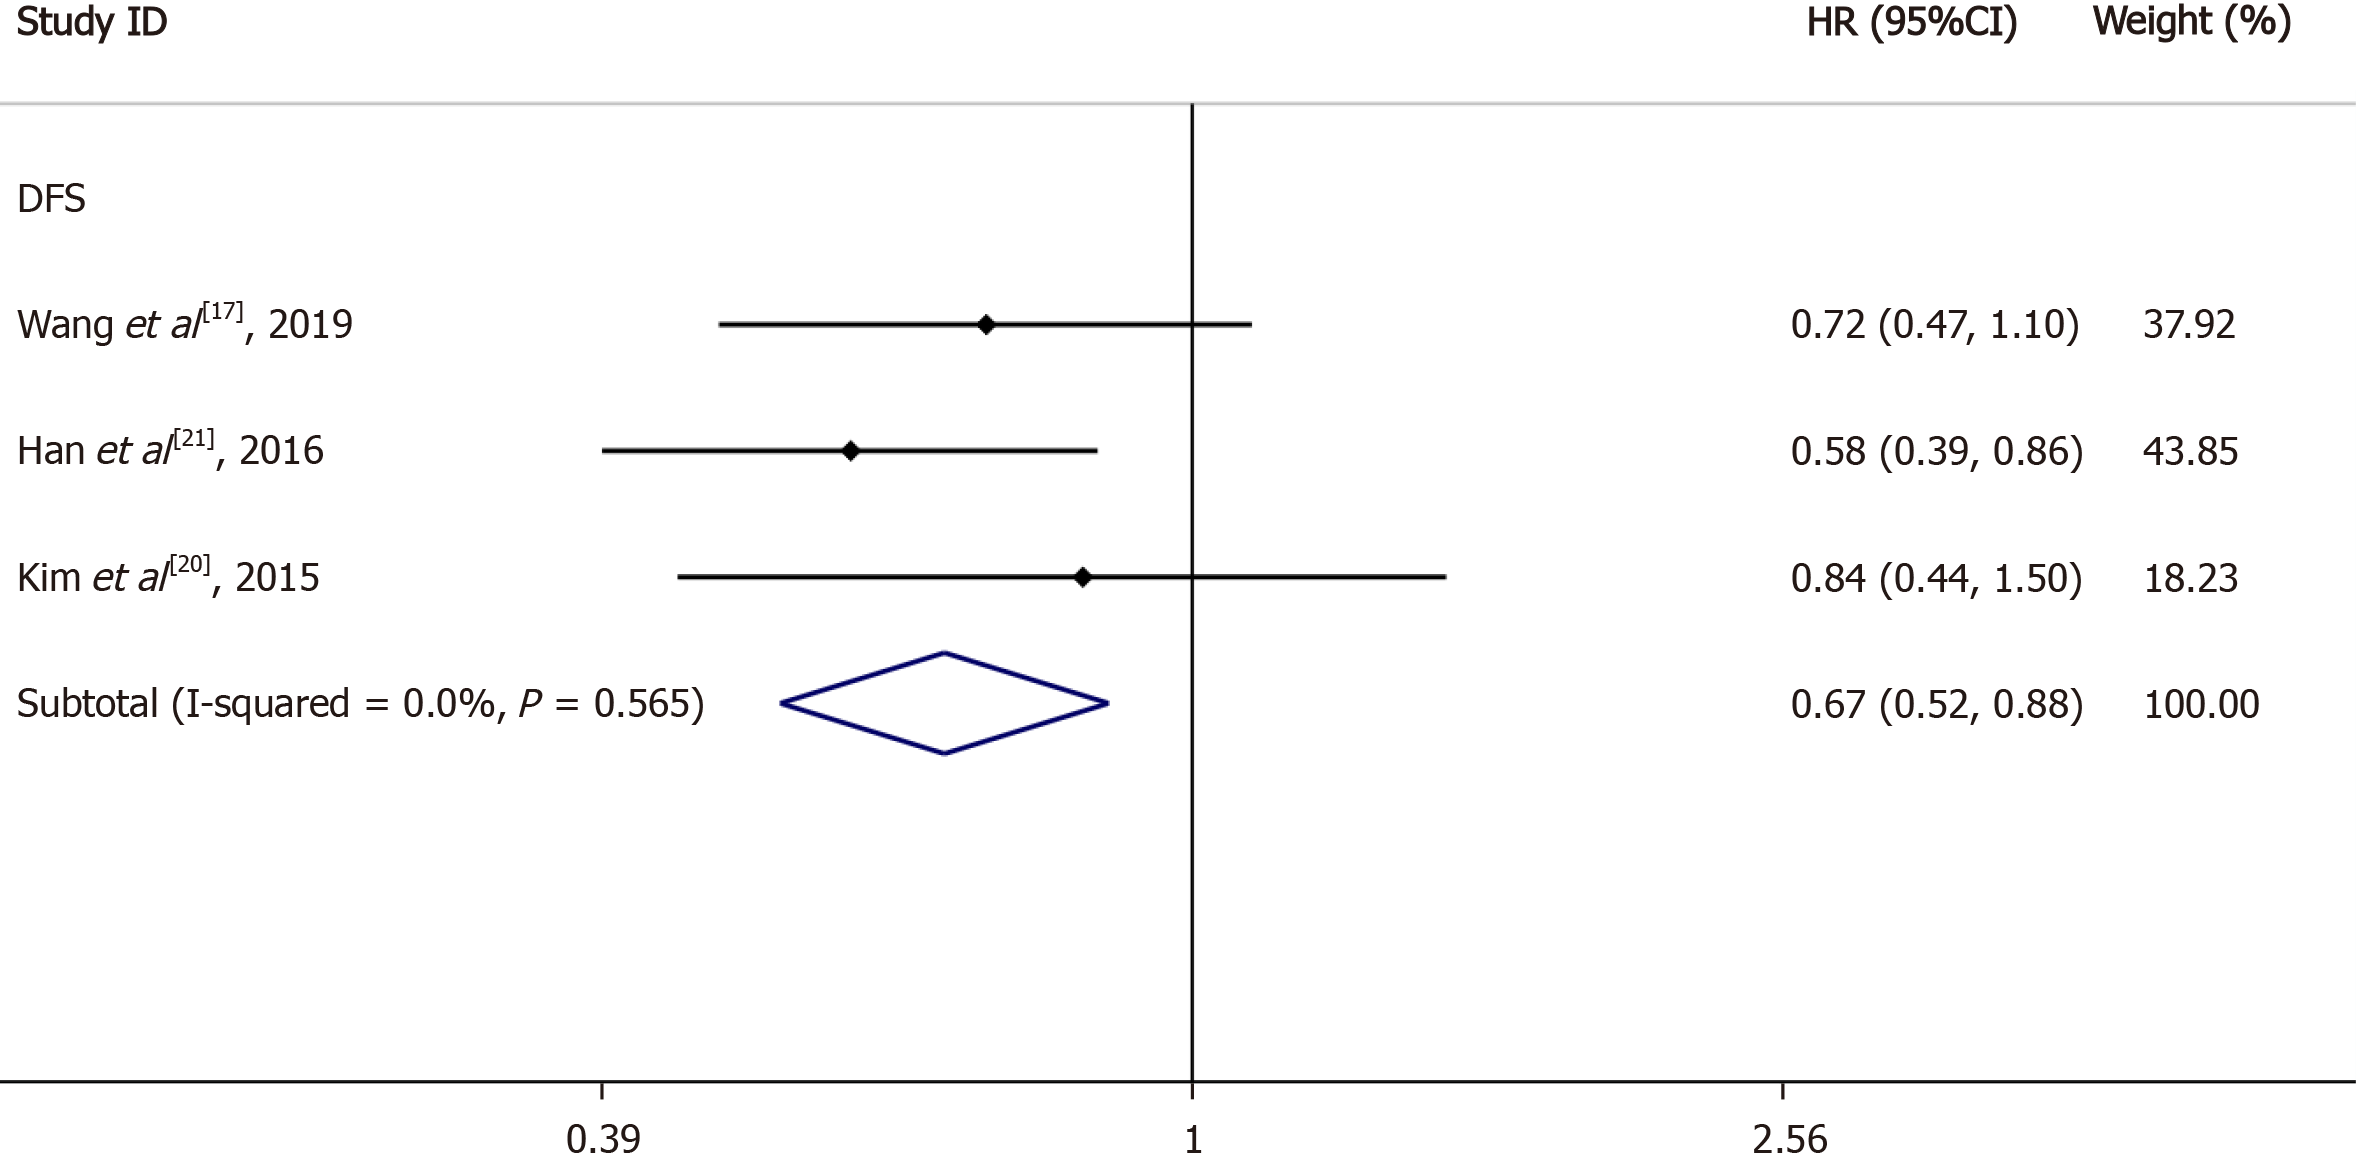
Figure 5 Forest plot for the meta-analysis of disease-free survival in the subgroup of lymph node negative patients.
HR: Hazard ratio; CI: Confidence interval; DFS: Disease-free survival.
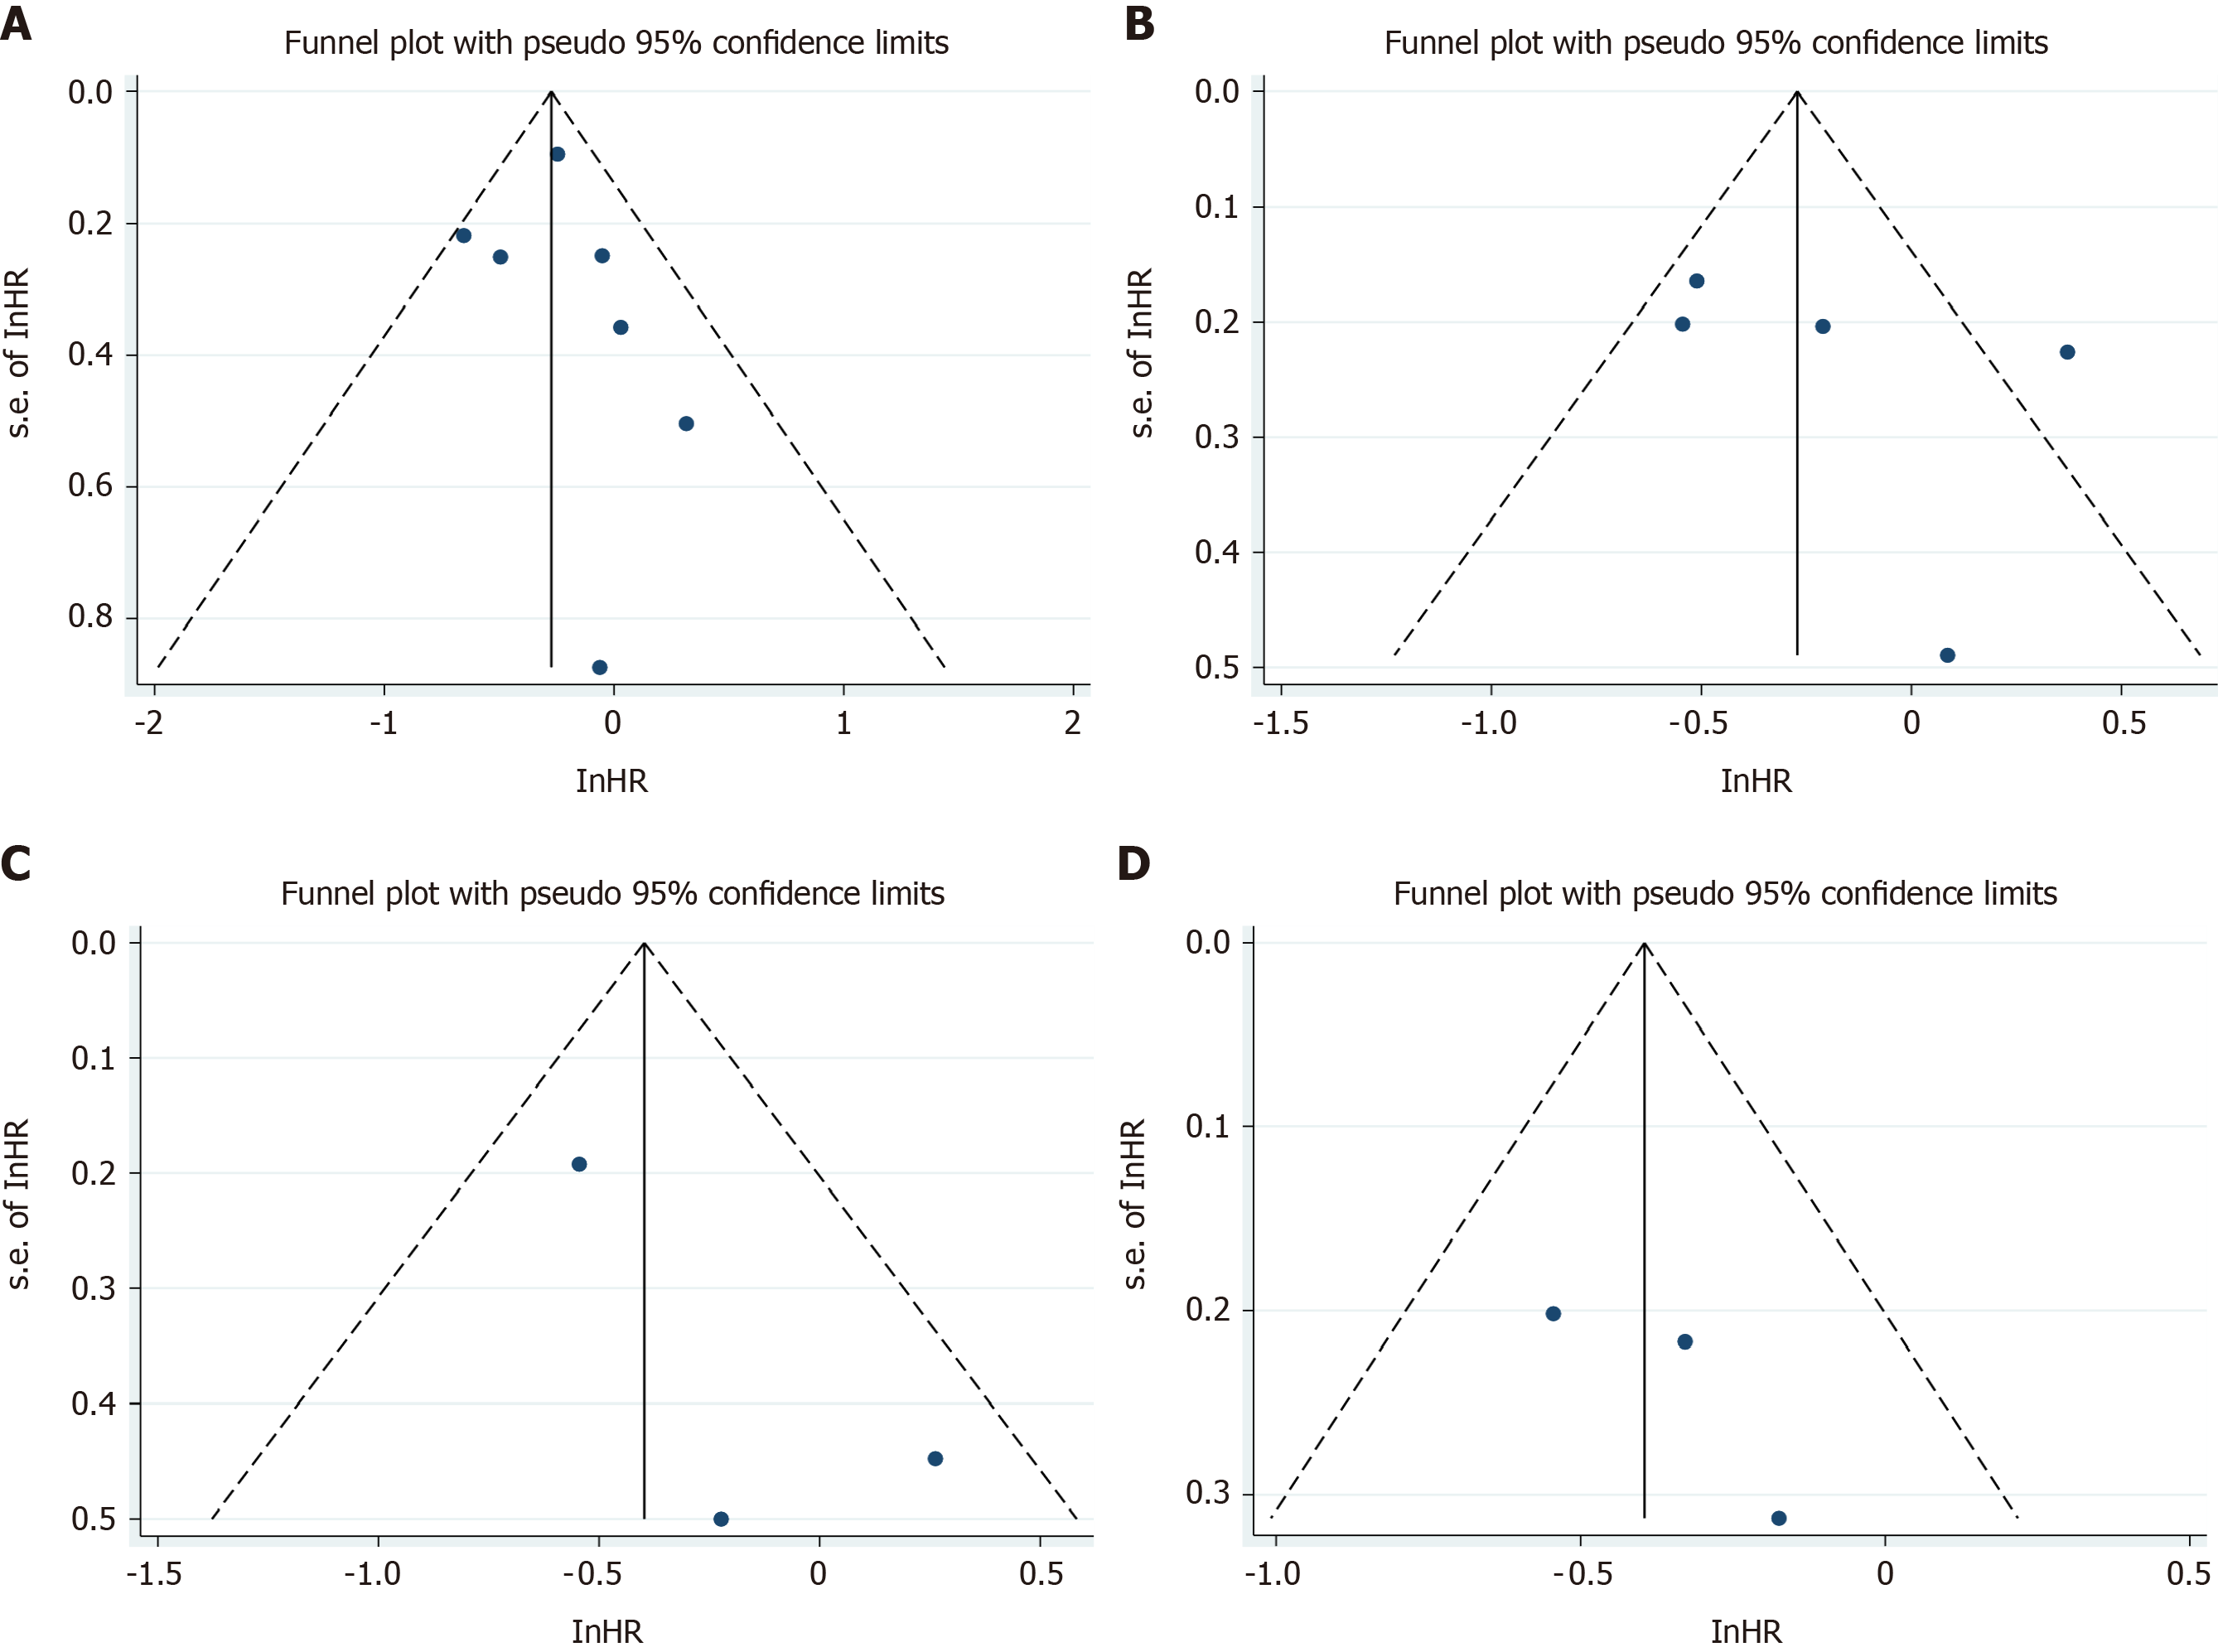
Figure 6 Funnel plot of publication bias in the meta-analysis.
A: Overall survival; B: Disease-free survival; C: Distant recurrence; D: Disease-free survival in lymph node negative patients. HR: Hazard ratio.
- Citation: Tan L, Liu ZL, Ma Z, He Z, Tang LH, Liu YL, Xiao JW. Prognostic impact of at least 12 lymph nodes after neoadjuvant therapy in rectal cancer: A meta-analysis. World J Gastrointest Oncol 2020; 12(12): 1443-1455
- URL: https://www.wjgnet.com/1948-5204/full/v12/i12/1443.htm
- DOI: https://dx.doi.org/10.4251/wjgo.v12.i12.1443


