Copyright
©The Author(s) 2020.
World J Gastrointest Oncol. Nov 15, 2020; 12(11): 1325-1335
Published online Nov 15, 2020. doi: 10.4251/wjgo.v12.i11.1325
Published online Nov 15, 2020. doi: 10.4251/wjgo.v12.i11.1325
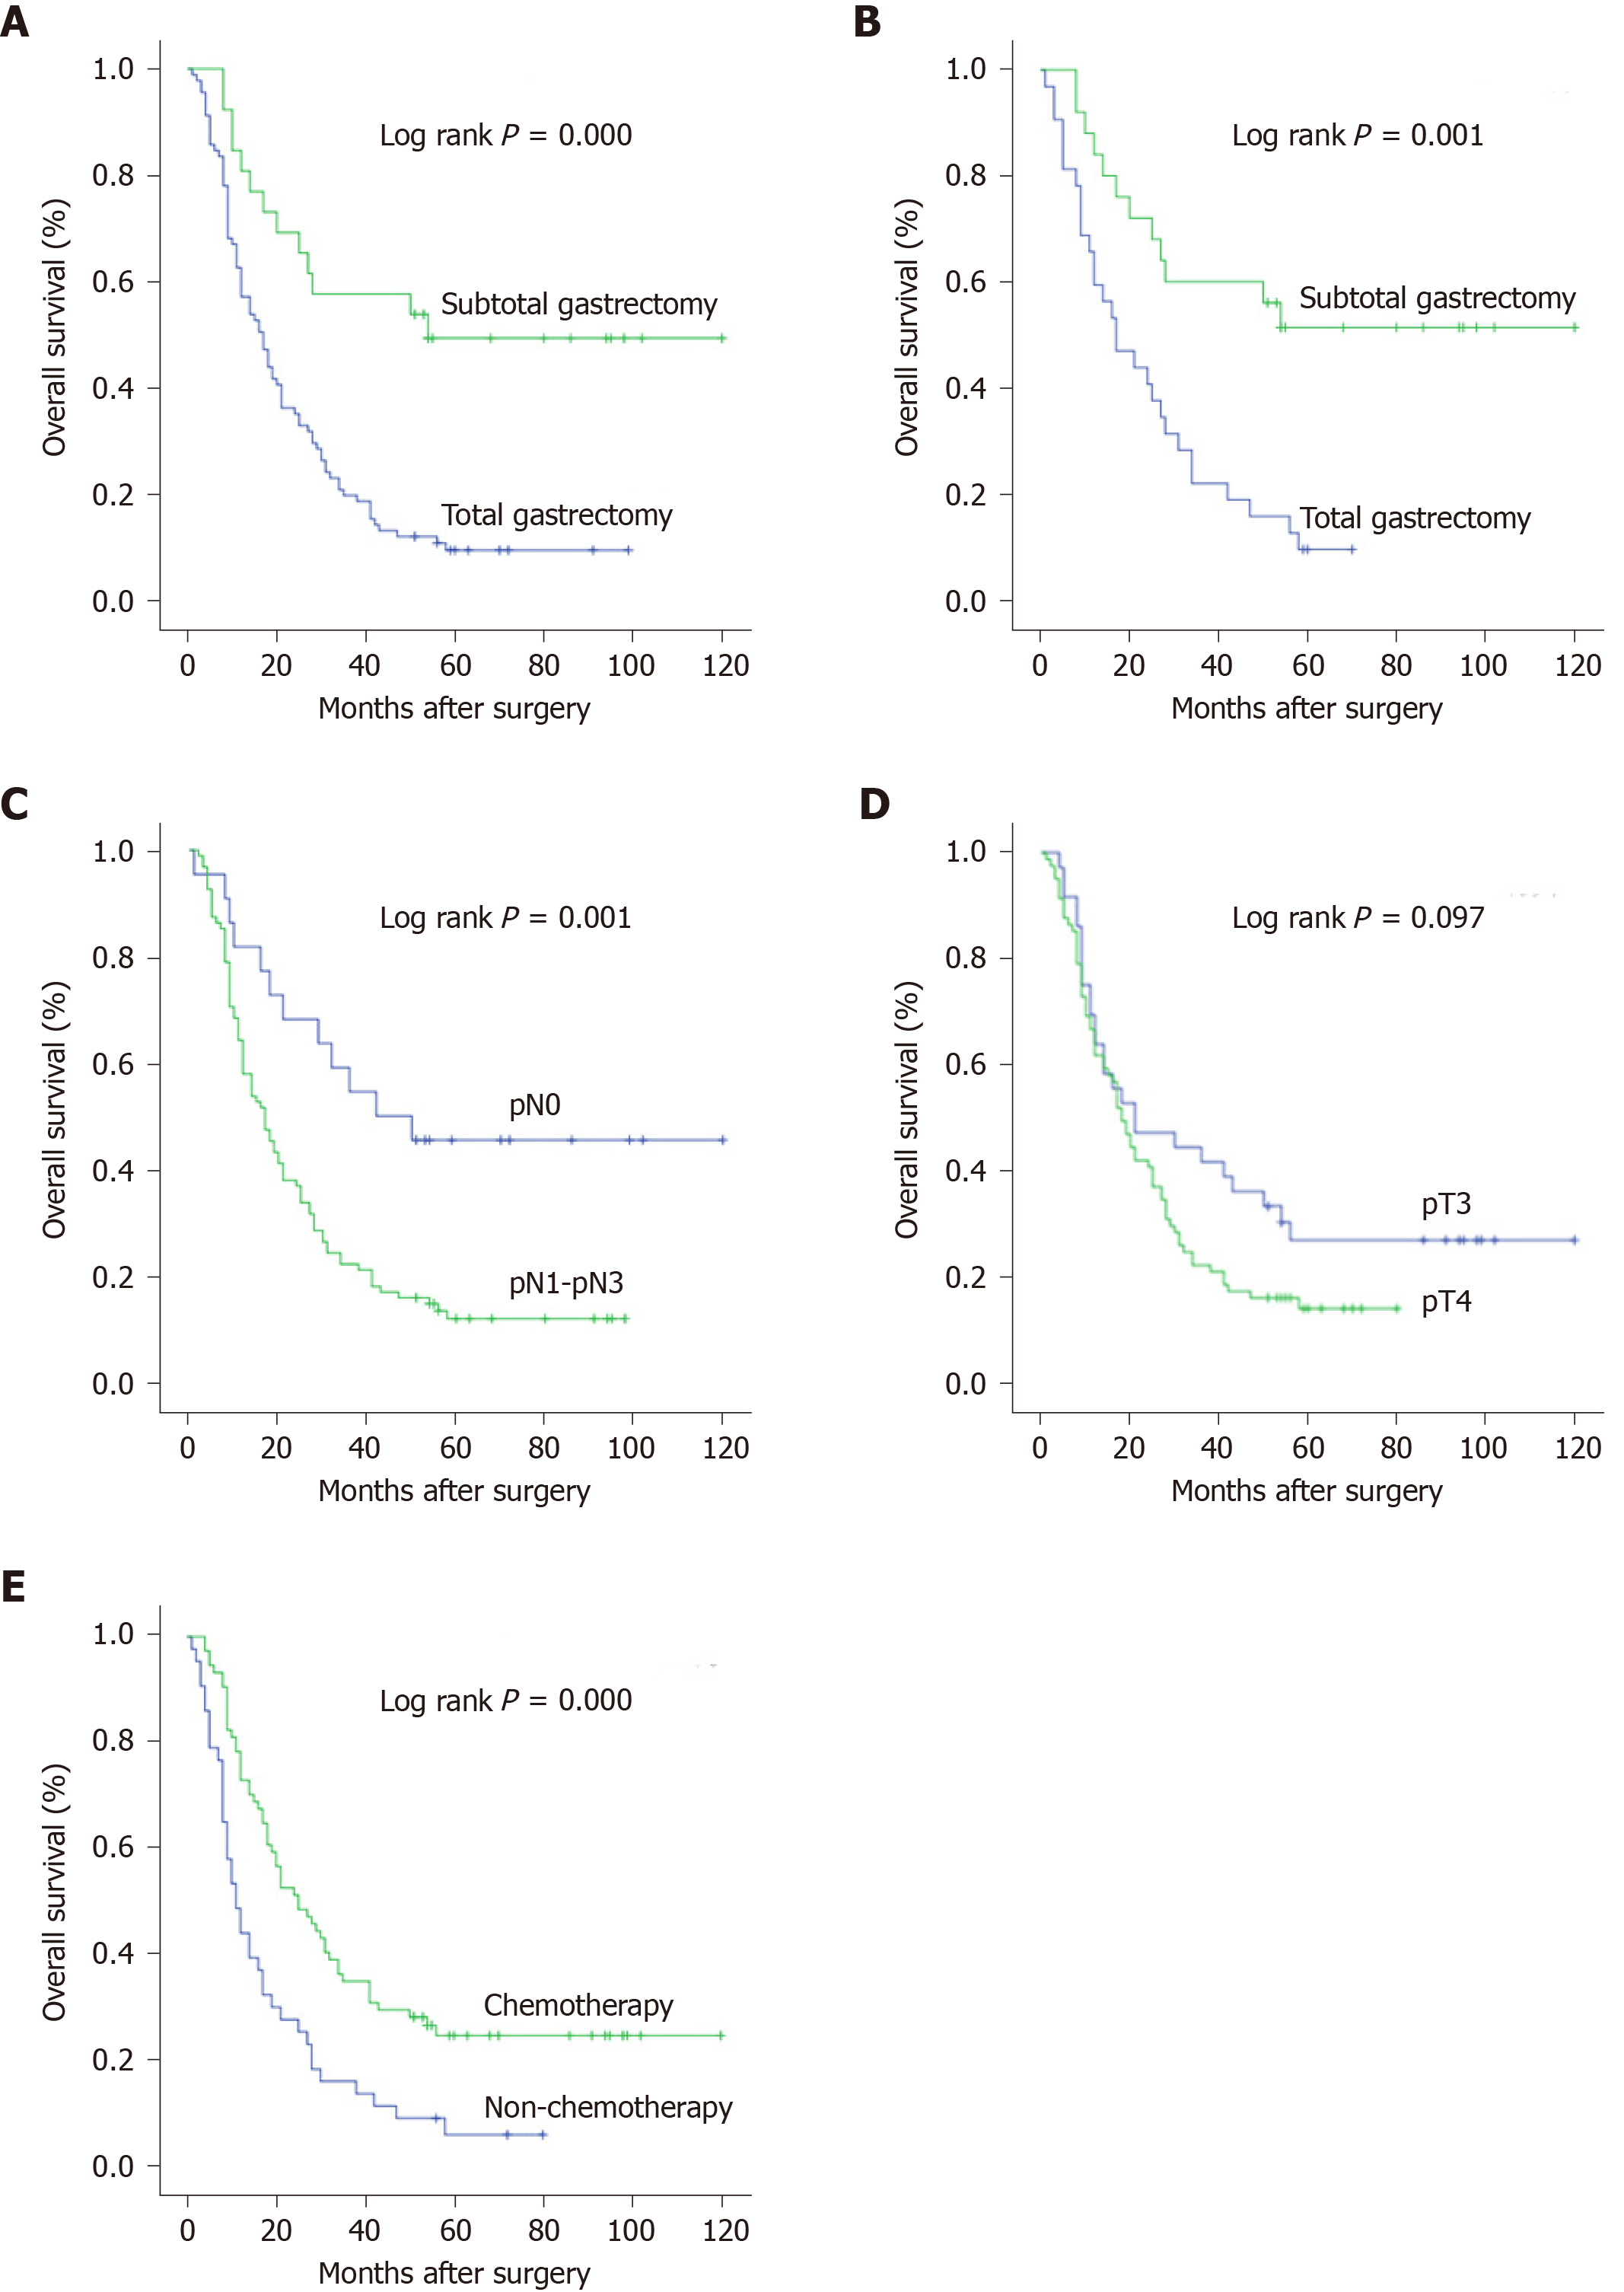
Figure 1 Survival curves of 117 patients according to the independent prognostic factors.
A: Subtotal vs total gastrectomy; B: Subtotal vs total gastrectomy (lower-middle lesions); C: Lymph node status (pN stage); D: Tumor invasion depth (pT stage); E: Postoperative chemotherapy. pN: Lymph node status; pT: Tumor invasion depth.
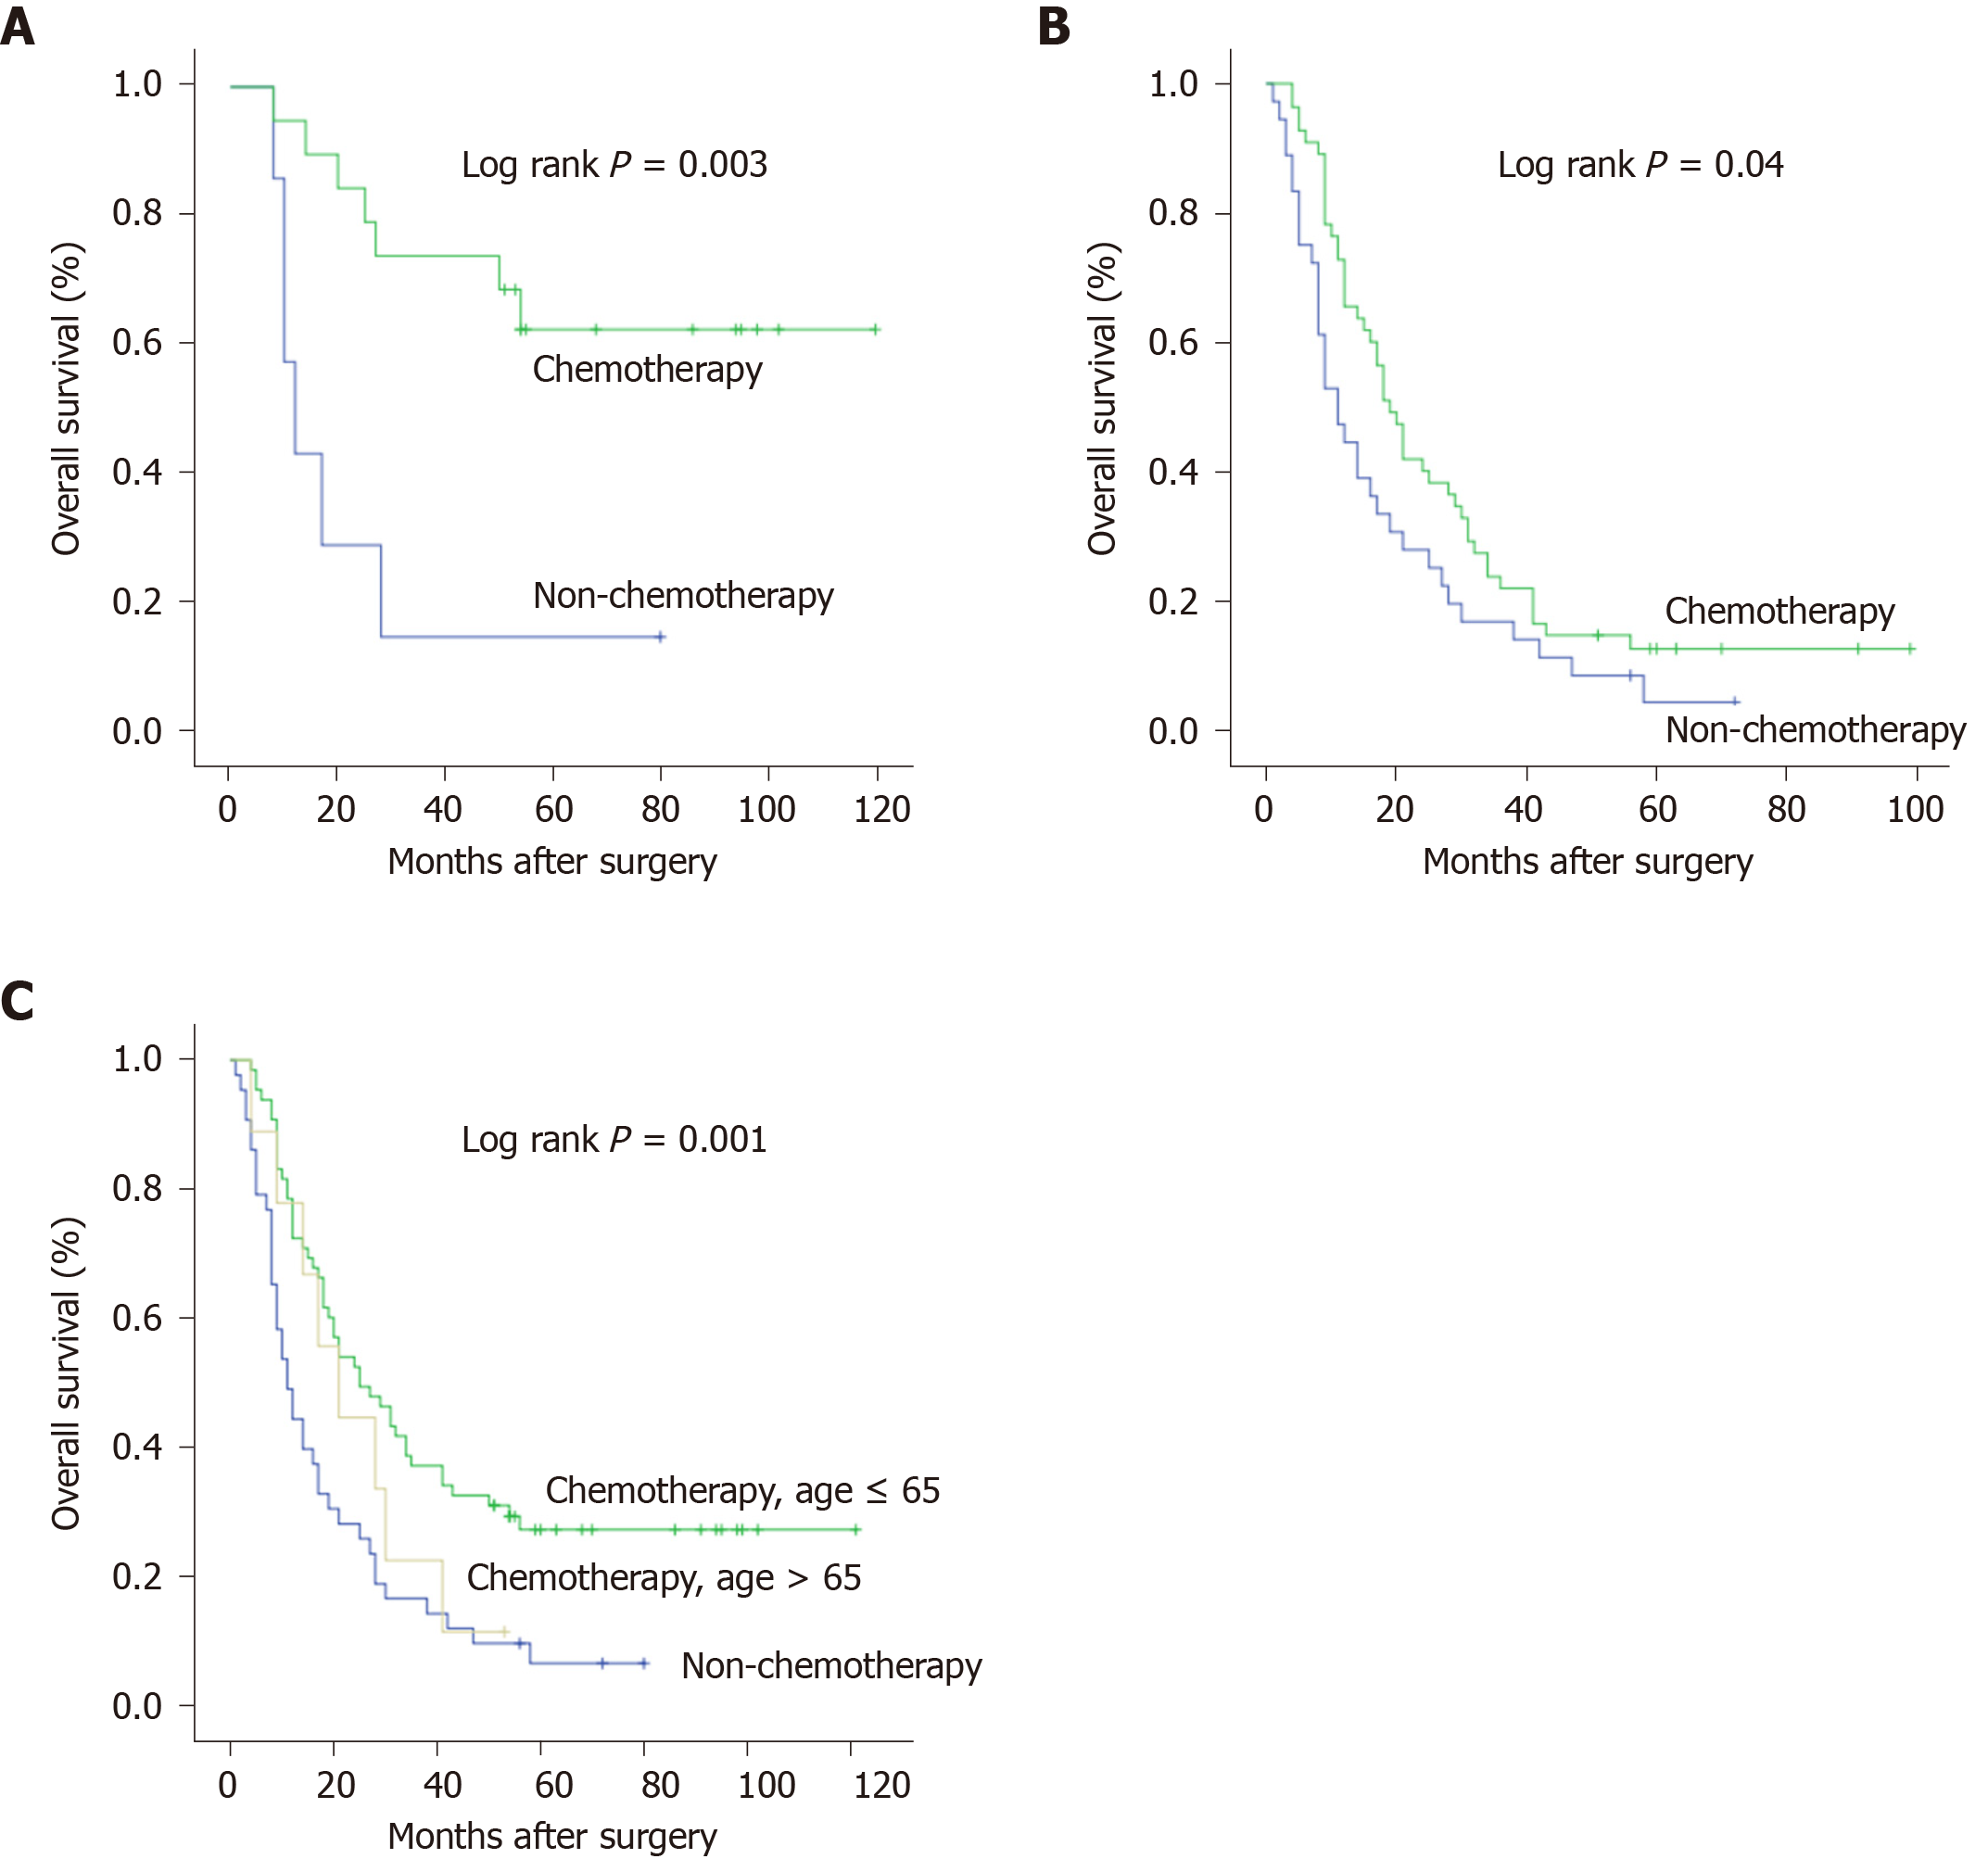
Figure 2 Survival curves of chemotherapy for different Borrmann type IV patients.
A: Patients with subtotal gastrectomy; B: Patients with total gastrectomy; C: Patients of different ages.
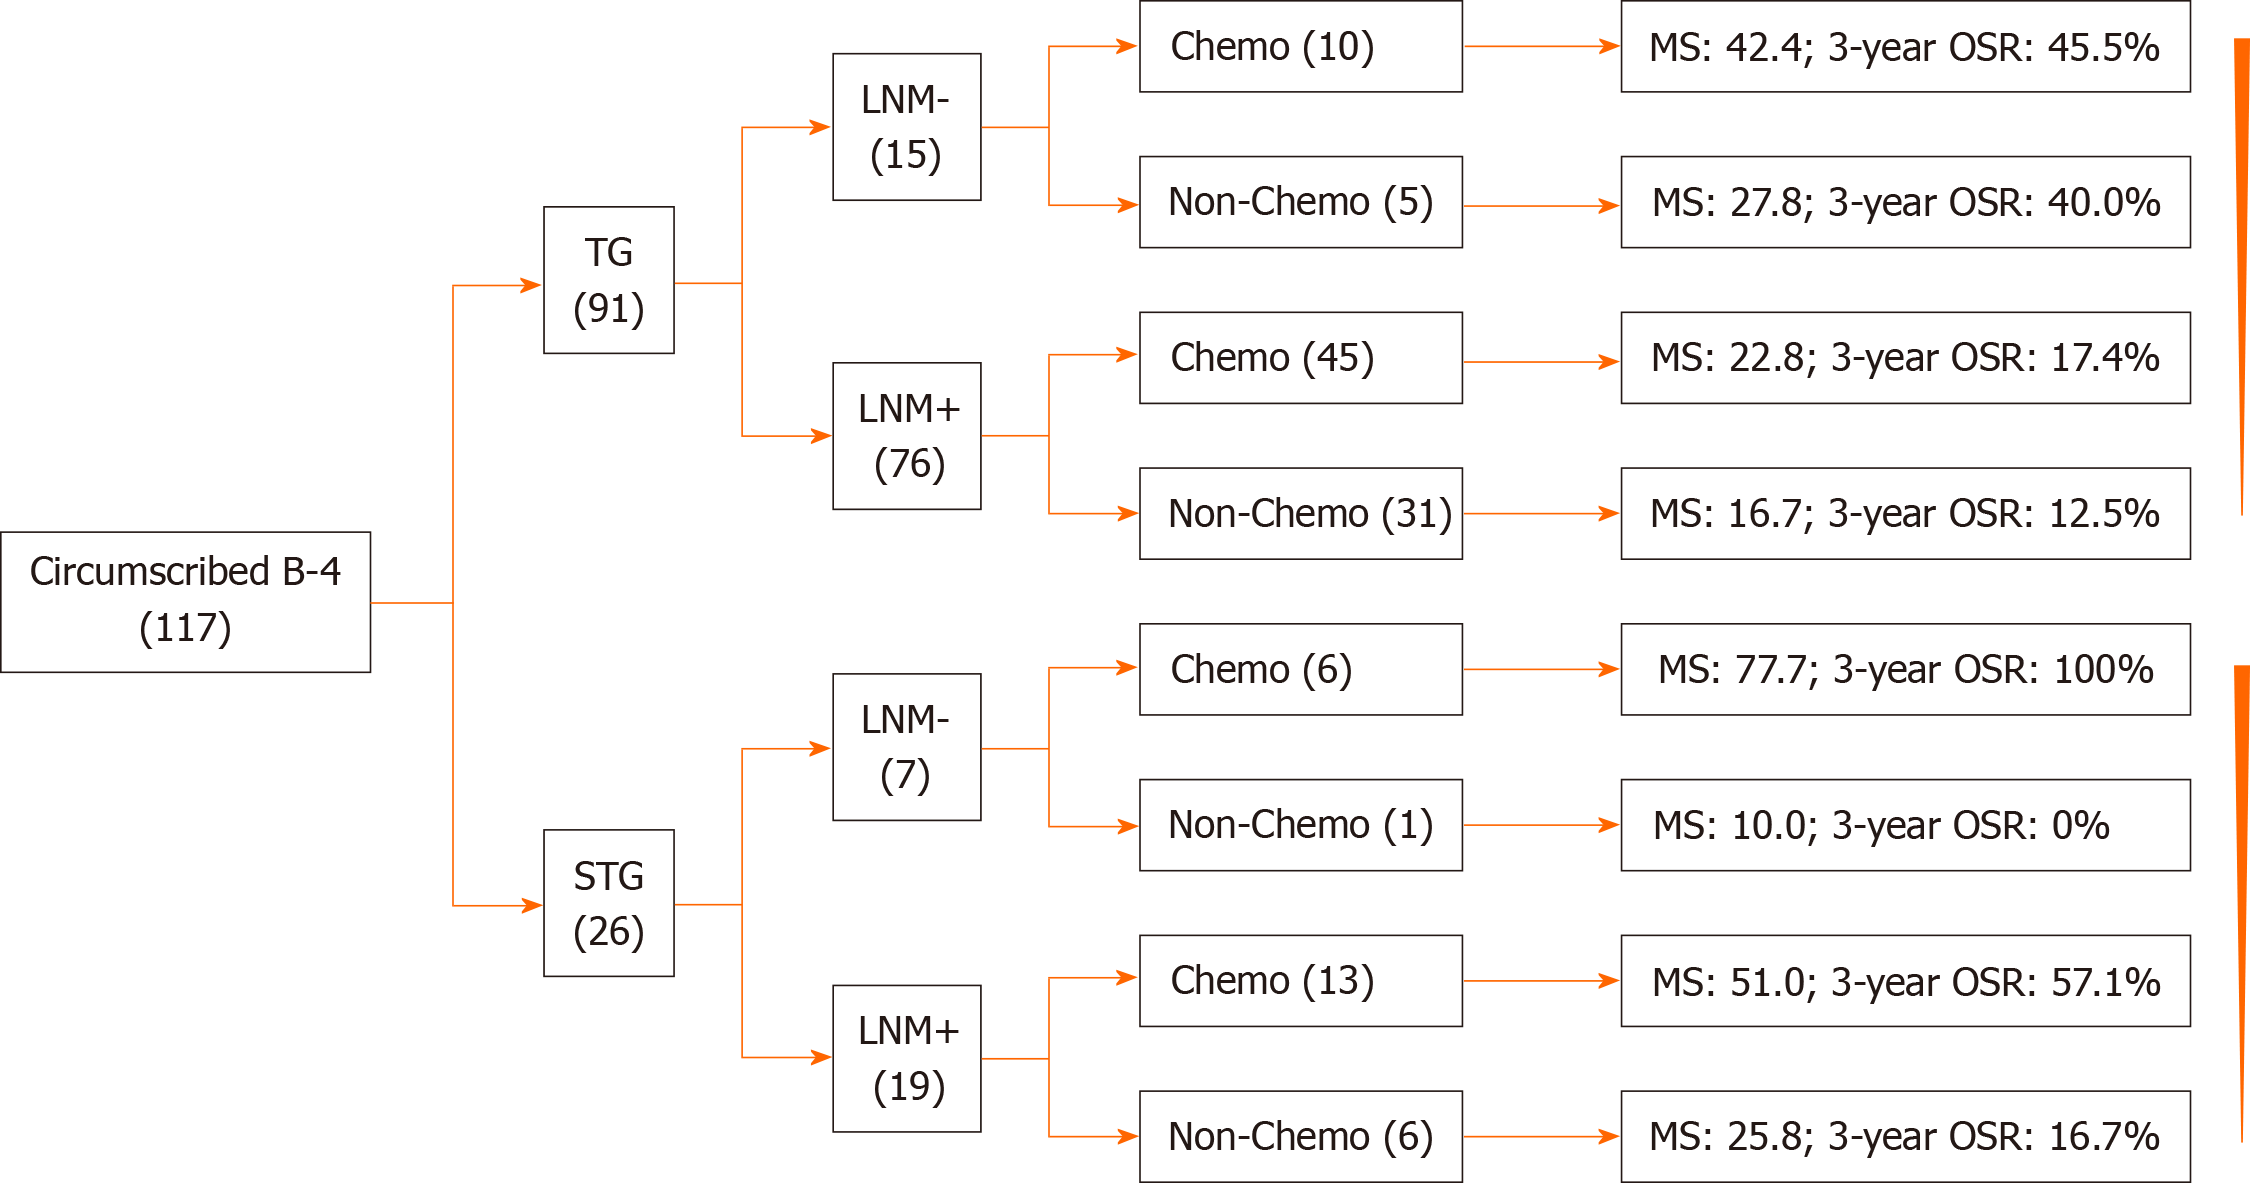
Figure 3 Mean survival and 3-yr overall survival rates of different groups of 117 patients according to Cox multivariate analysis.
TG: Total gastrectomy; STG: Subtotal gastrectomy; LNM: Lymph node metastasis; Chemo: Chemotherapy; MS: Median survival (mo); OSR: Overall survival rate.
- Citation: Huang HB, Gao ZM, Sun AQ, Liang WT, Li K. Subtotal gastrectomy combined with chemotherapy: An effective therapy for patients with circumscribed Borrmann type IV gastric cancer. World J Gastrointest Oncol 2020; 12(11): 1325-1335
- URL: https://www.wjgnet.com/1948-5204/full/v12/i11/1325.htm
- DOI: https://dx.doi.org/10.4251/wjgo.v12.i11.1325


