Copyright
©The Author(s) 2020.
World J Gastrointest Oncol. Nov 15, 2020; 12(11): 1272-1287
Published online Nov 15, 2020. doi: 10.4251/wjgo.v12.i11.1272
Published online Nov 15, 2020. doi: 10.4251/wjgo.v12.i11.1272
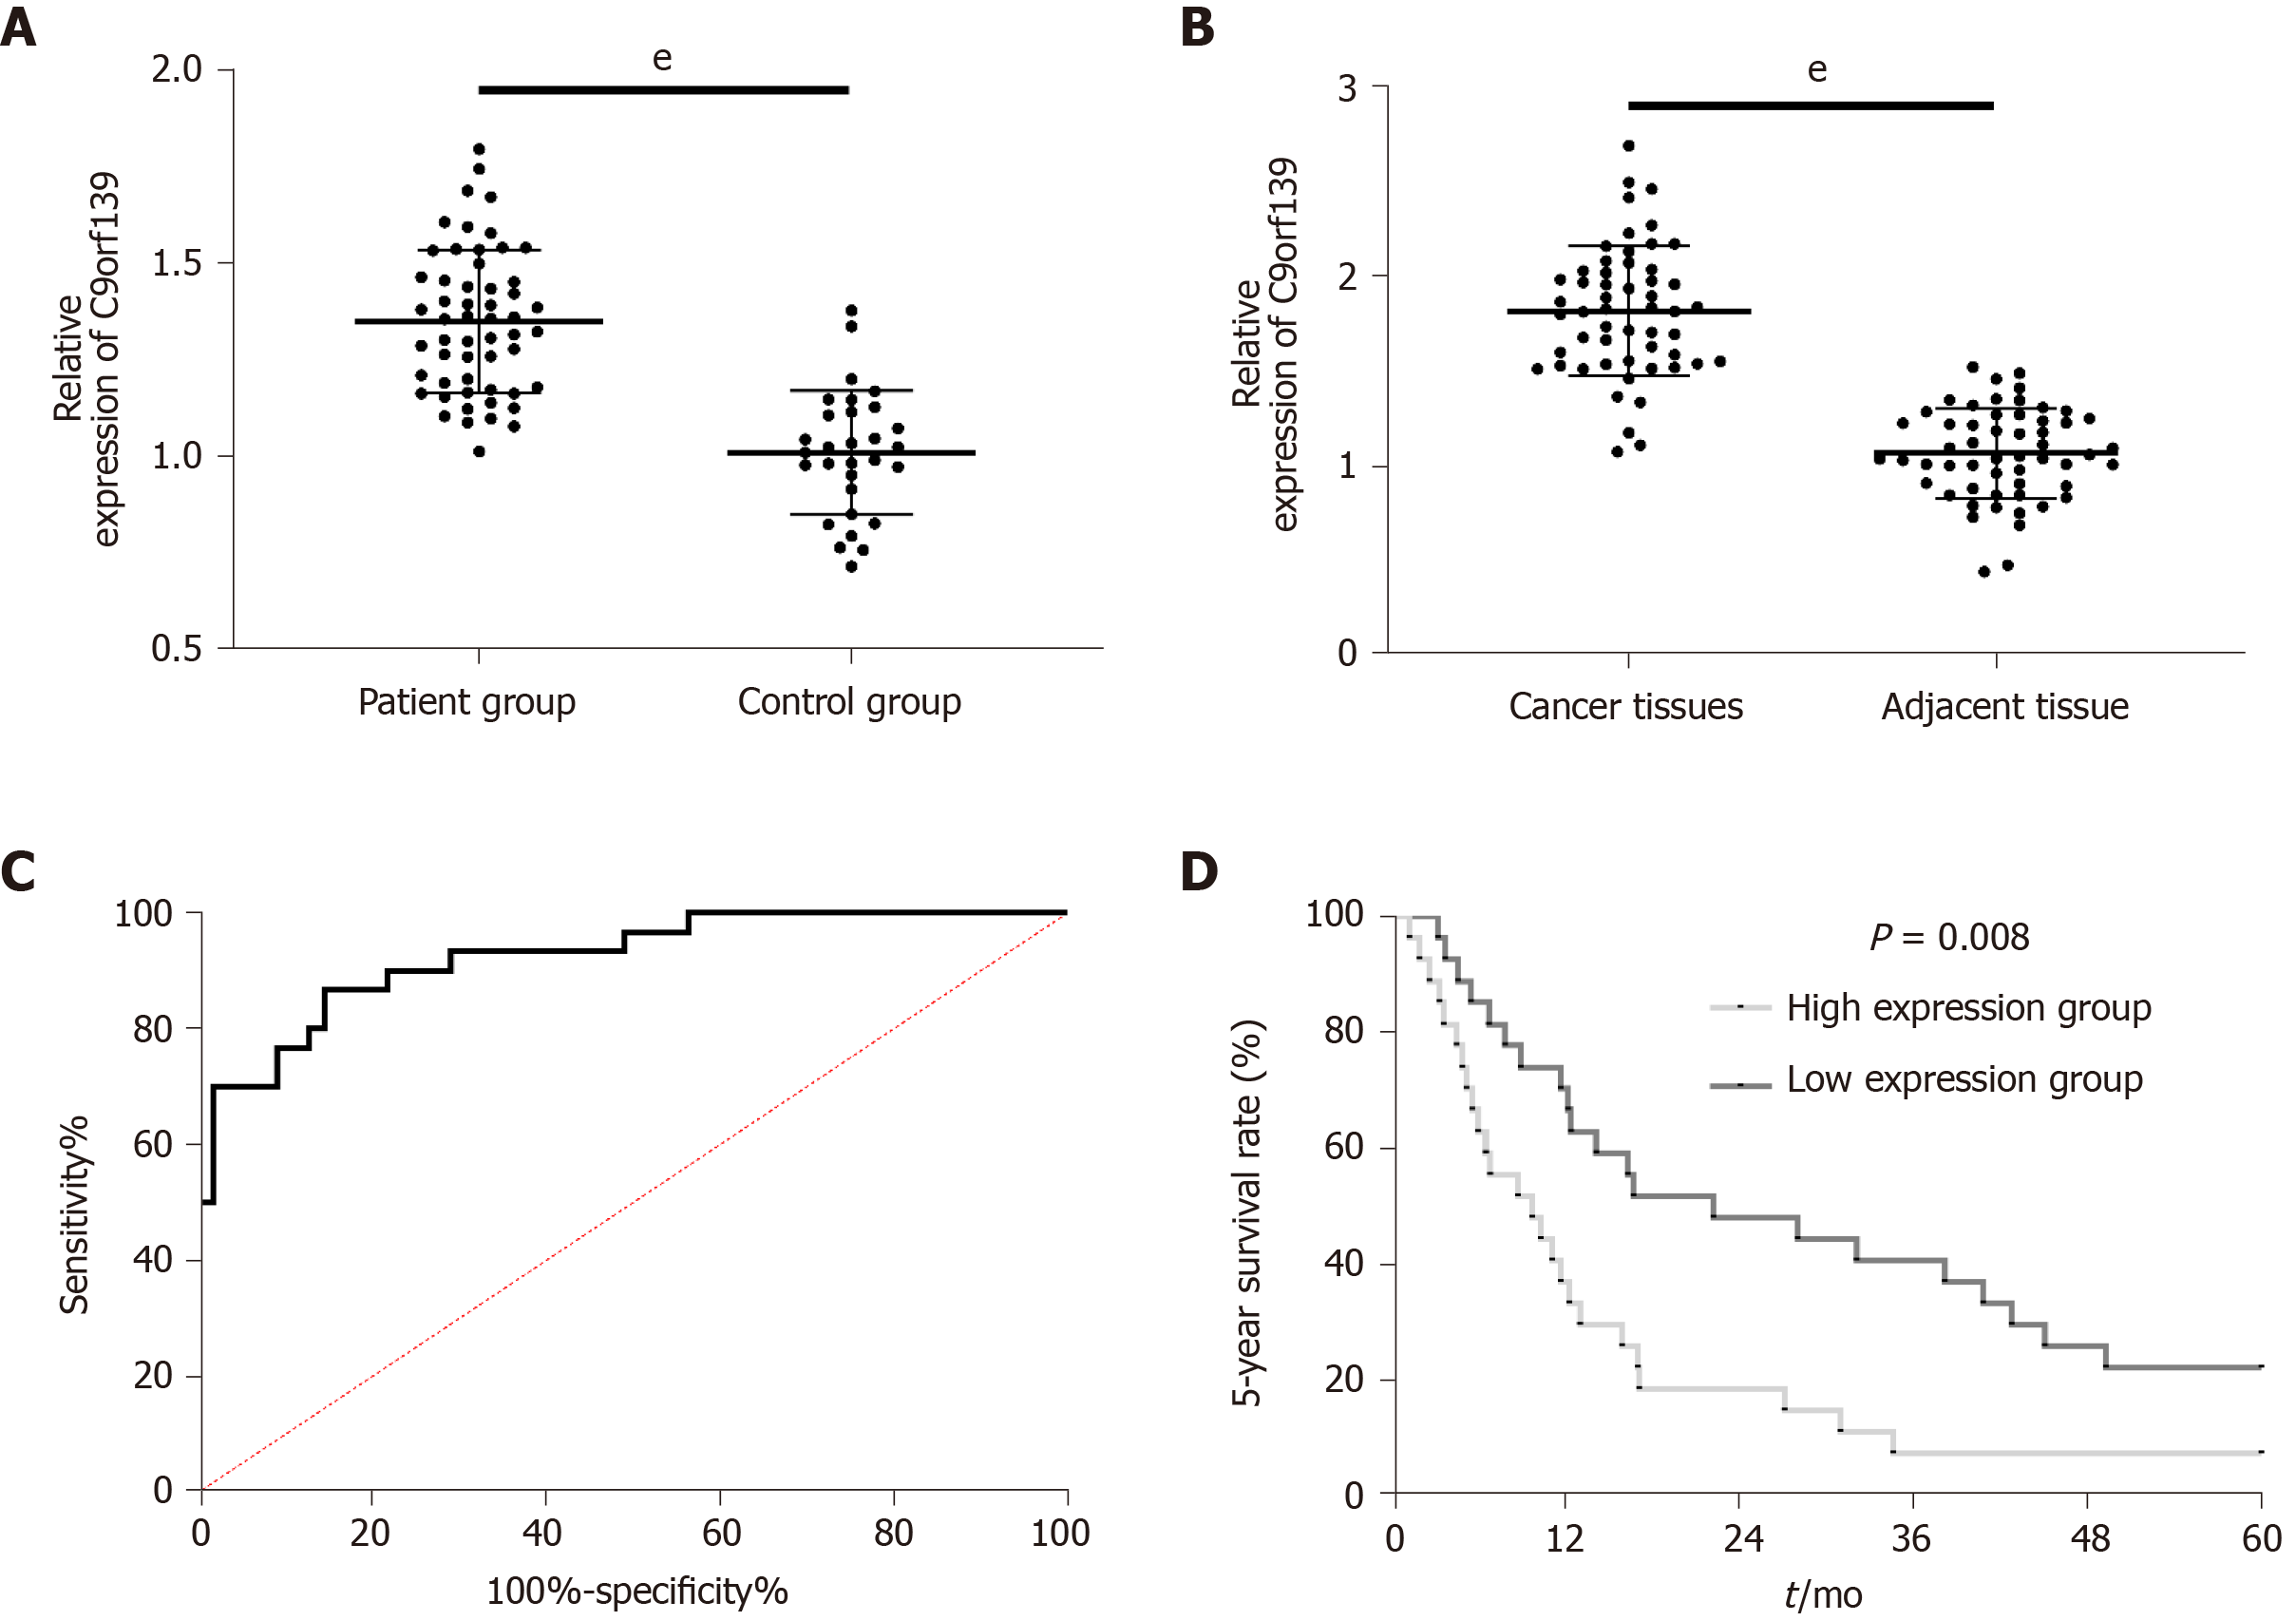
Figure 1 Clinical value of long non-coding RNA C9orf139 in patients with pancreatic cancer.
A: Relative serum expression of long non-coding RNA (lncRNA) C9orf139 in the patient group and control group; B: Expression of lncRNA C9orf139 in cancer tissues and adjacent tissues; C: Receiver operating characteristic curve of lncRNA C9orf139 for the diagnosis of pancreatic cancer; D: The 5-year survival of patients was higher in the low expression group than in the high expression group. eP < 0.001 for the comparison between two groups.
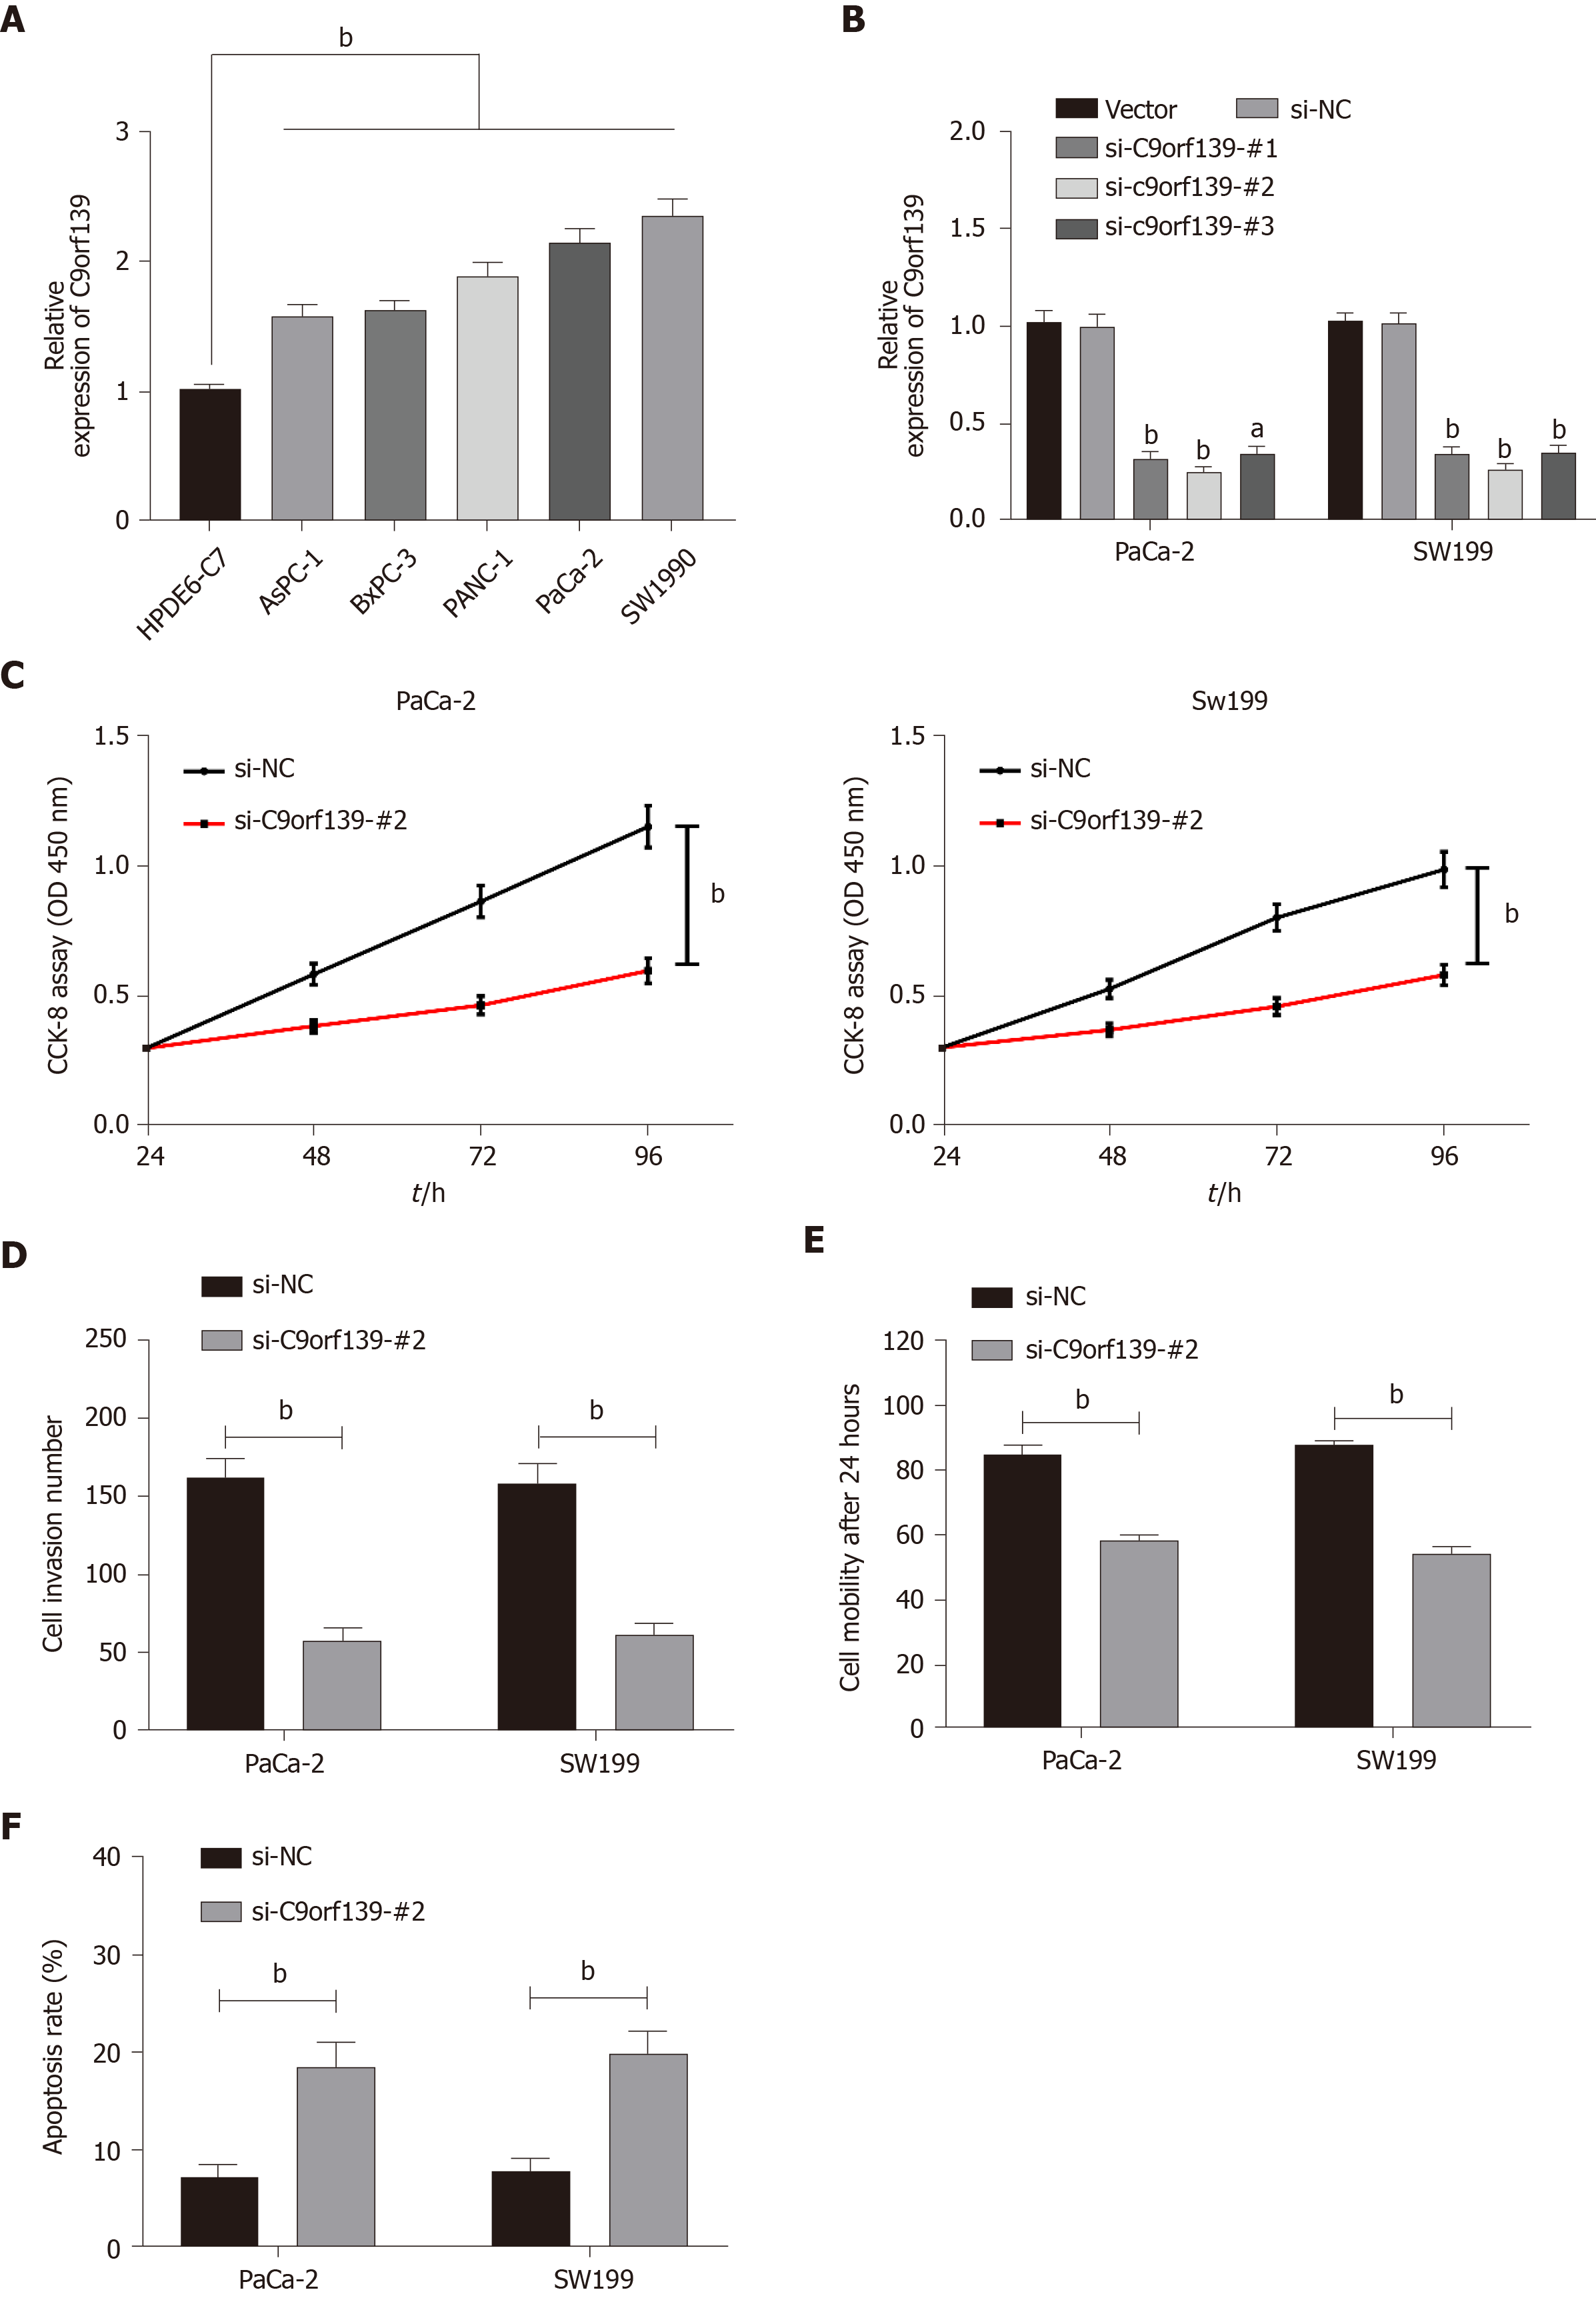
Figure 2 Effect of long non-coding RNA C9orf139 on pancreatic cancer cell behaviors.
A: Relative expression of long non-coding RNA (lncRNA) C9orf139 in pancreatic cancer cell lines; B: Relative expression of lncRNA C9orf139 in cells after transfection; C: Inhibited cell proliferation after knockdown of lncRNA C9orf139; D: Decreased cell invasion after knockdown of lncRNA C9orf139; E: Inhibited cell migration after knockdown of lncRNA C9orf139; F: Increased cell apoptosis after knockdown of lncRNA C9orf139. bP < 0.01 for the comparison between two groups. si-NC was the irrelevant sequence and vector was the control group.
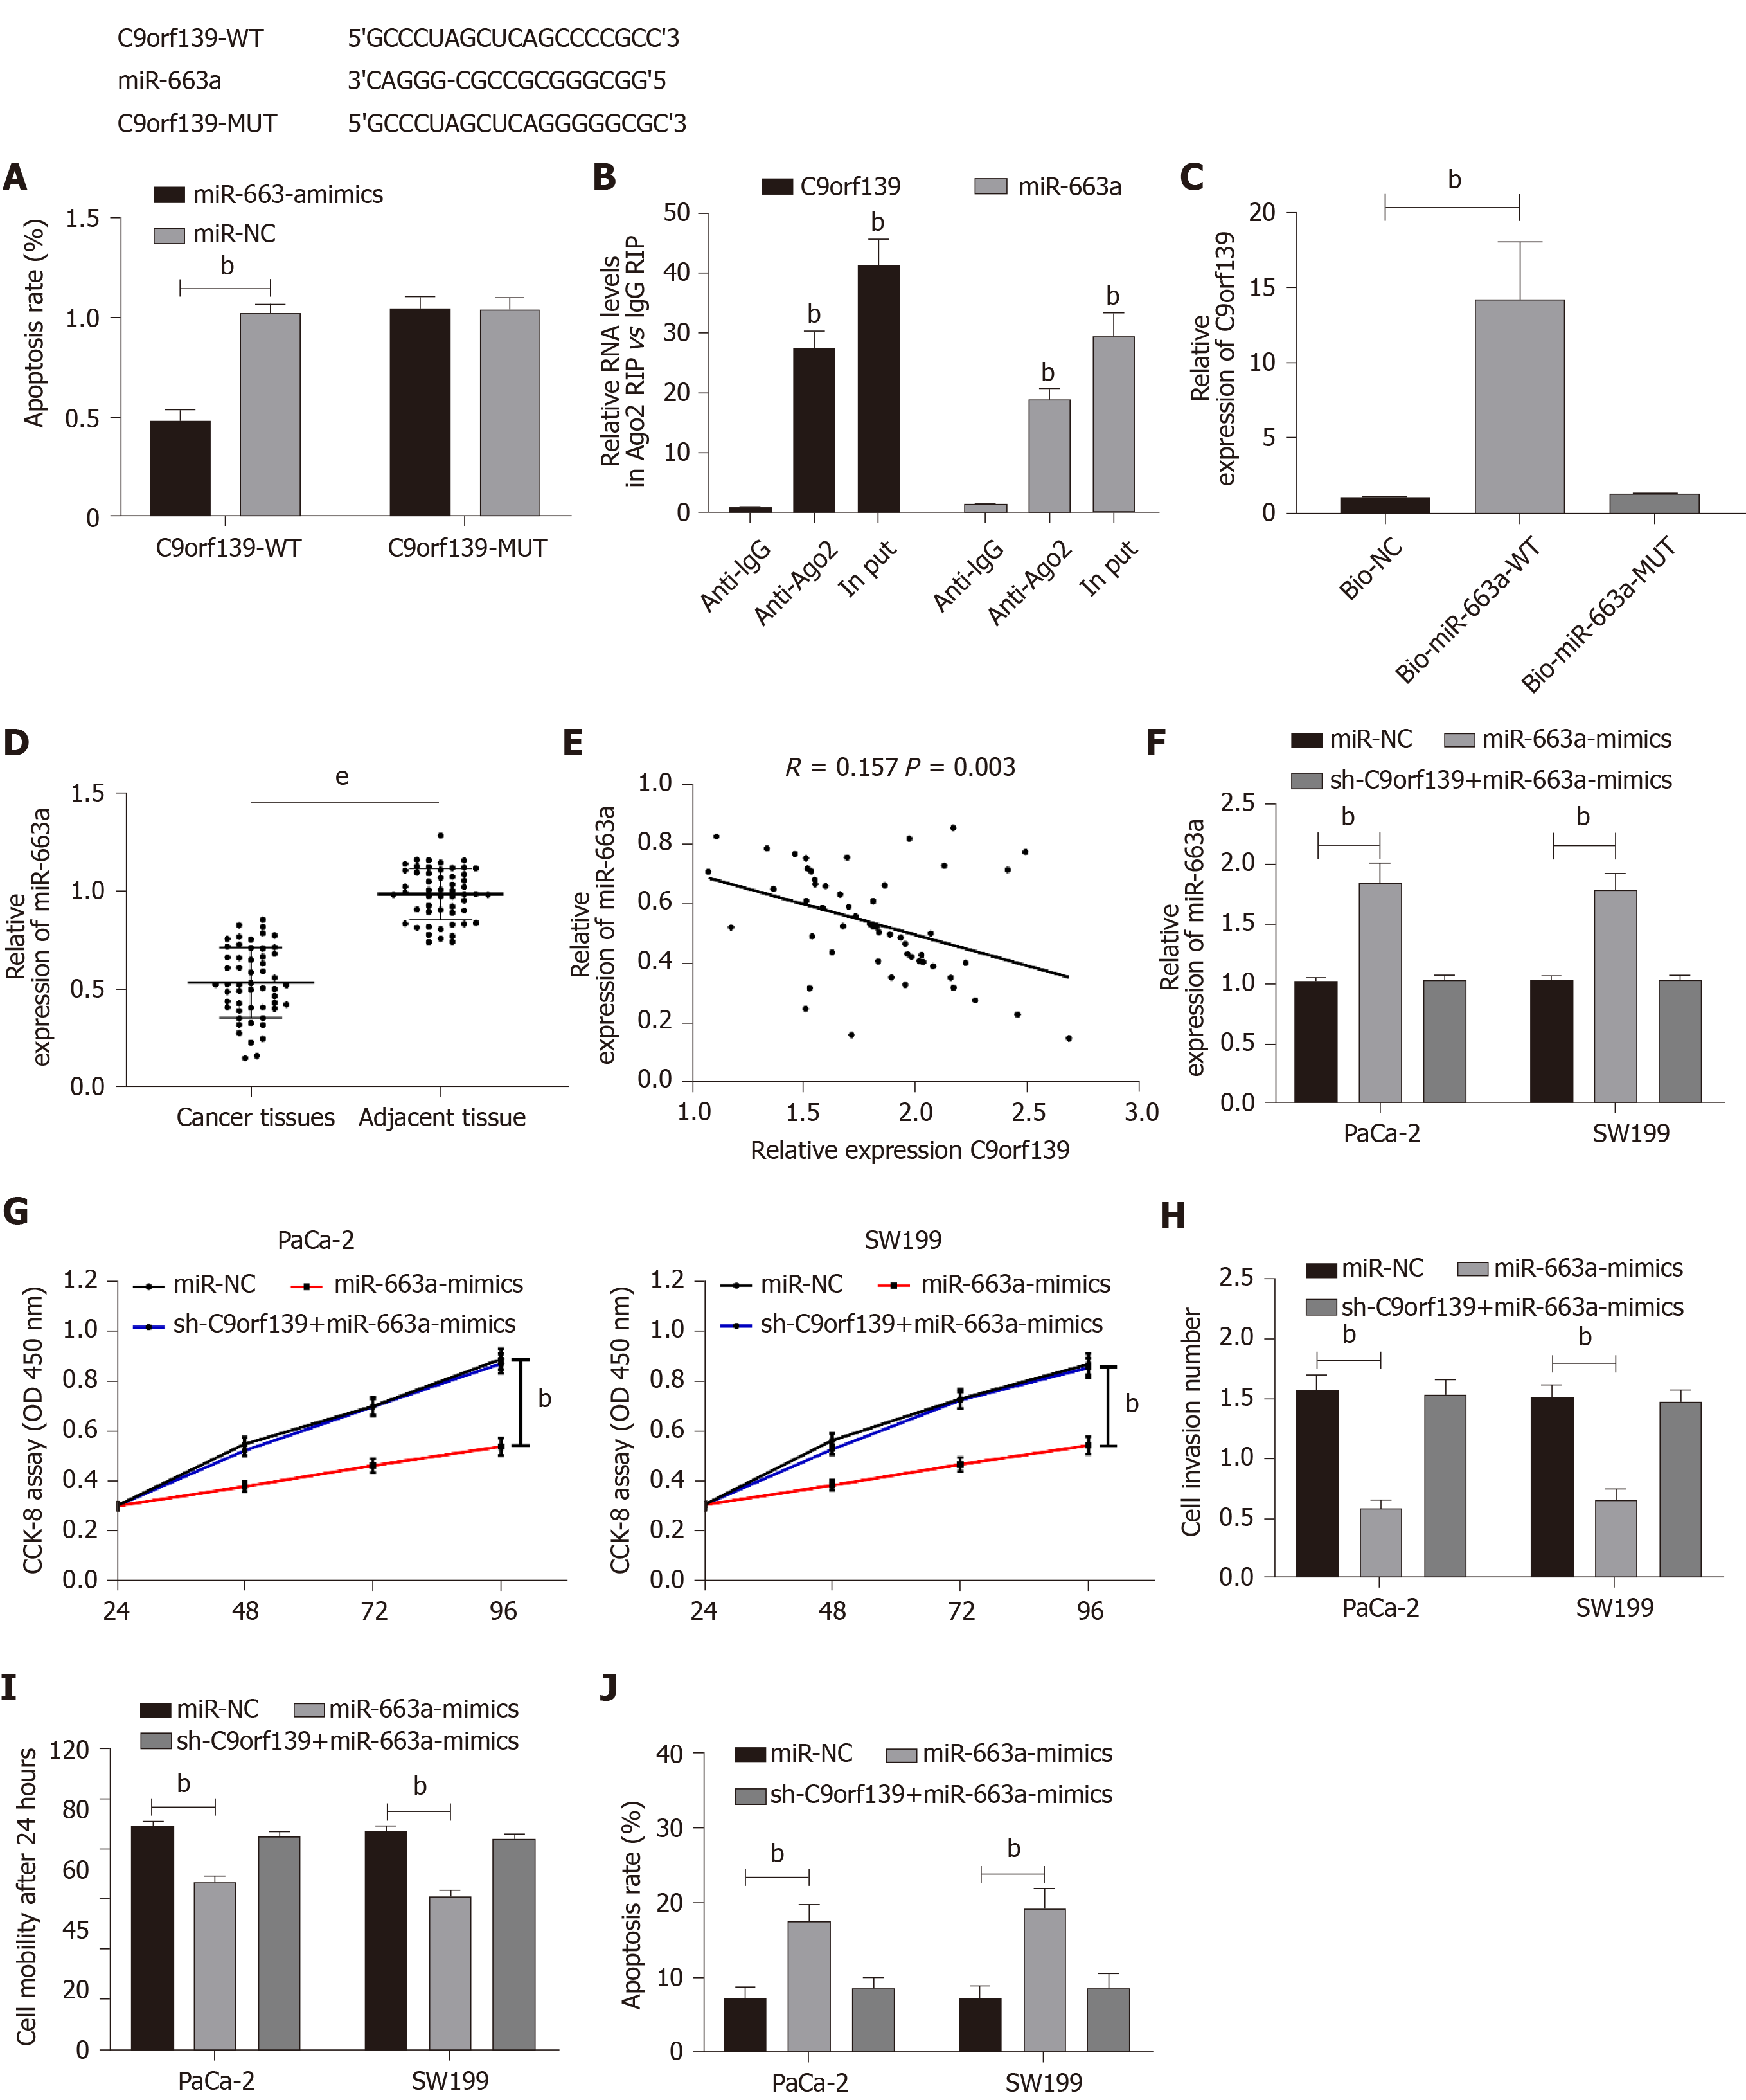
Figure 3 Effect of long non-coding RNA C9orf139 and miR-663a on pancreatic cancer cell behaviors.
A: Dual-luciferase reporter assay revealed a target binding between C9orf139 and miR-663a; B: RNA immunoprecipitation assay showed the enrichment of C9orf139 and miR-663a in PaCa-2 cells containing Ago2 antibody, with IgG antibody as a negative control; C: RNA pull-down assay was performed in PaCa-2 cells with biotin-labeled miR-663a, and then qRT-PCR was conducted to measure C9orf139 expression; D: Expression of miR-663a in patients with pancreatic cancer; E: Correlation analysis between miR-663a and C9orf139 in patients with pancreatic cancer; F: Relative expression of miR-663a in cells after the transfection; G: Cell proliferation after the transfection; H: Cell invasion after the transfection; I: The 24 h migration after the transfection; J: Cell apoptosis after the transfection. bP < 0.01 compared with the control group; eP < 0.001 compared with the control group.
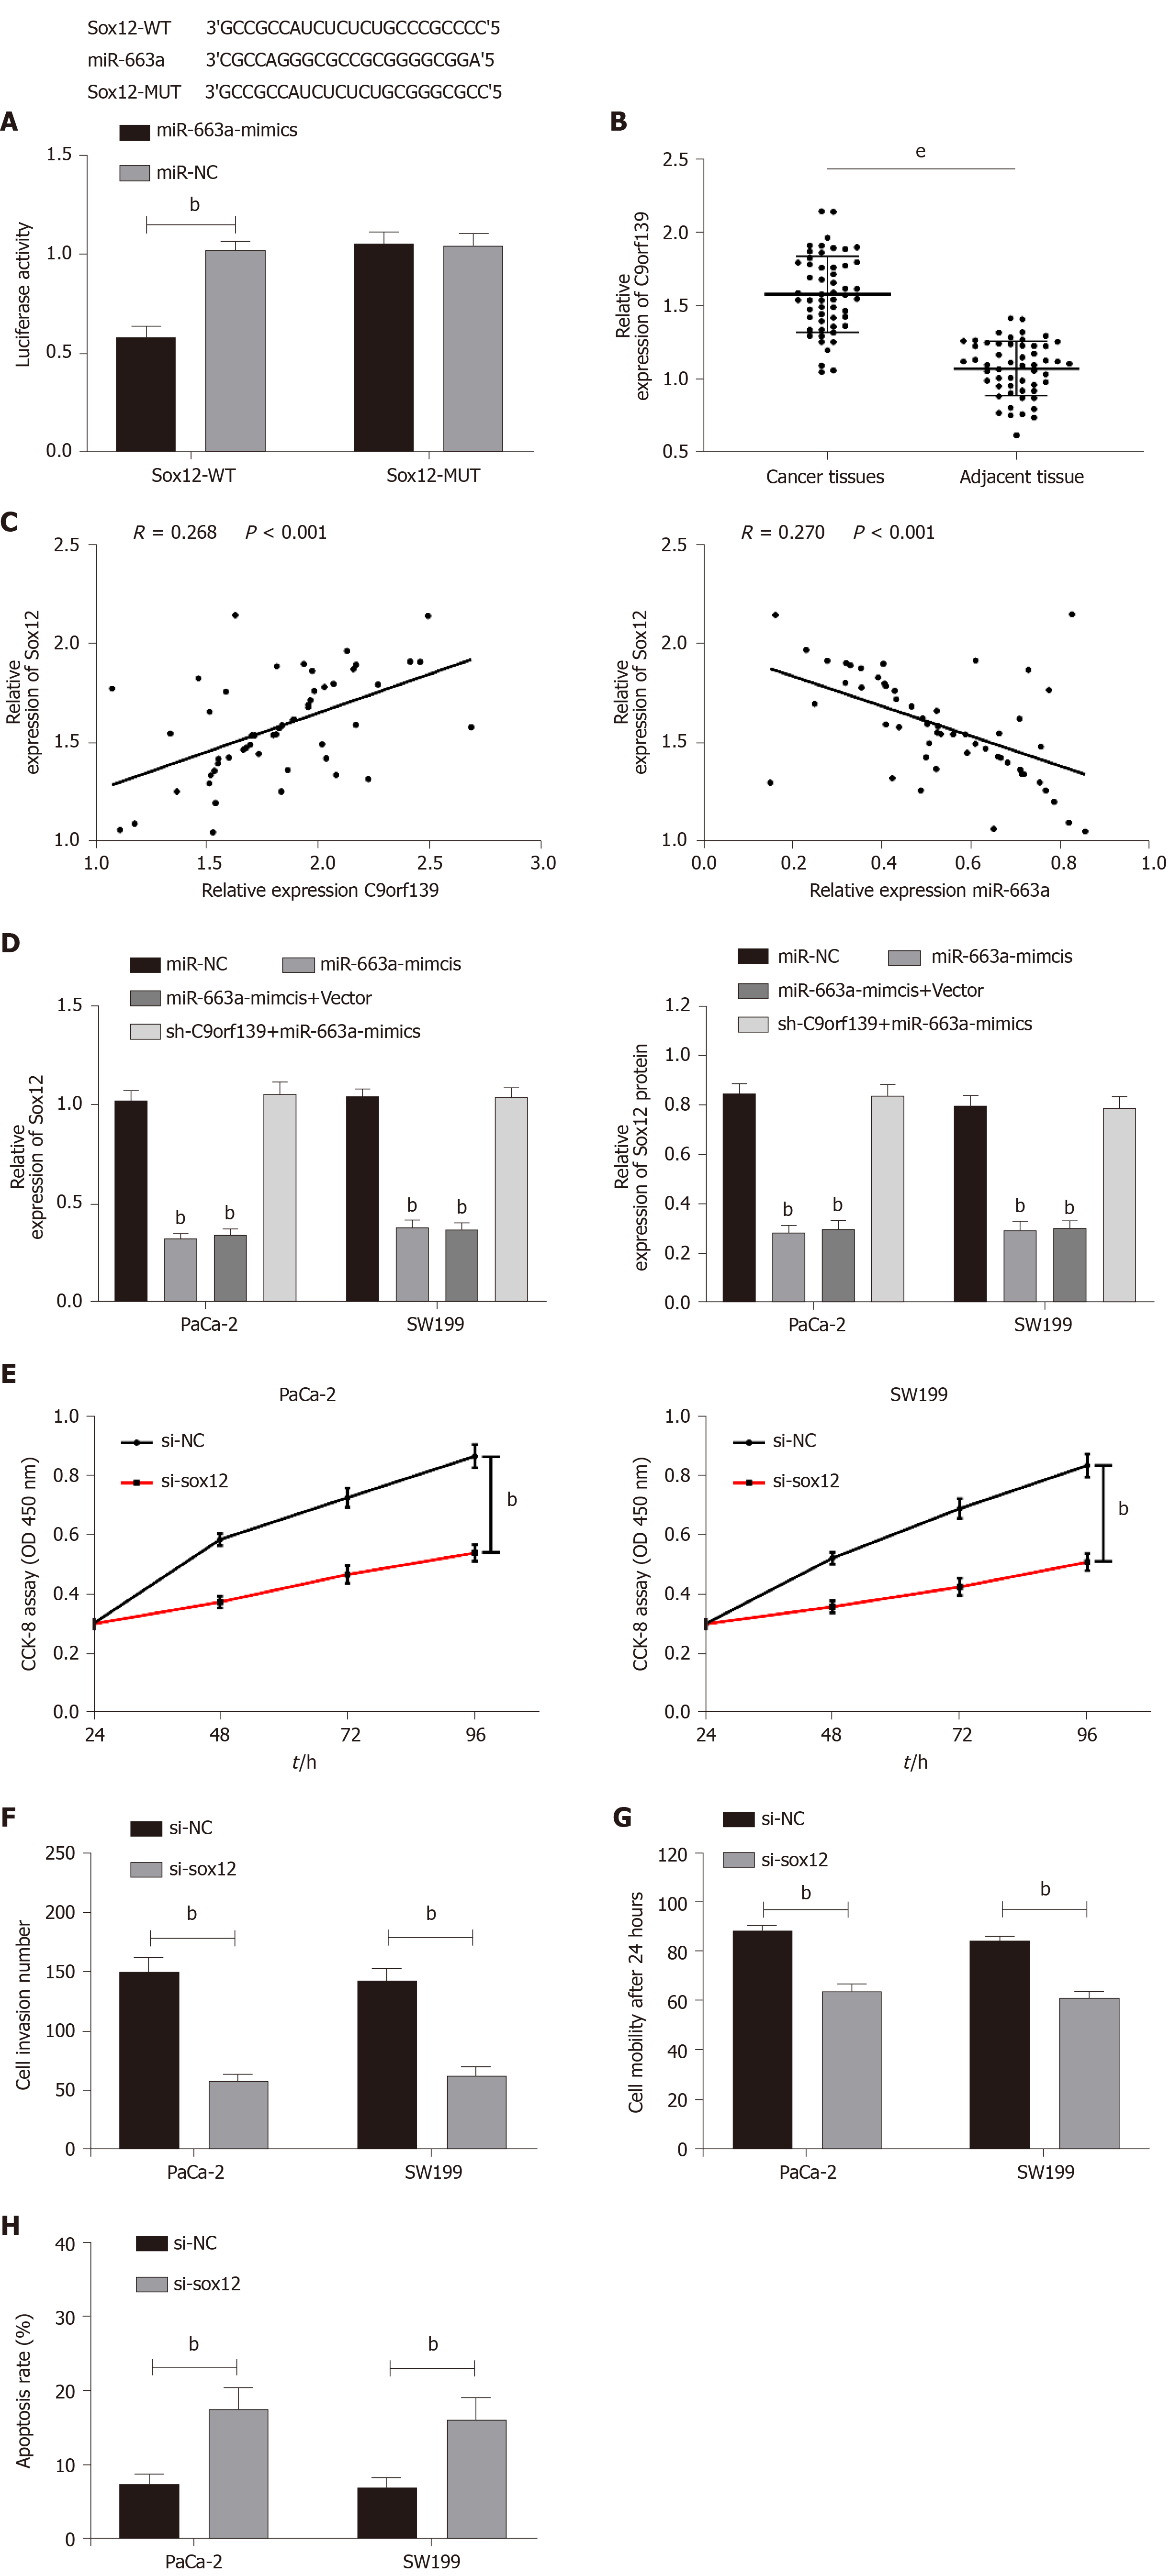
Figure 4 miR-663a inhibits pancreatic cancer cell growth by targeting Sox12.
A: Dual-luciferase reporter assay confirmed the relationship between miR-663a and Sox12; B: Expression of Sox12 in patients with pancreatic cancer; C: Sox12 was negatively correlated with miR-663a and positively correlated with C9orf139; D: Relative expression of Sox12 mRNA and protein in cells after transfection; E: Inhibited cell proliferation in pancreatic cancer cells transfected with si-Sox12; F: Inhibited cell invasion in pancreatic cancer cells transfected with si-Sox12; G: Inhibited cell migration in pancreatic cancer cells transfected with si-Sox12; H: Increased cell apoptosis in pancreatic cancer cells transfected with si-Sox12. bP < 0.01 compared with the control group; eP < 0.001 compared with the control group.
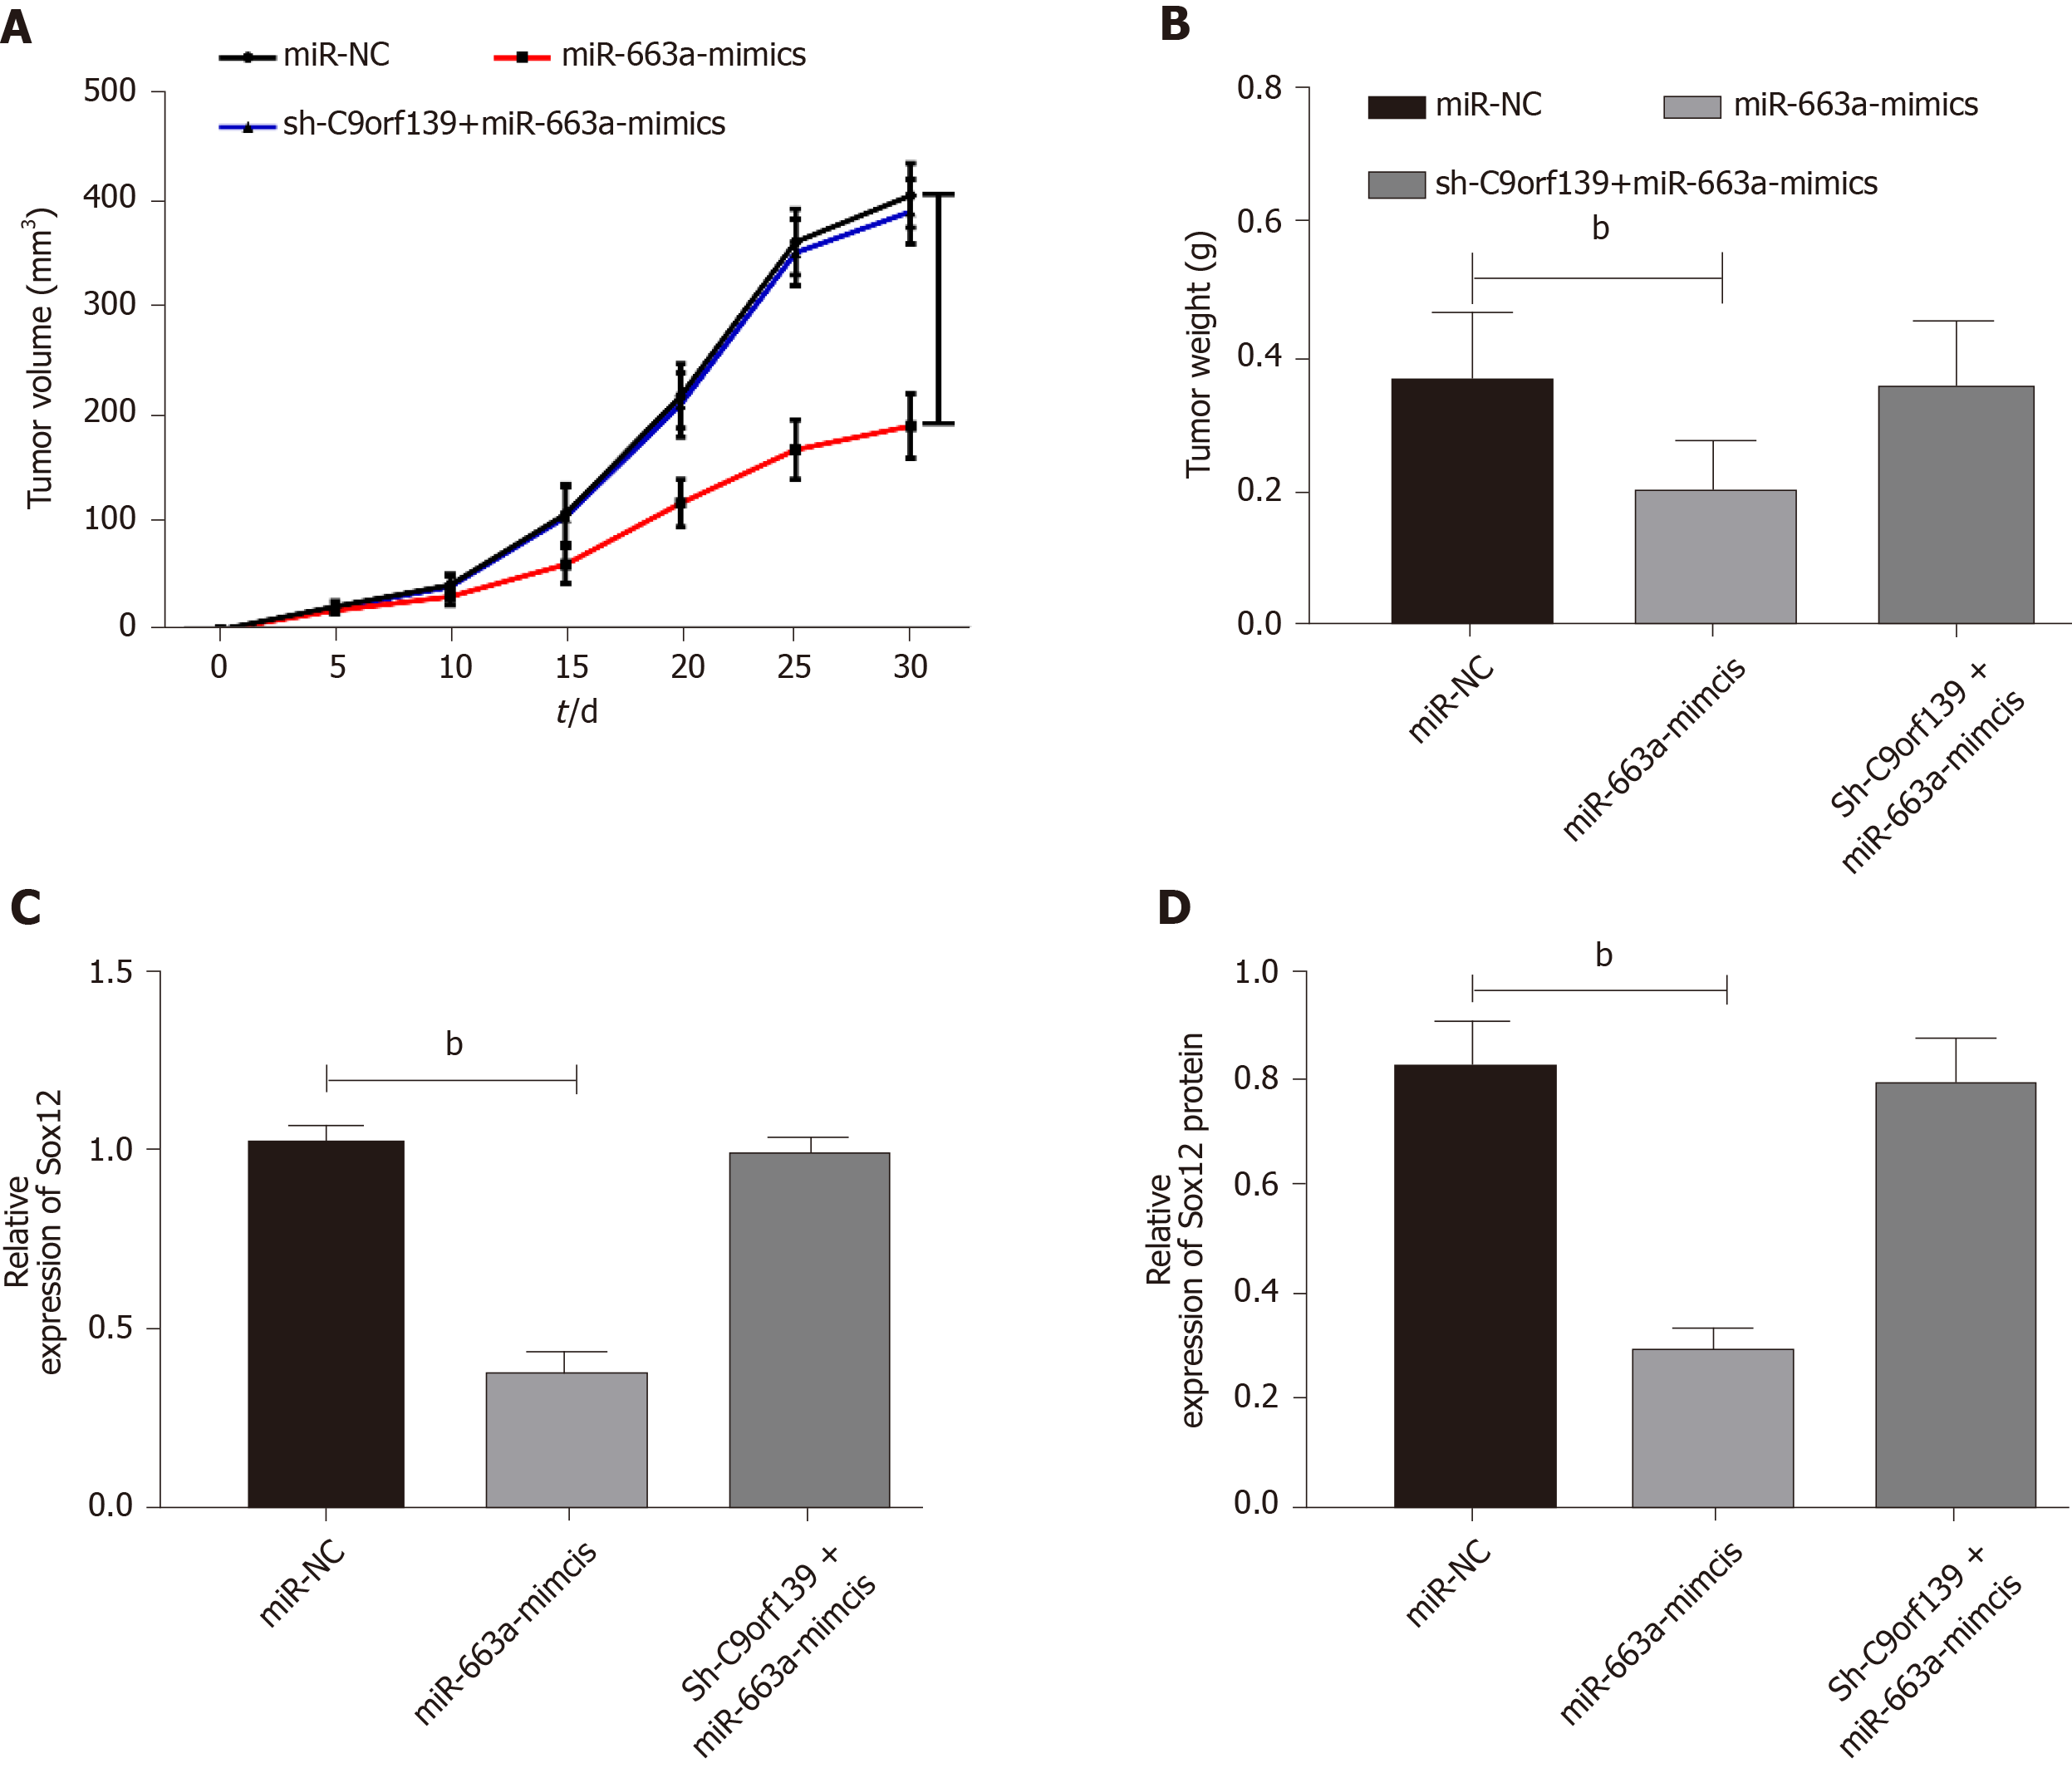
Figure 5 Effect of long non-coding RNA C9orf139 and miR-663a on tumor formation in nude mice.
A: The change of subcutaneous tumor size in nude mice during 30 d; B: Tumor size in nude mice on the 30th day; C: Expression of Sox12 mRNA in nude mouse tumors; D: Expression of Sox12 protein in nude mouse tumors. bP < 0.01 compared with the control group; eP < 0.001 compared with the control group.
- Citation: Ge JN, Yan D, Ge CL, Wei MJ. LncRNA C9orf139 can regulate the growth of pancreatic cancer by mediating the miR-663a/Sox12 axis. World J Gastrointest Oncol 2020; 12(11): 1272-1287
- URL: https://www.wjgnet.com/1948-5204/full/v12/i11/1272.htm
- DOI: https://dx.doi.org/10.4251/wjgo.v12.i11.1272


