Copyright
©The Author(s) 2020.
World J Gastrointest Oncol. Nov 15, 2020; 12(11): 1255-1271
Published online Nov 15, 2020. doi: 10.4251/wjgo.v12.i11.1255
Published online Nov 15, 2020. doi: 10.4251/wjgo.v12.i11.1255
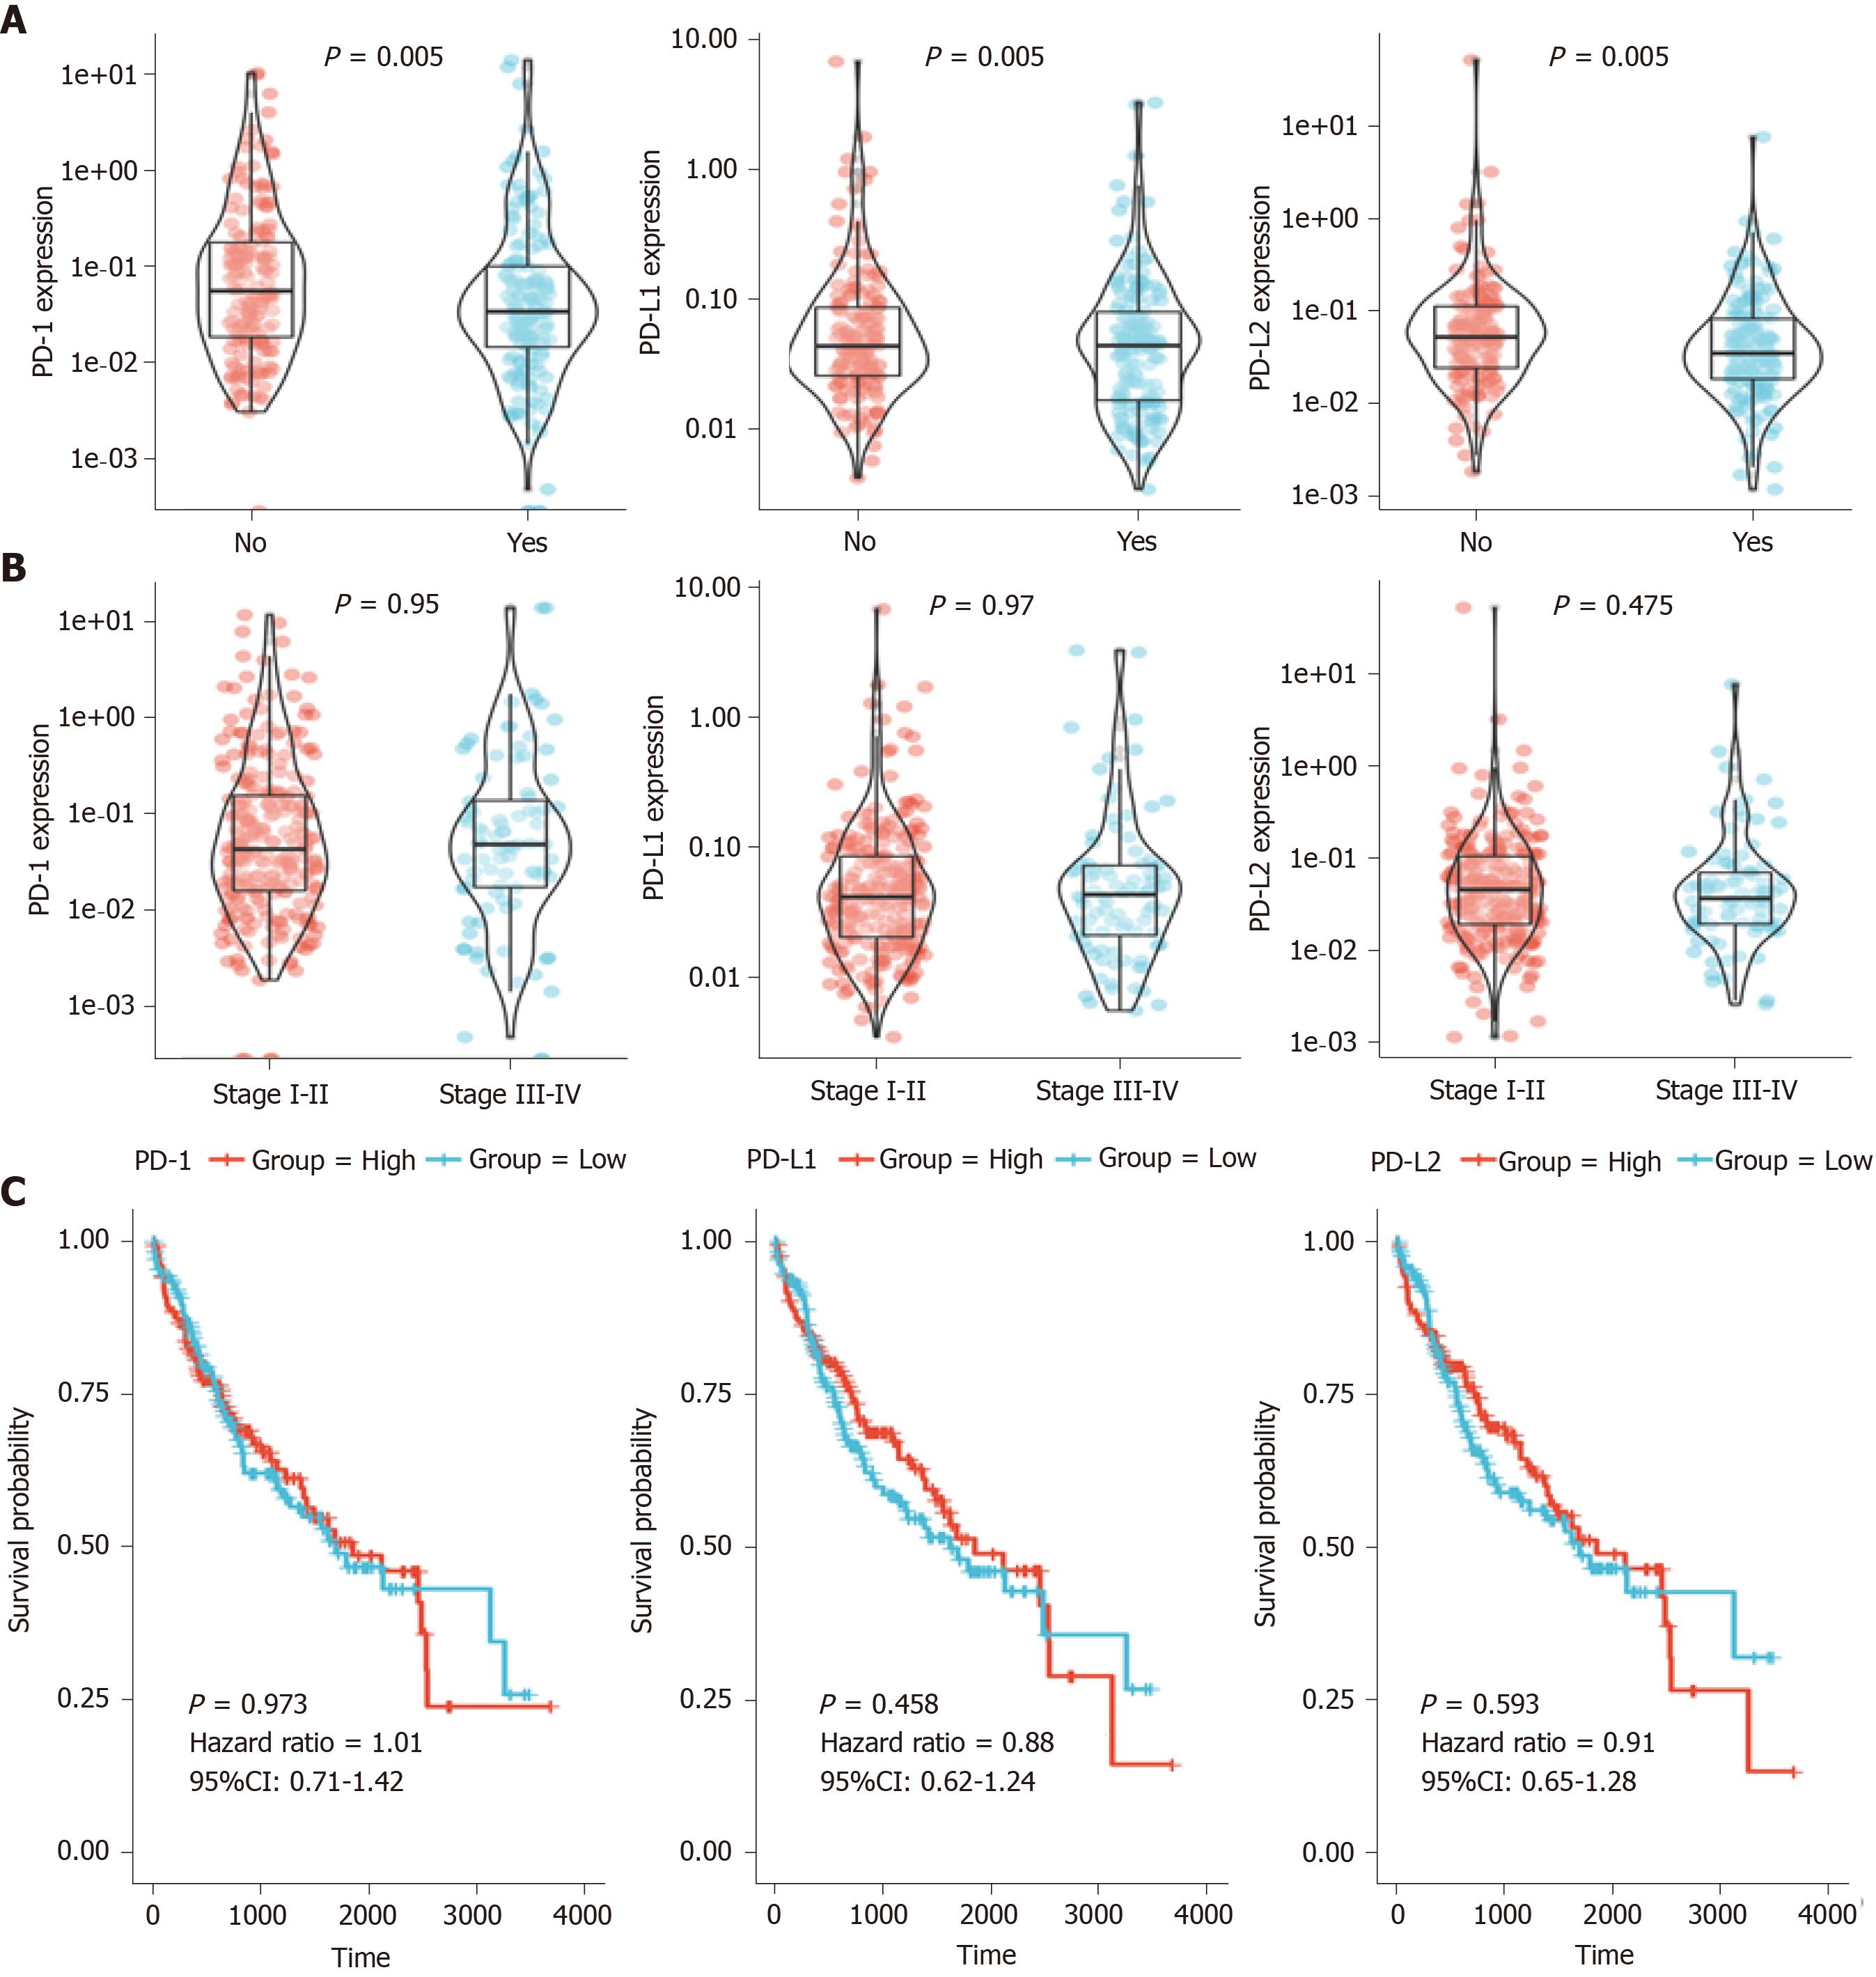
Figure 1 Relationship between gene expression and clinical data.
A: Programmed death 1 (PD-1)/programmed death ligand 1 (PD-L1)/programmed death ligand 2 (PD-L2) expression in recurrence and non-recurrence groups; B: PD-1/PD-L1/PD-L2 expression in stage I-II and stage III-IV groups; C: Prognostic analysis of PD-1/PD-L1/PD-L2 in hepatocellular carcinoma. The median of the expression value was selected as the cut-off point. KM plotter was used for prognosis analysis. PD-1: Programmed death 1; PD-L1: Programmed death ligand 1; PD-L2: Programmed death ligand 2; CI: Confidence interval.
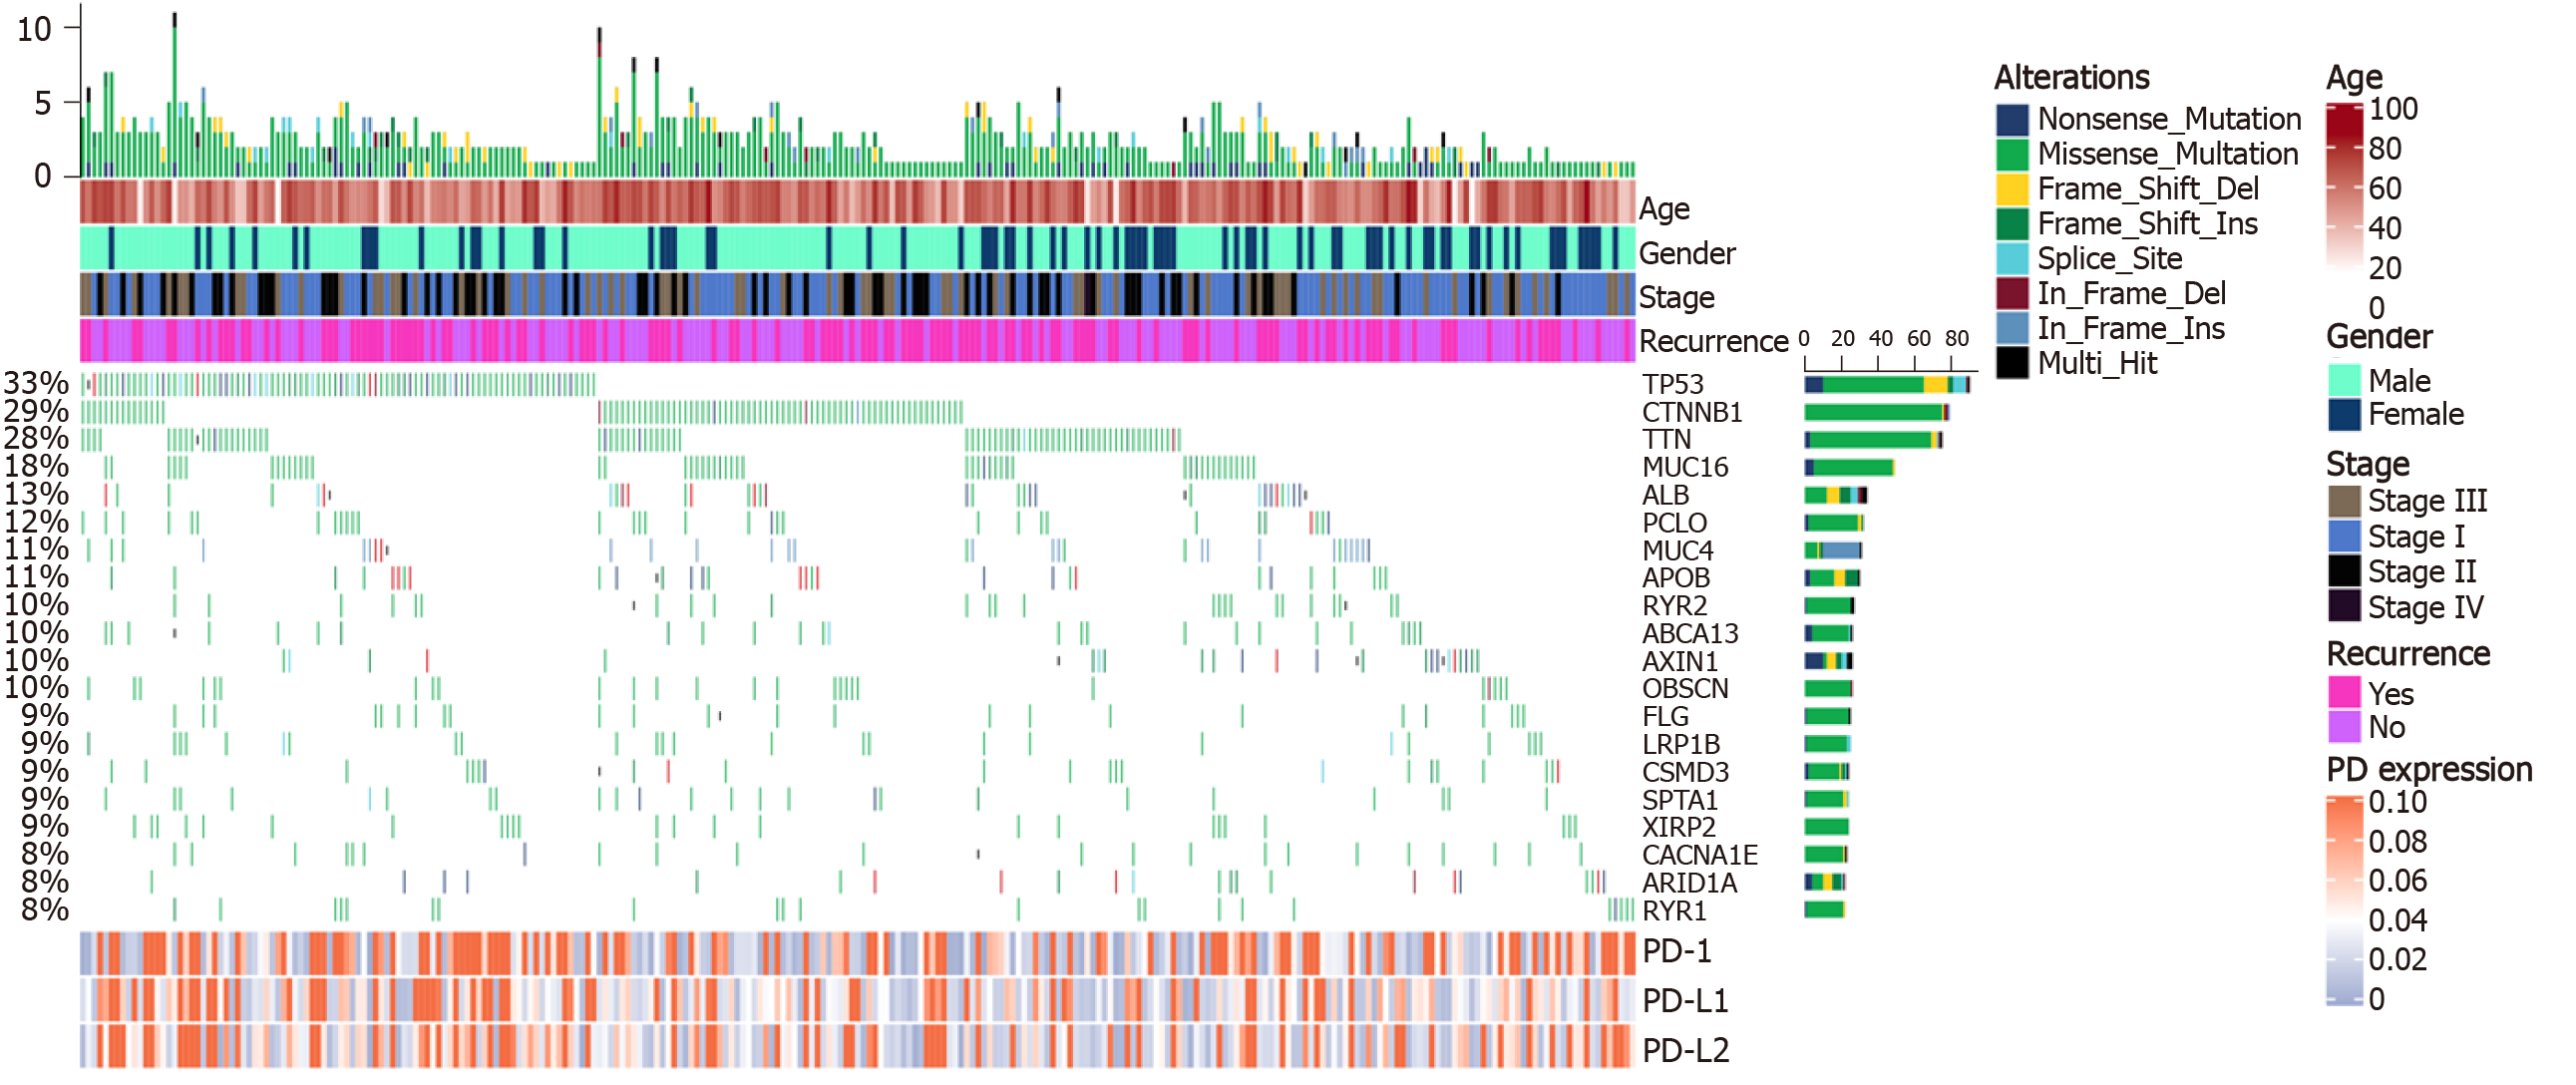
Figure 2 Co-mutation plot of highly frequent mutations in liver cancer.
Mutational frequencies are given in a bar plot beside the co-mutation plot. Overall mutation load as the total number of mutations in each patient is presented in the top barplot. Programmed death 1/programmed death ligand 1/programmed death ligand 2 expression is illustrated in a heatmap in the panel below. Clinical data including age, stage, and recurrence event are shown in the top panel. TP53: Tumor suppressor protein p53; CTNNB1: Catenin beta 1; TTN: TITIN; CACNA1E: Calcium voltage-gated channel subunit alpha1 E; RYR: Ryanodine receptor; PD-1: Programmed death 1; PD-L1: Programmed death ligand 1; PD-L2: Programmed death ligand 2.
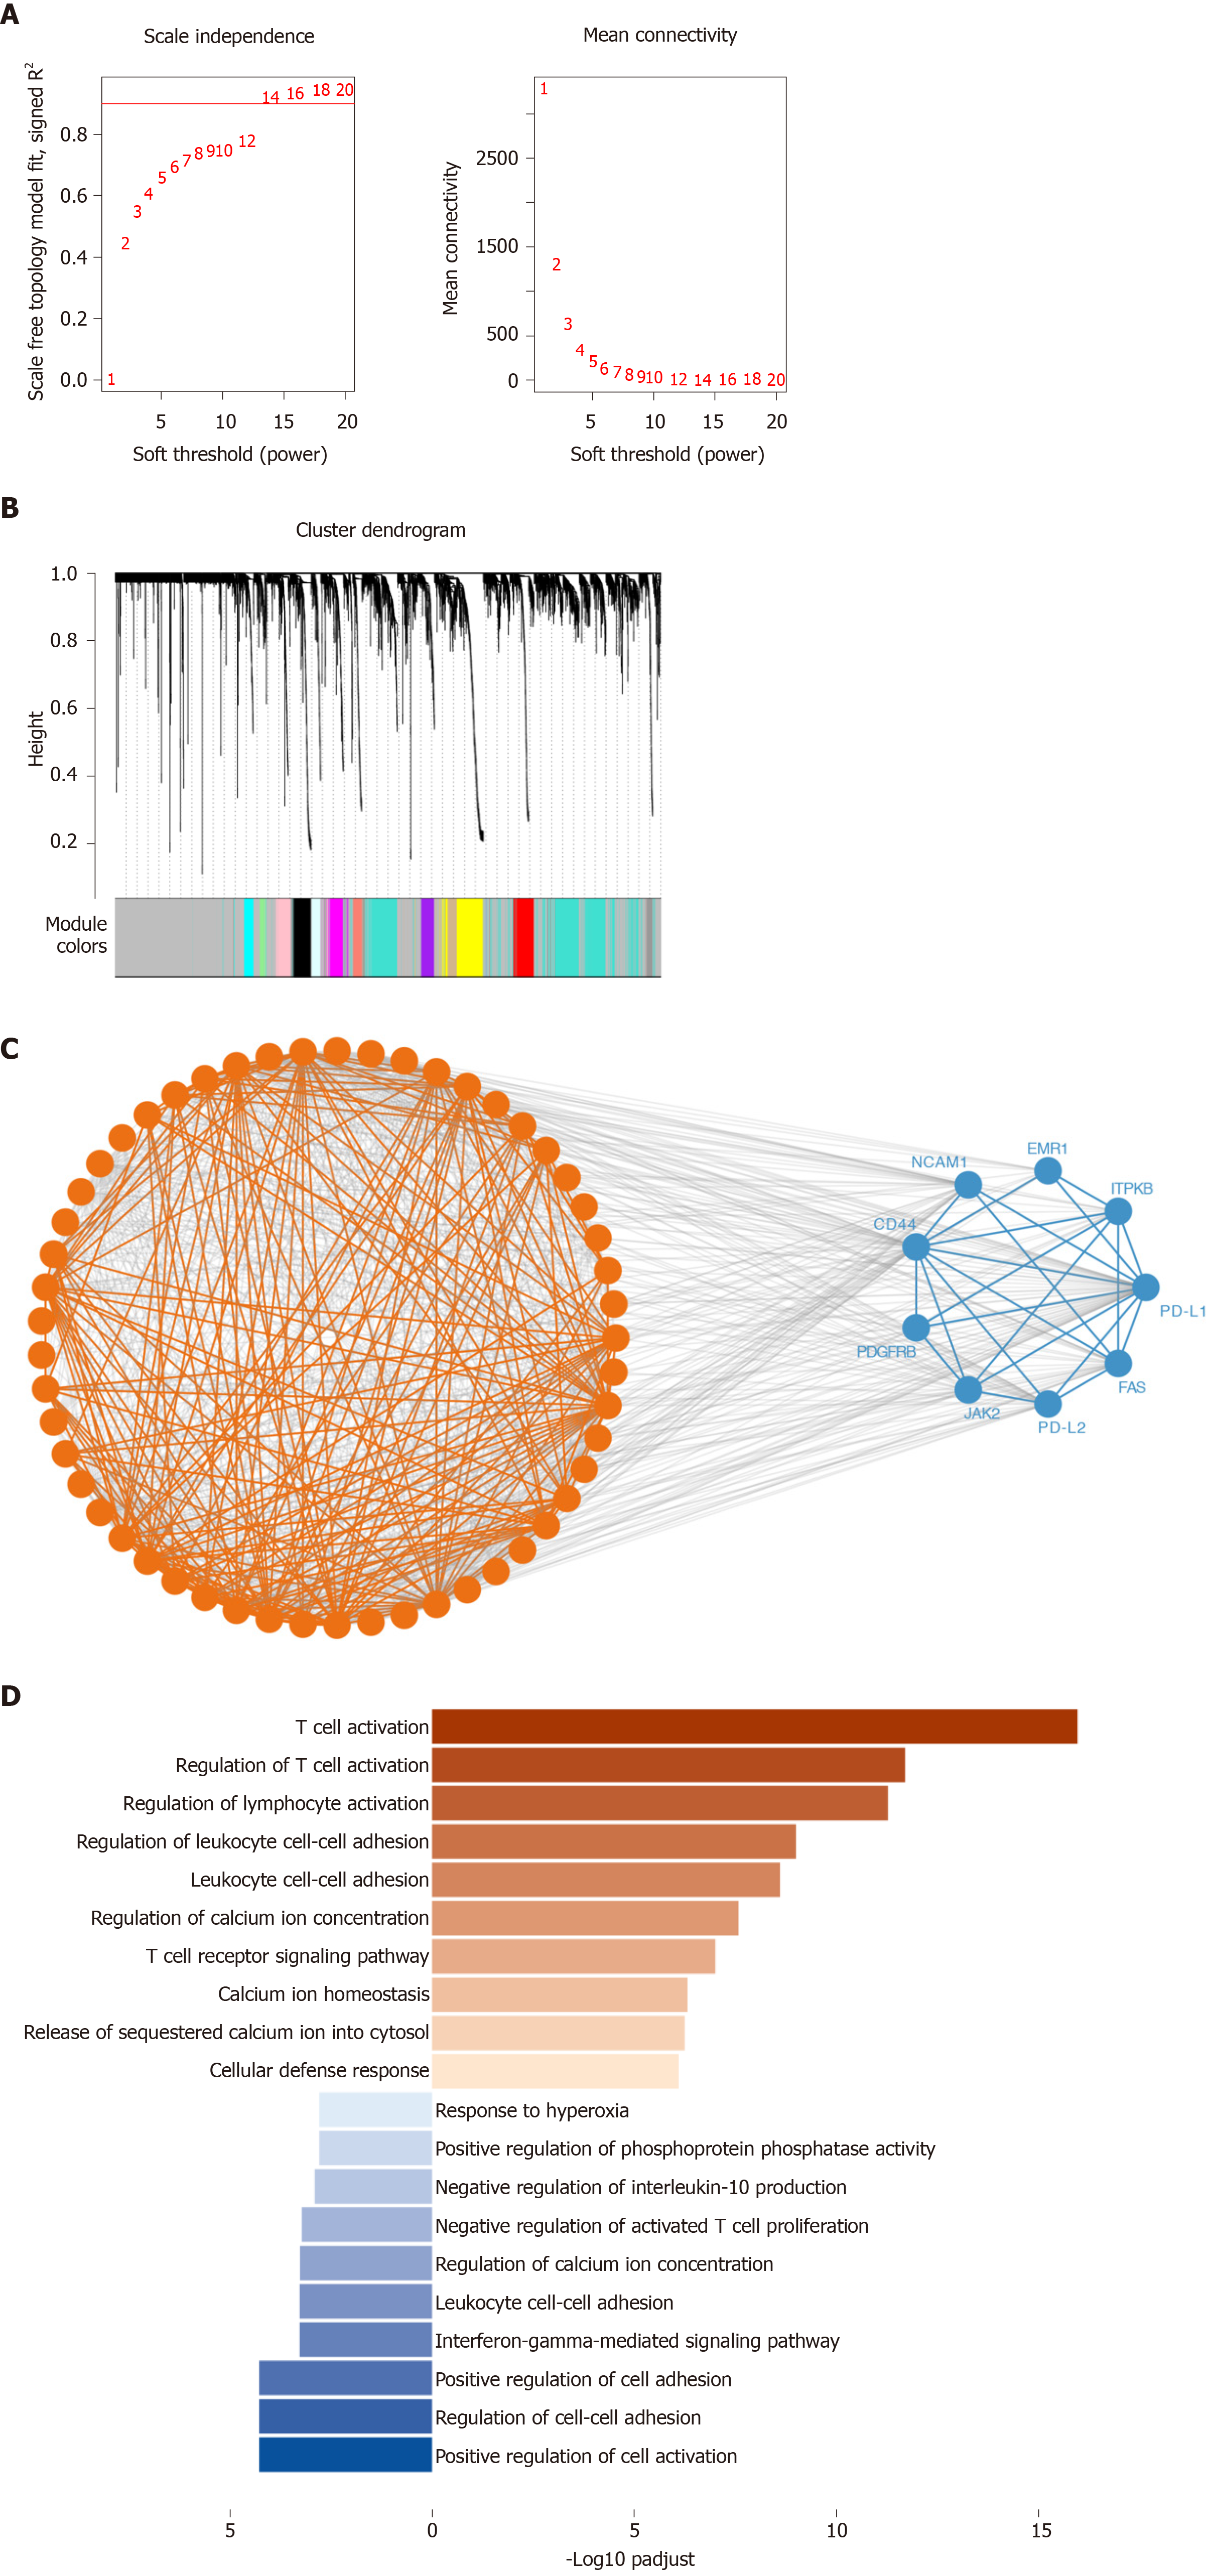
Figure 3 Co-expression analysis of genes associated with programmed death 1, programmed death ligand 1, and programmed death ligand 2.
The weighted correlation network analysis (WGCNA) and string datasets were used to select the co-expressed genes. We used WGCNA to identify gene-related modules, and then used STRING database to determine the true interaction of genes. A: Soft threshold selected in the WGCNA analysis. We selected the threshold for R2 to exceed 0.9 for the first time as the soft threshold, and for subsequent analysis 14 was selected as the threshold; B: Distribution of genes in WGCNA; C: Protein-protein interaction of the co-expression genes in the STRING datasets. We put the module genes obtained by WGCNA analysis into the STRING database for protein interaction analysis; D: Biological processes of Gene Ontology (GO) analysis in the co-expression gene. The top ten enrichment results are used for visualization. PD-L1: Programmed death ligand 1; PD-L2: Programmed death ligand 2.
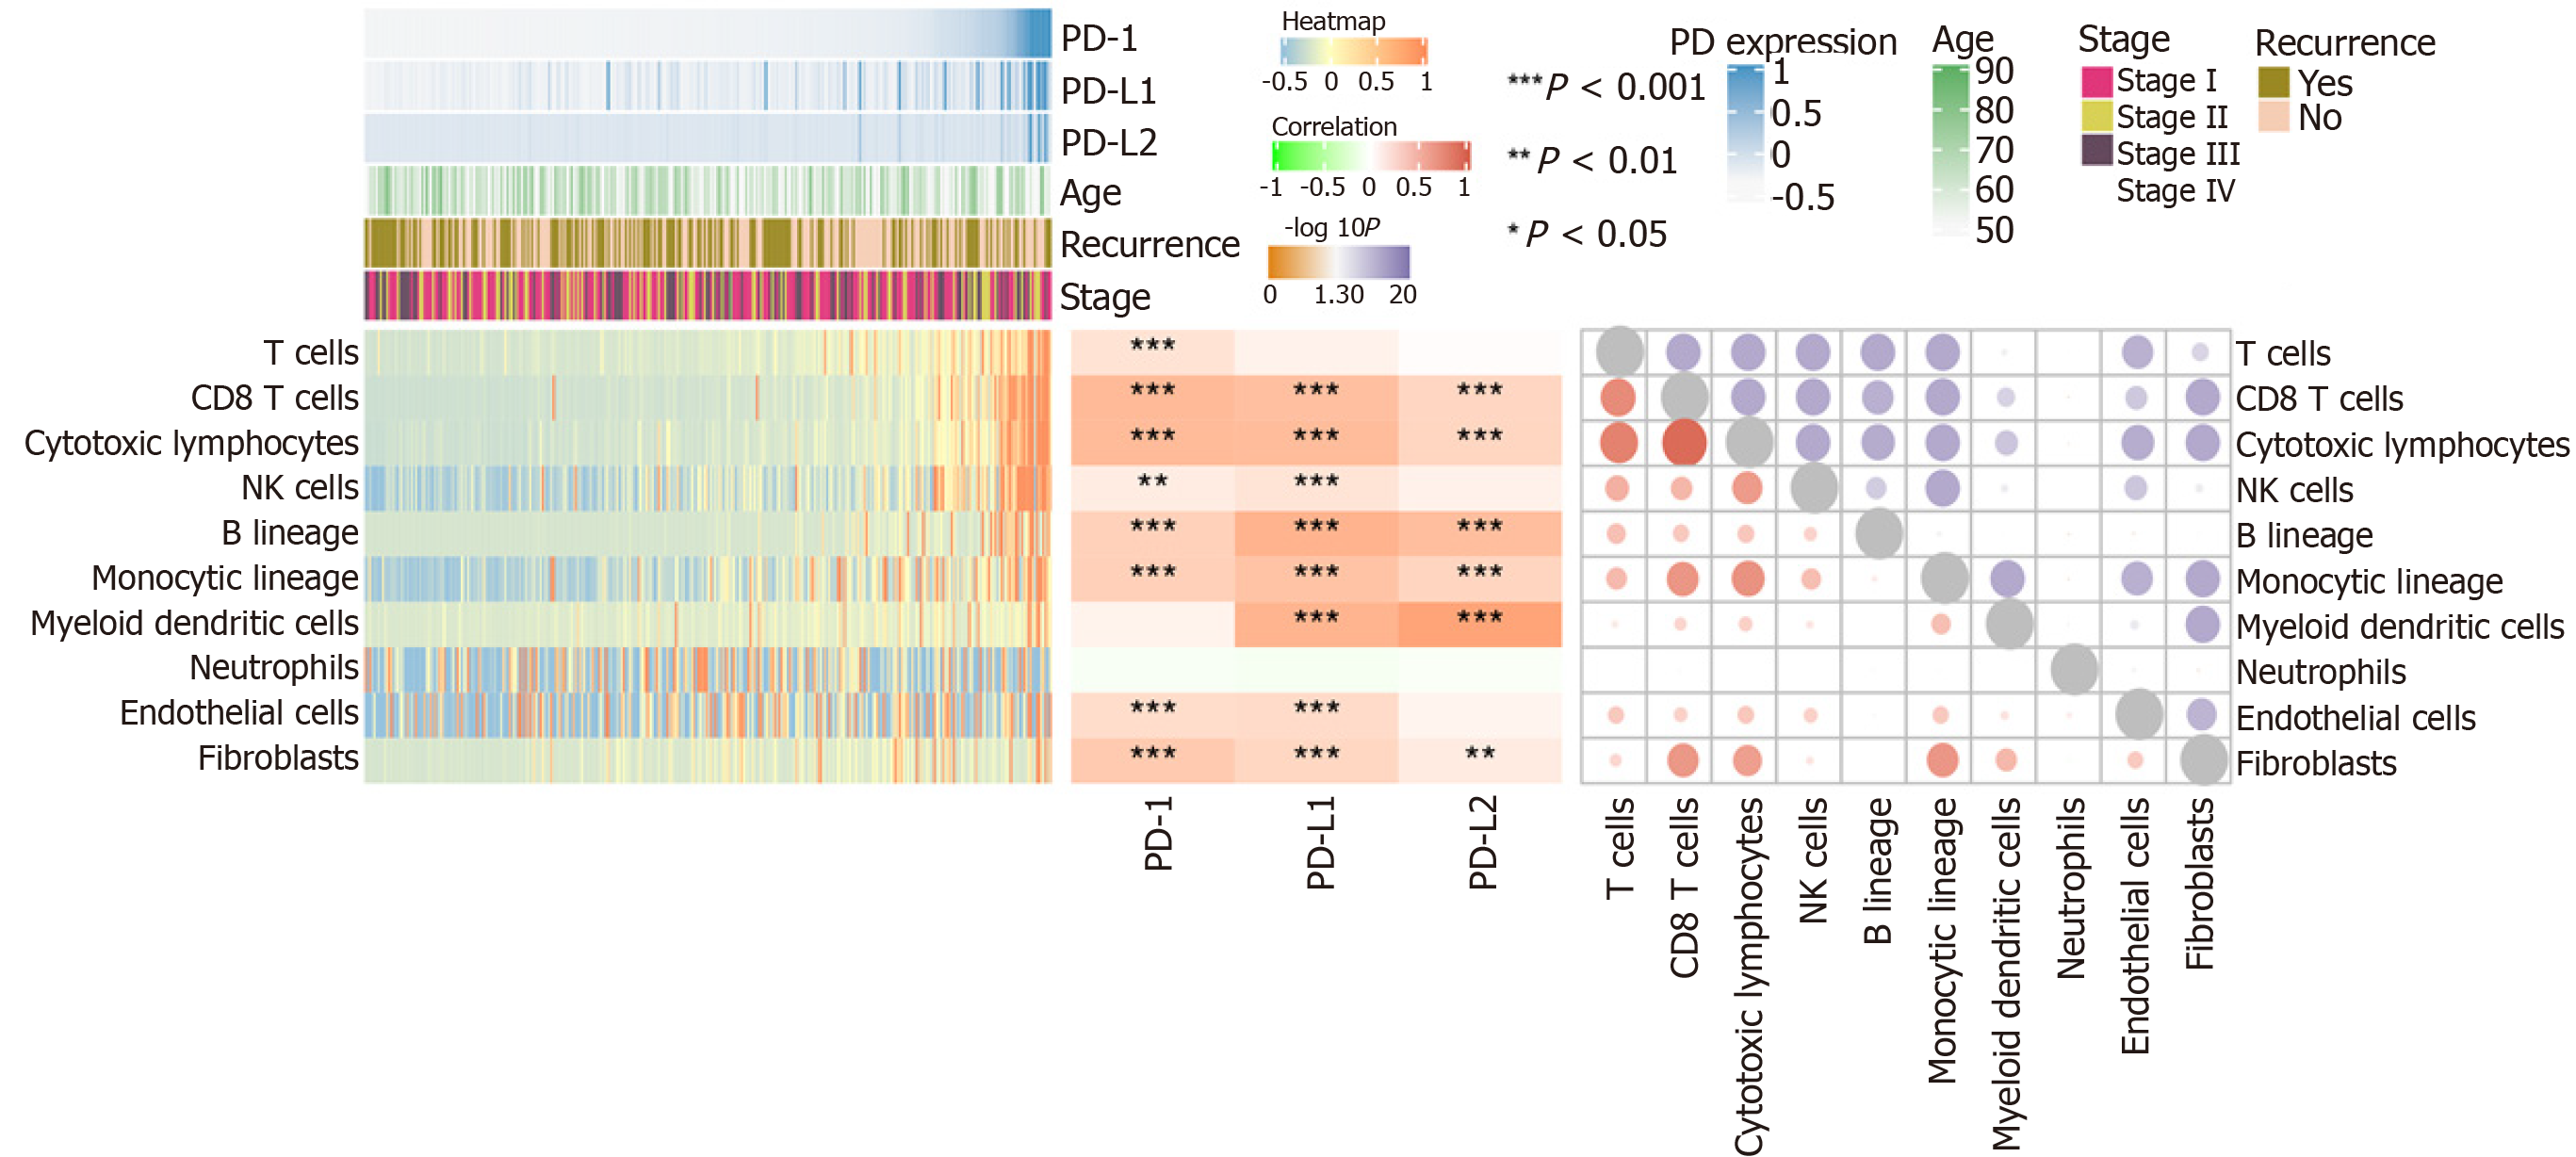
Figure 4 Programmed death 1/programmed death ligand 1/programmed death ligand 2 expression and immune infiltration.
The score of immune infiltration is calculated based on the MCP-counter algorithm. The left heatmap shows the immune infiltration score in hepatocellular carcinoma. The lower part is the immune infiltration score in each sample. The upper part is the gene expression of each sample and some common clinical features. The middle heatmap shows the relationship between gene expression and immune infiltration, and the right heatmap shows the relation among immune infiltration. The lower part is the interaction coefficient, and the upper part is the -log10 (P value) of the correlation analysis. PD-1: Programmed death 1; PD-L1: Programmed death ligand 1; PD-L2: Programmed death ligand 2; NK: Natural killer.
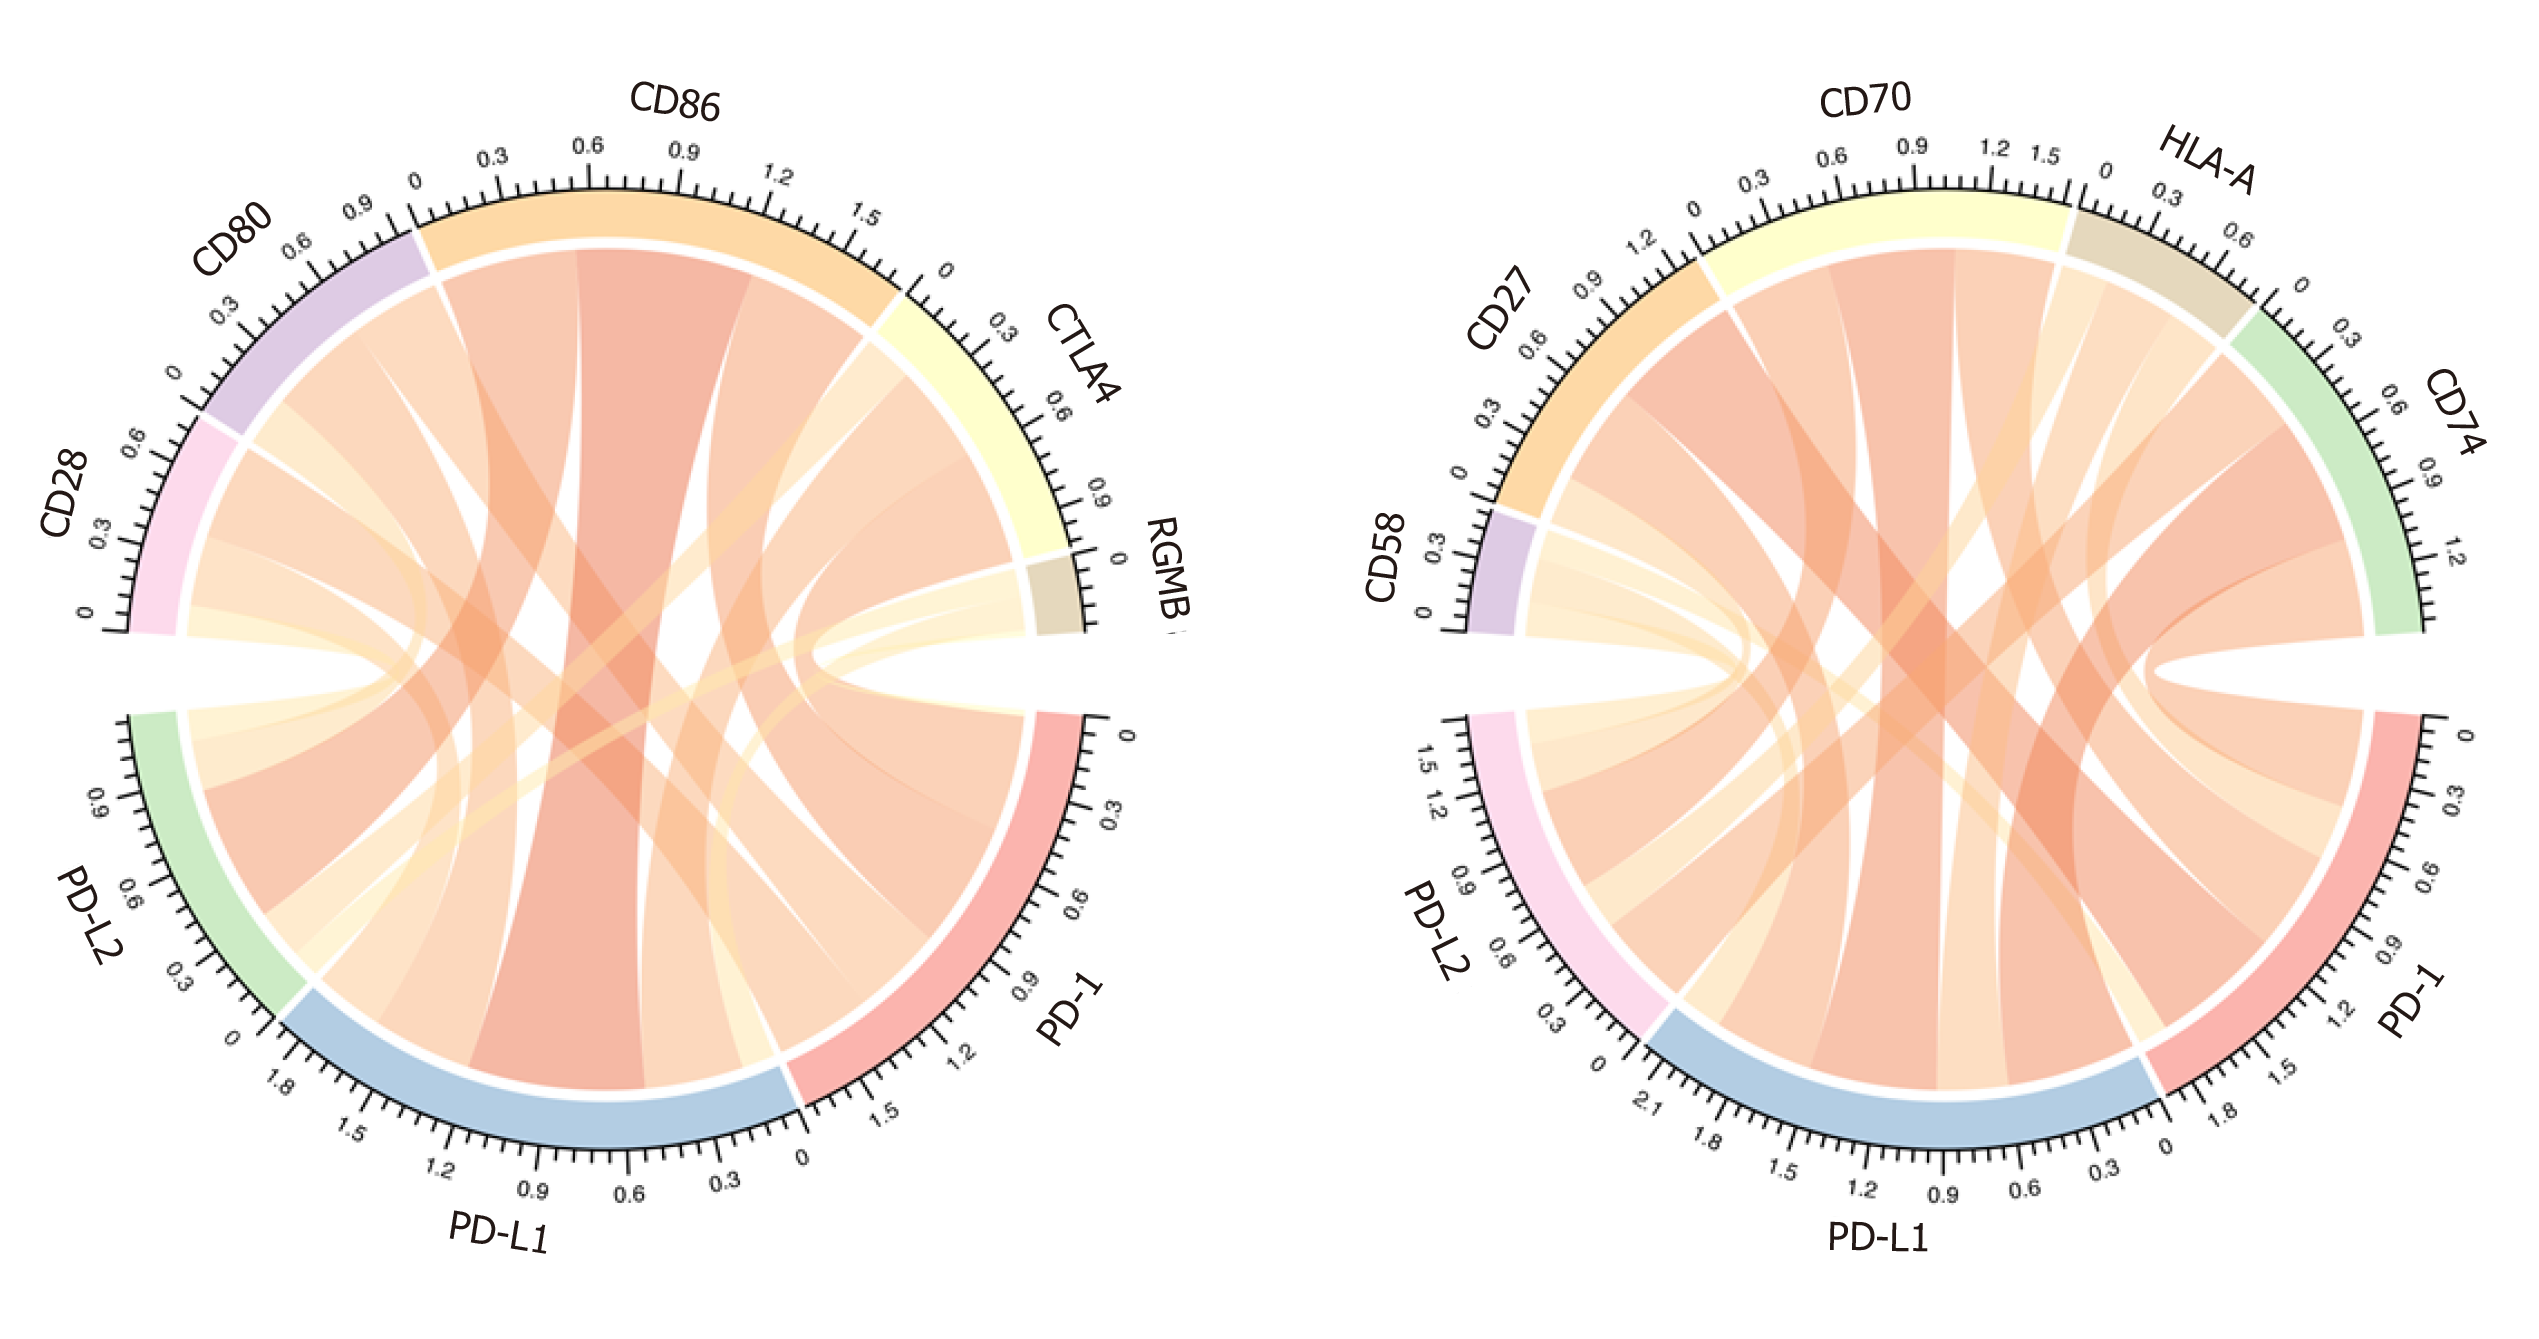
Figure 5 Correlation between programmed death 1/programmed death ligand 1/programmed death ligand 2 expression and immune checkpoint genes.
In the correlation diagram, each bar represents the interaction between two genes. The width of the strip represents the size of the correlation coefficient. PD-1: Programmed death 1; PD-L1: Programmed death ligand 1; PD-L2: Programmed death ligand 2.
- Citation: Sheng QJ, Tian WY, Dou XG, Zhang C, Li YW, Han C, Fan YX, Lai PP, Ding Y. Programmed death 1, ligand 1 and 2 correlated genes and their association with mutation, immune infiltration and clinical outcomes of hepatocellular carcinoma. World J Gastrointest Oncol 2020; 12(11): 1255-1271
- URL: https://www.wjgnet.com/1948-5204/full/v12/i11/1255.htm
- DOI: https://dx.doi.org/10.4251/wjgo.v12.i11.1255


