Copyright
©The Author(s) 2019.
World J Gastrointest Oncol. Feb 15, 2019; 11(2): 117-138
Published online Feb 15, 2019. doi: 10.4251/wjgo.v11.i2.117
Published online Feb 15, 2019. doi: 10.4251/wjgo.v11.i2.117
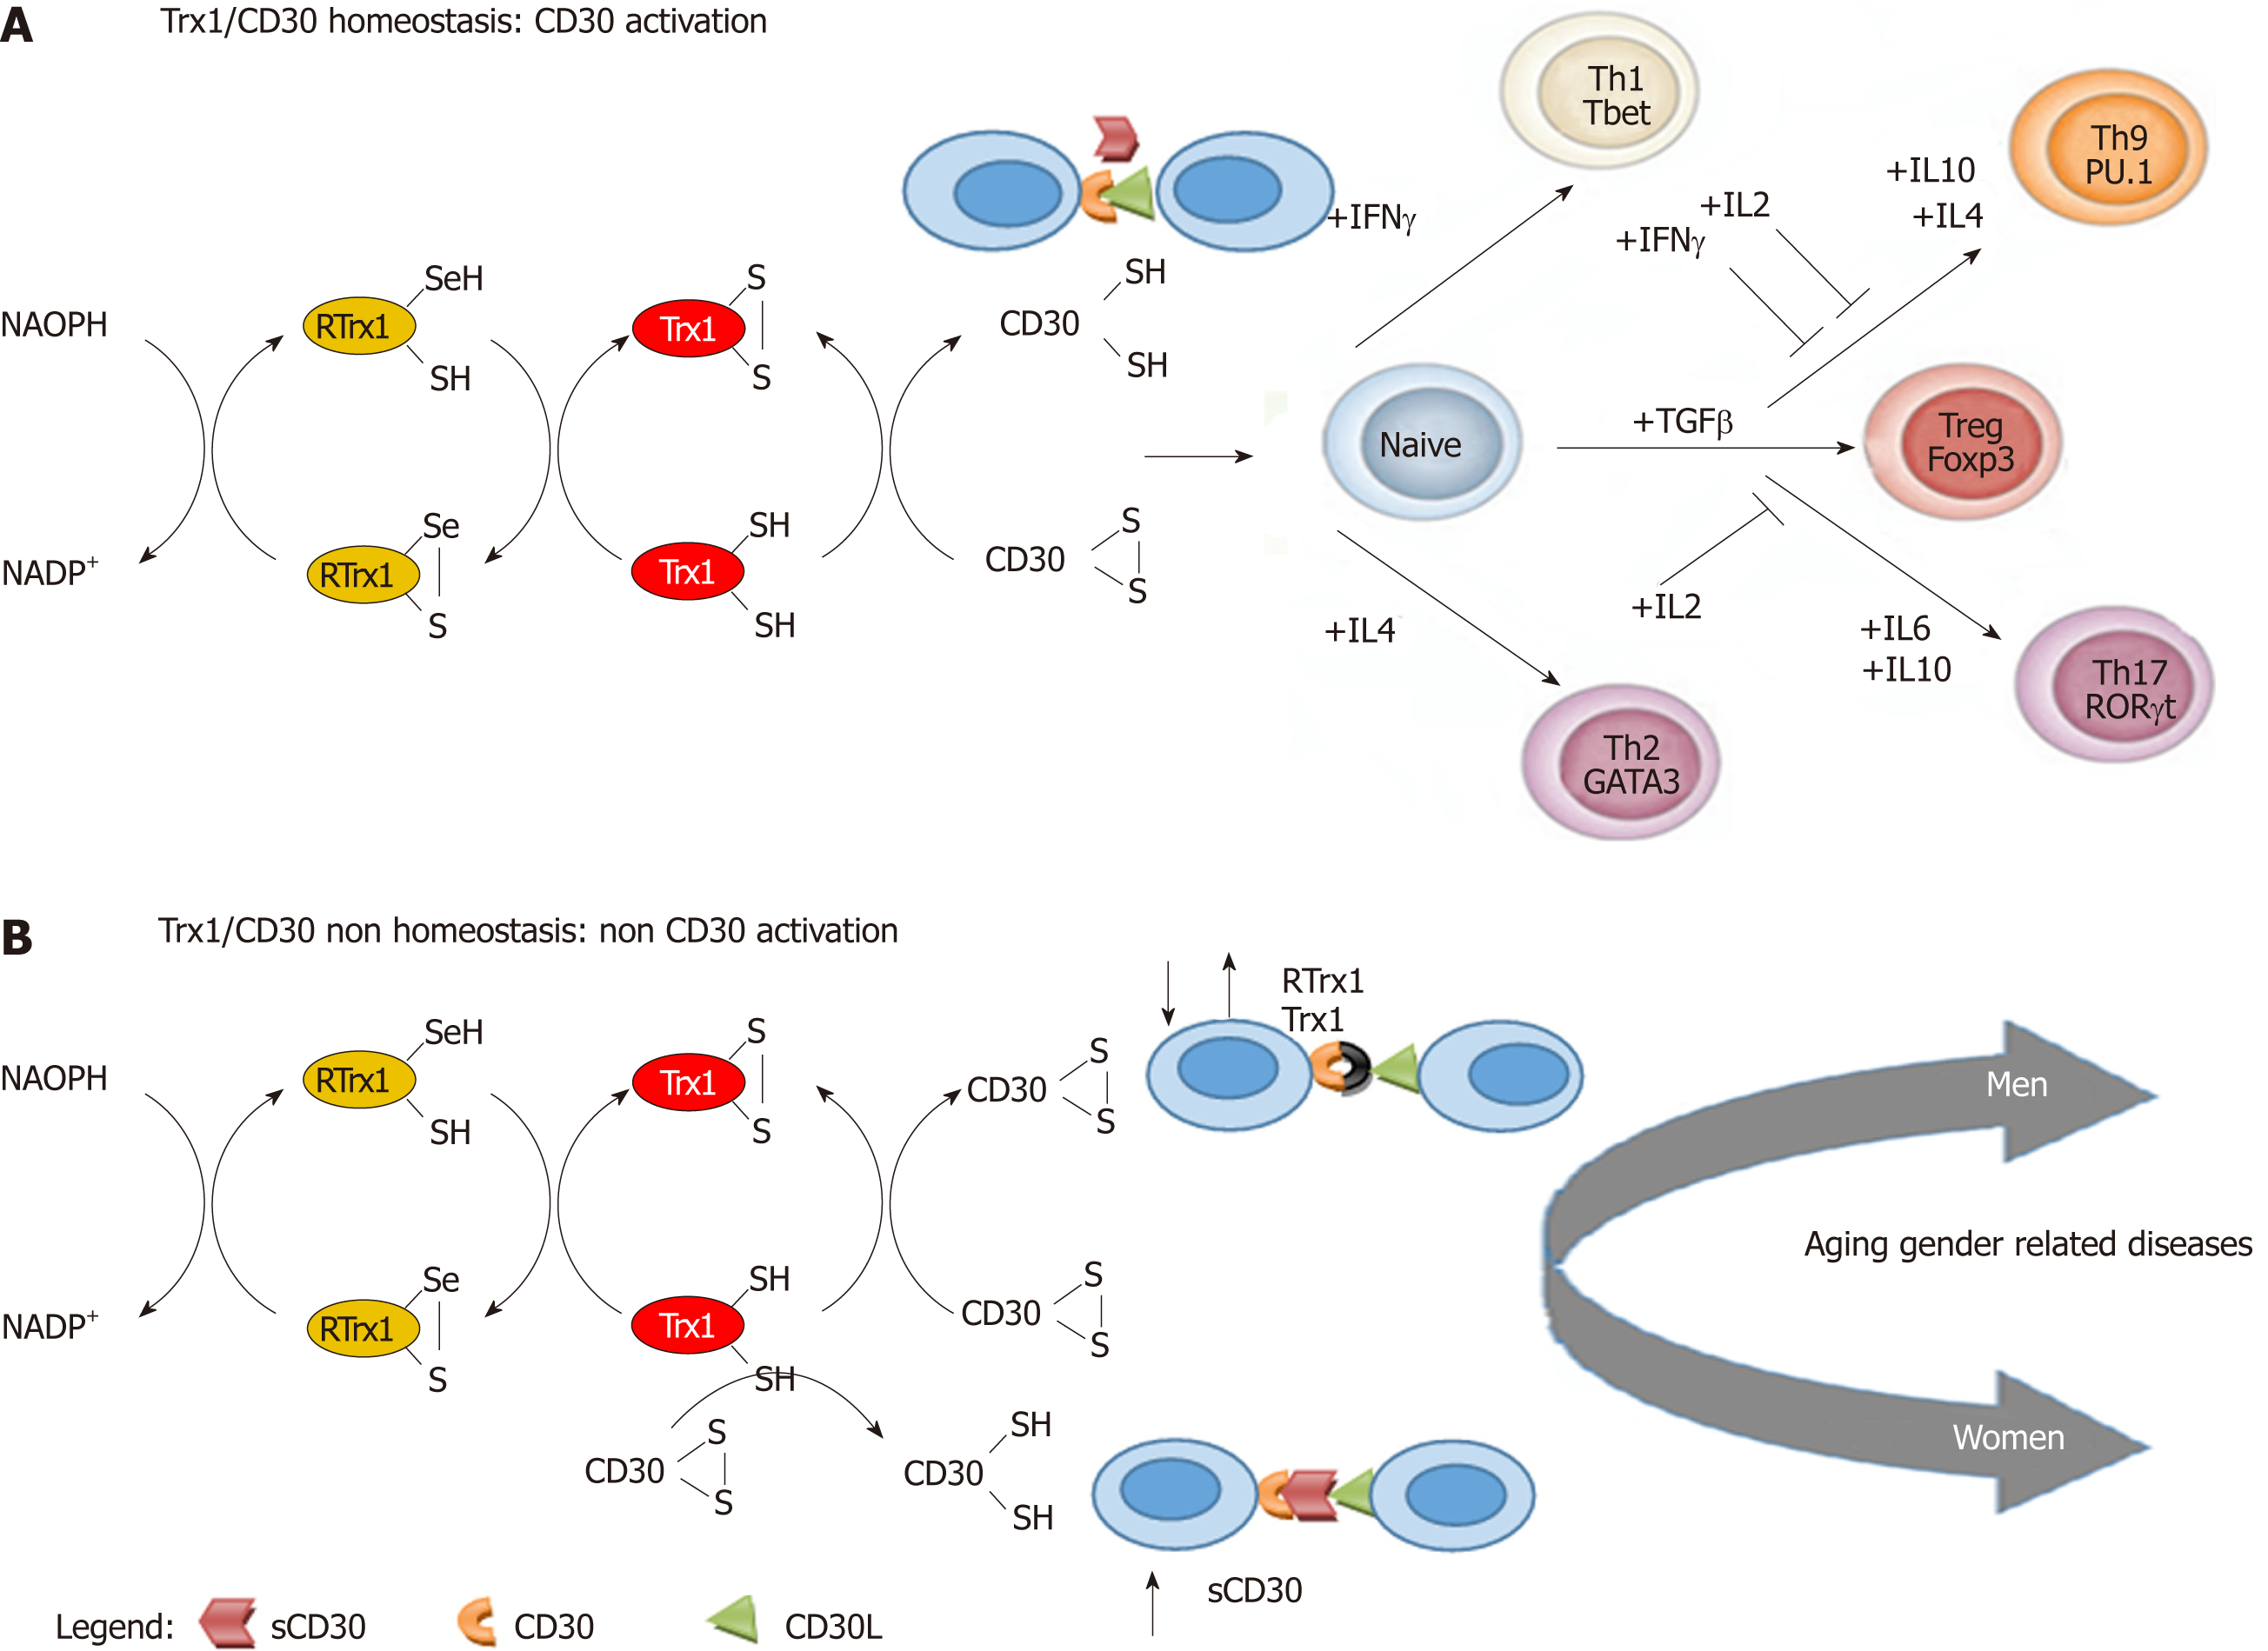
Figure 1 Trx1/CD30 redox immune regulation.
A: Trx1 oxidized form (-S-S-); Trx1 reduced form (-SH); RTrx1; NADPH. CD30 oxidized form (-S-S); CD30 reduced form (-SH); CD30L; NK, DC, monocytes, T cells, neutrophils, eosinophils and B cells. Trx1/CD30 preserves the healthy state during aging by inducing the integrate expression of IFNγ IL4, TGFβ, IL6, IL10 and IL2 cell pathways to direct Th differentiation to the respective subtypes (Th1, Th2, Treg, Th9, Th17). The cytokines in the cell environment activate specific transcription factors for the differentiation of the specific Th subsets. Th1 requires the T bet (Tbet); Th2 the GATA; Treg cells the Foxp3; Th17 the RORgt; Th9 the PU.1 bet. TGFβ activates the expression of Foxp3, which generates (↑) Treg cells. IL6 inhibits the TGFβ driven expression of Foxp3, and TGFβ together with IL6 activate the ROR-gt transcription factor, which triggers (↑) Th17 cells. Nevertheless IL2 inhibits (⊥) this induction. IL4 also inhibits TGFβ induction of the Foxp3 expression, but TGFβ together with IL4 activate the expression of the PU.1 transcription factor, which generates (↑) Th9 cells. IFNγ and IL2 inhibit (⊥) this generation; B: Deregulation (↓↑) between Trx1/RTrx1 levels and increase (↑) of the sCD30 level cause non-homeostasis of the redox-immune response and non-CD30 activation, which cause aging gender-specific disease generation. RTrx1: Thioredoxin1 reductase flavoprotein; NADPH: Nicotinamide adenine dinucleotide phosphate; CD30L: CD30 ligand; NK: Natural killer cells; DC: Dendritic cells; IFNγ: Interferon gamma; IL: Interleukin; TGFβ: Transforming growth factor beta; Foxp3: Forkhead box P3; RORgt: Retinoic acid-related orphan receptor gt.
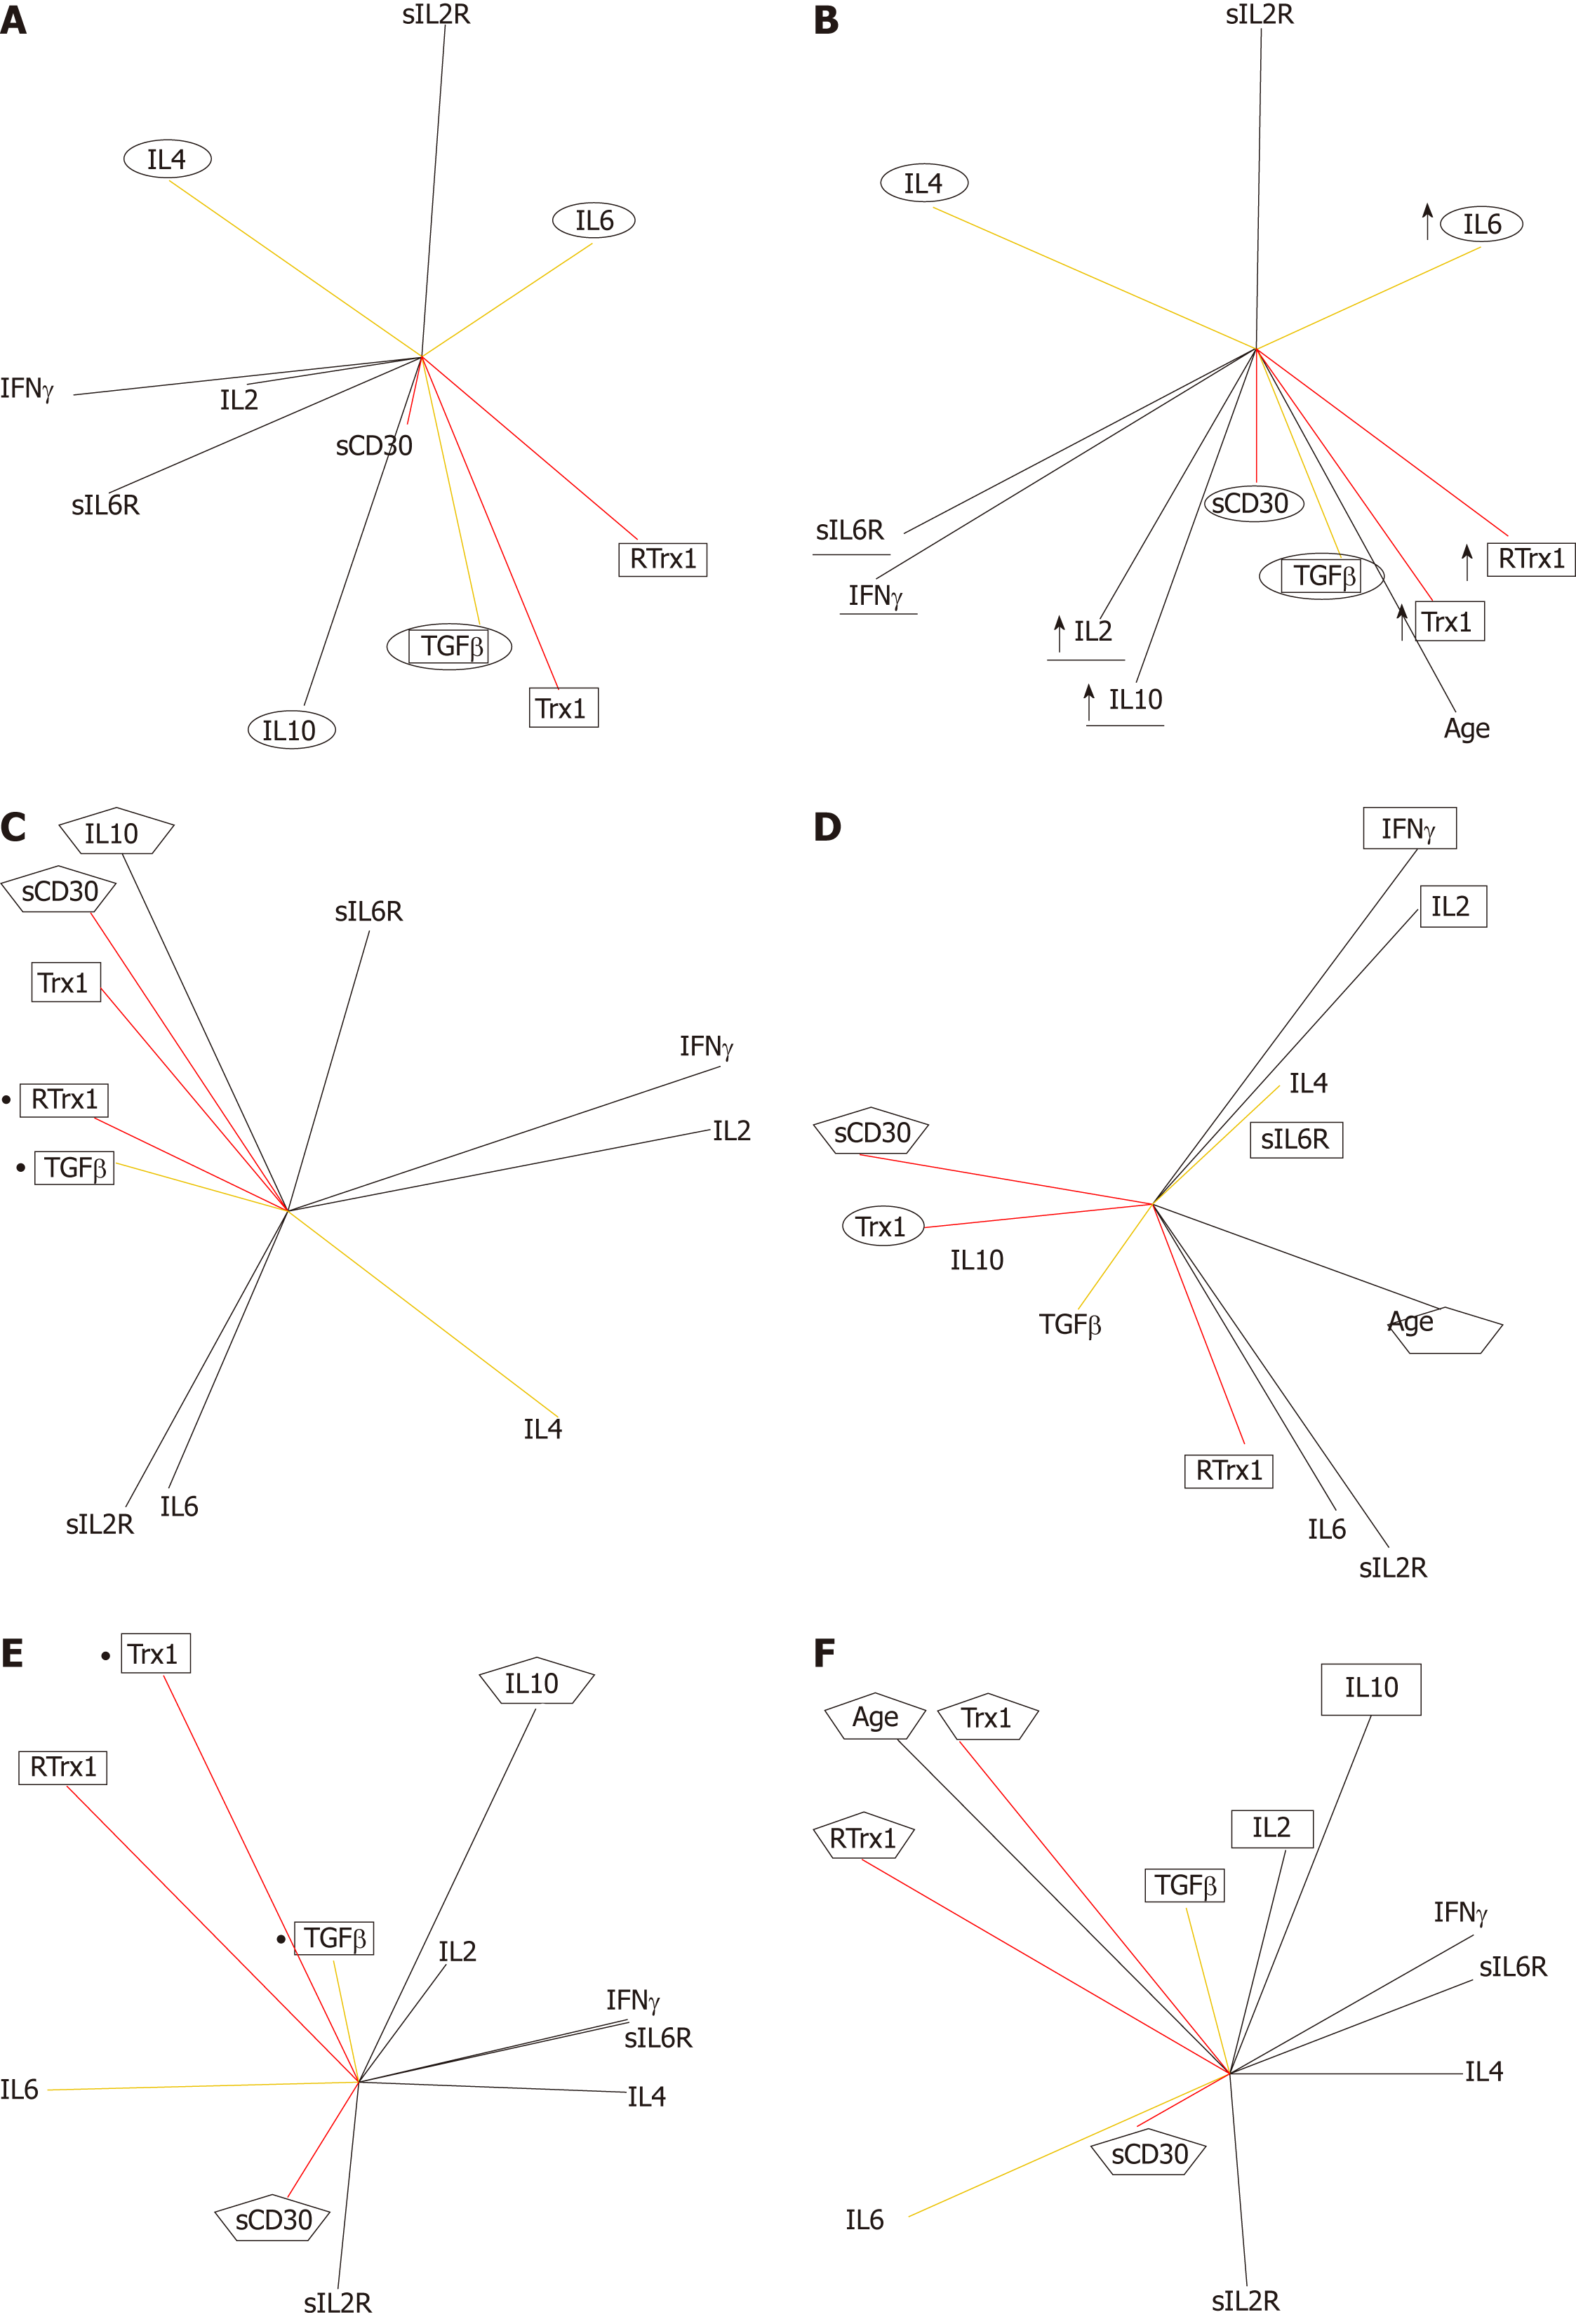
Figure 2 Trx1/CD30 preserves the healthy state by regulating the network of the redox-immune response.
A-F: Principal component analysis plots of the network of correlations between the levels of Trx1, RTrx1, sCD30 and immunological parameters of healthy subjects (with and without the age component), in all the groups (A, B) and male (C, D) and female (E, F) subgroups. Vector colors: The same color identifies a functional outline explained in the text. Parameter levels: Increase↑; Decrease↓. Pattern forms: The same form identifies a functional pattern as explained in the text.
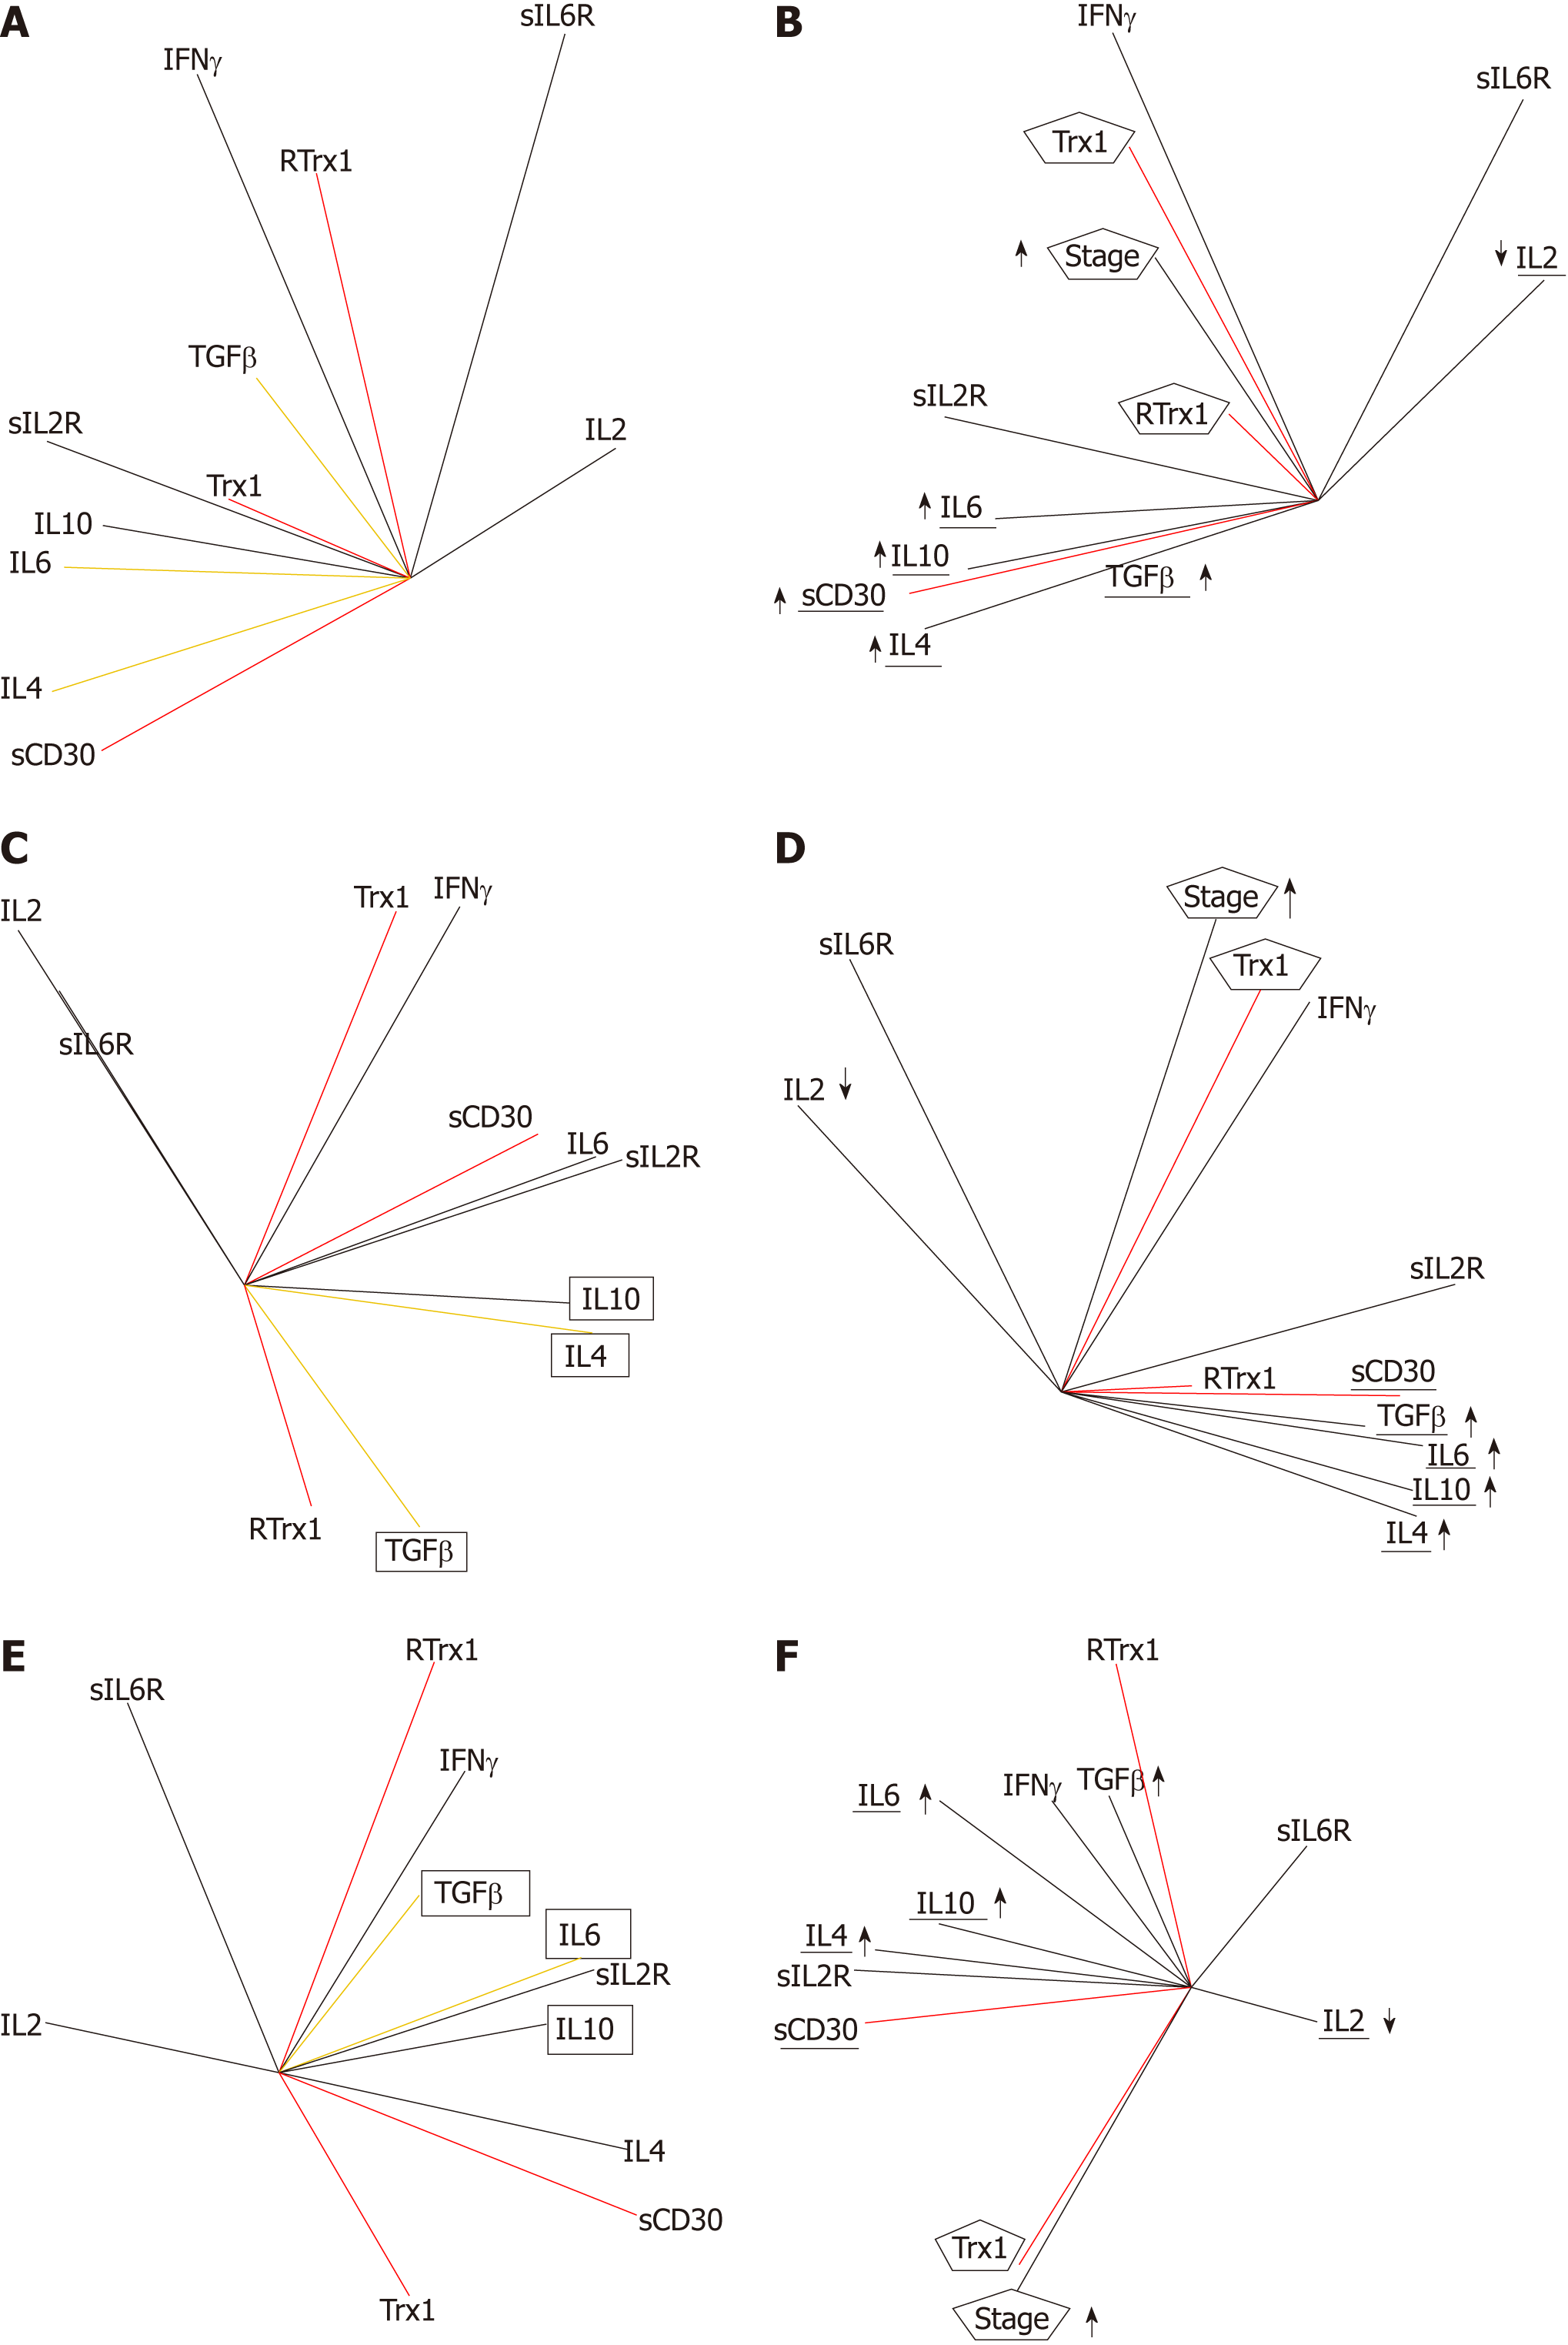
Figure 3 The unbalance of Trx1/CD3 is a gender-specific biomarker of the redox-immune regulation unbalance.
A-F: Principal component analysis plots of the network of correlations between the levels of Trx1, RTrx1, sCD30 and immunological parameters of tumor patients (with and without the disease progression component), in all the groups (A, B) and male (C, D) and female (E, F) subgroups. Vector colors: The same color identifies a functional outline explained in the text. Parameter levels: Increase↑; decrease↓. Pattern forms: The same form identifies a functional pattern as explained in the text.
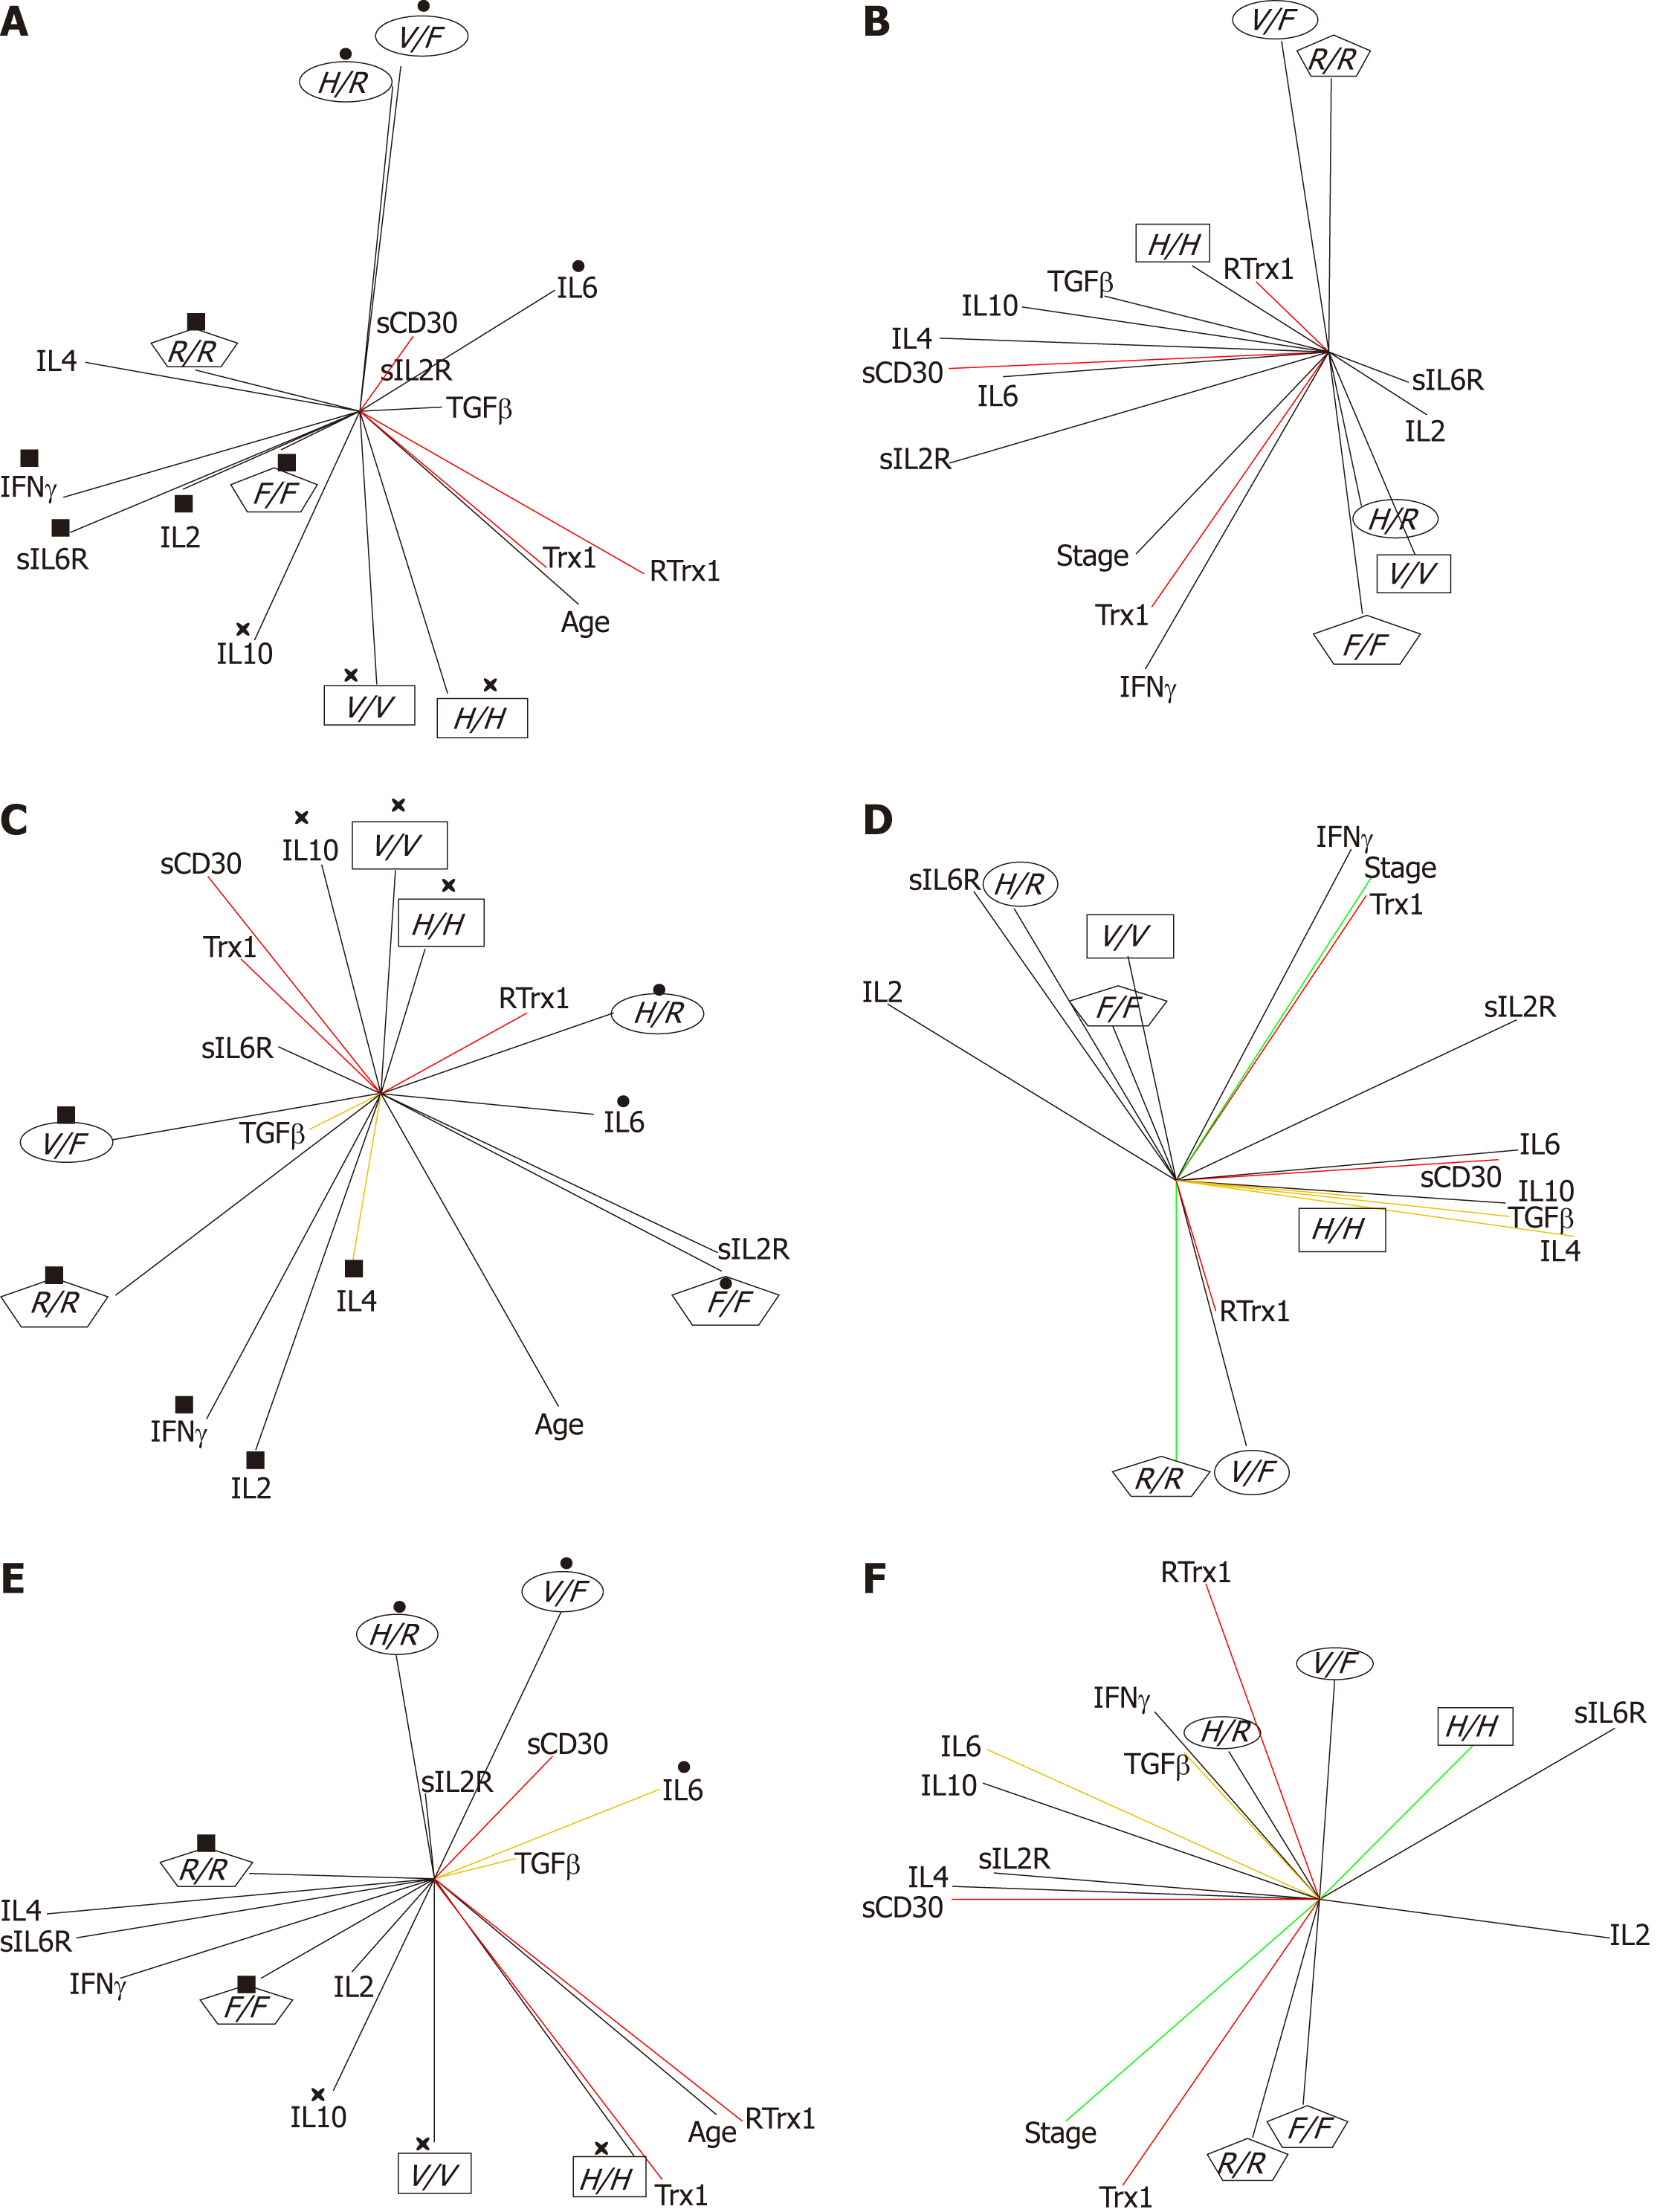
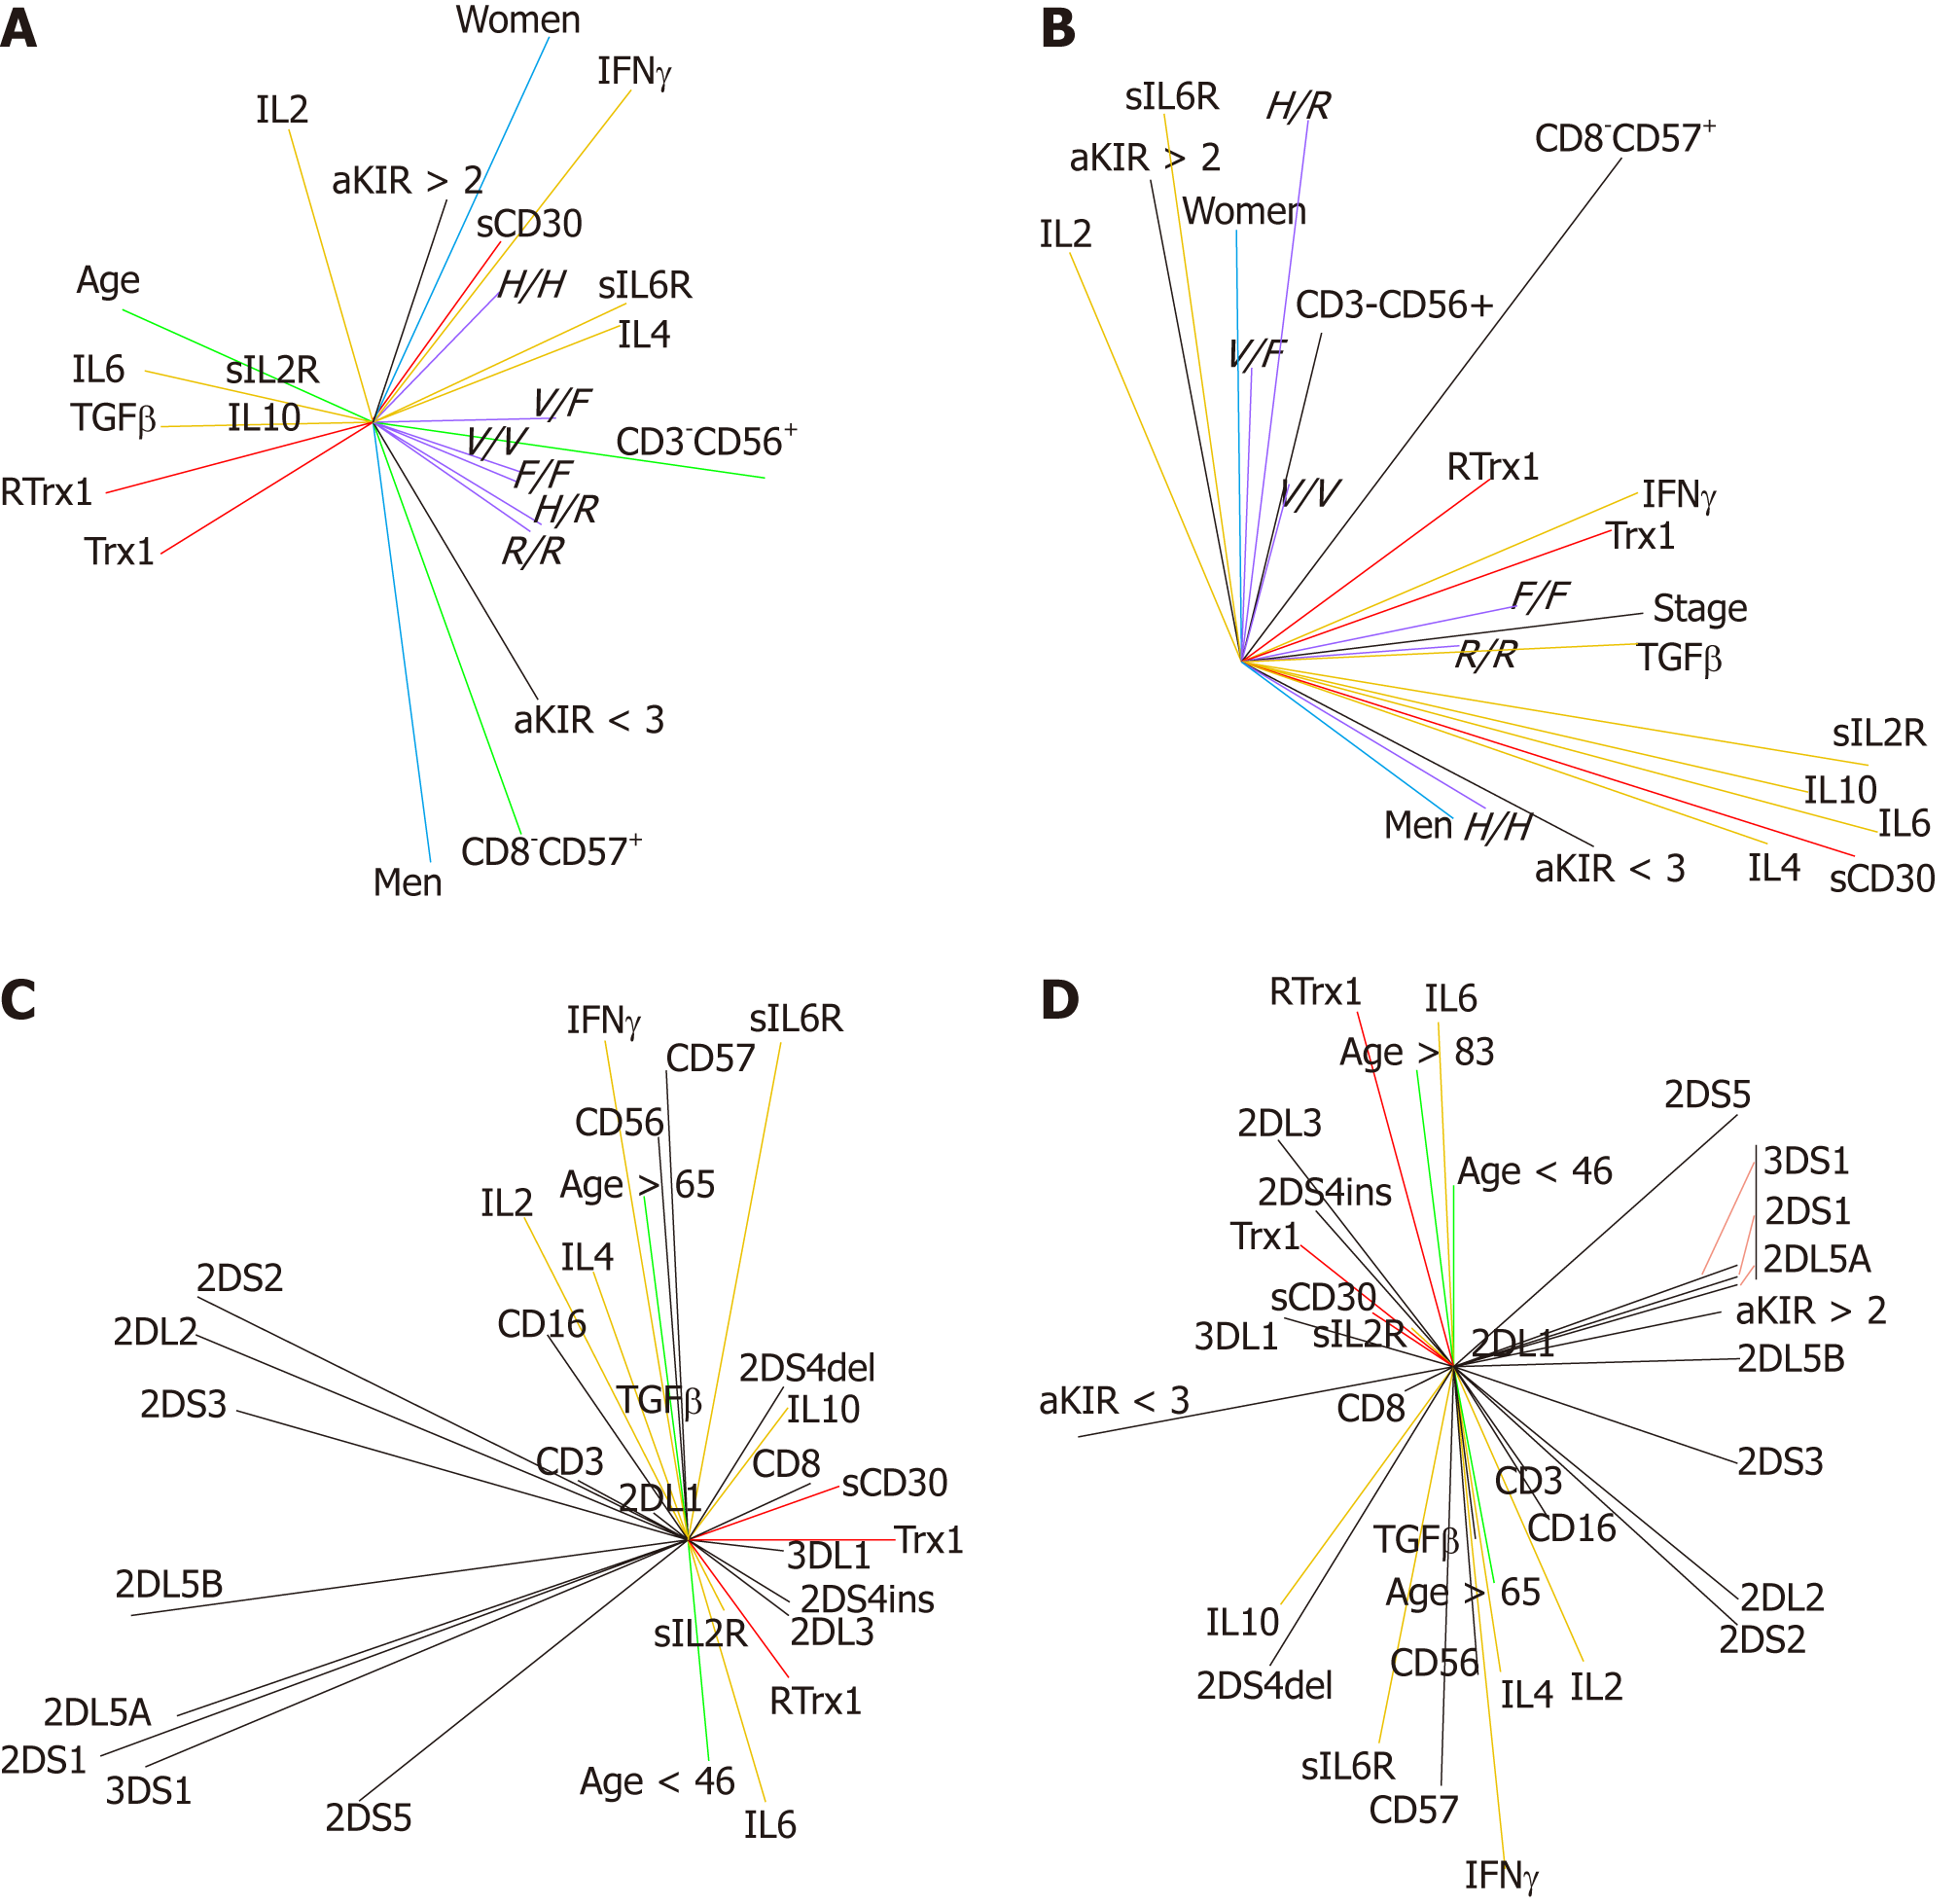
Figure 4 The polymorphisms of FcγRIIIa and FcγRIIa are useful biomarkers for the categorization of the risk for non-homeostasis of the redox-immune systems.
A-F: The different pathways in men and women could be prognostic of disease in healthy subjects (A, C, E) and of progression in patients (B, D, F). Principal component analysis plots of the network of correlations between the FcγRIIIa (V/V, V/F, F/F) and FcγRIIa (H/H, H/R, R/R) and the levels of Trx1, RTrx1, sCD30 and the immunological parameters (with and without the age and the disease progression components, respectively), in all the groups (A, B) and male (C, D) and female (E, F) subgroups. Vector colors: The same color identifies a functional outline explained in the text. Pattern forms: The same form identifies a functional pattern as explained in the text.
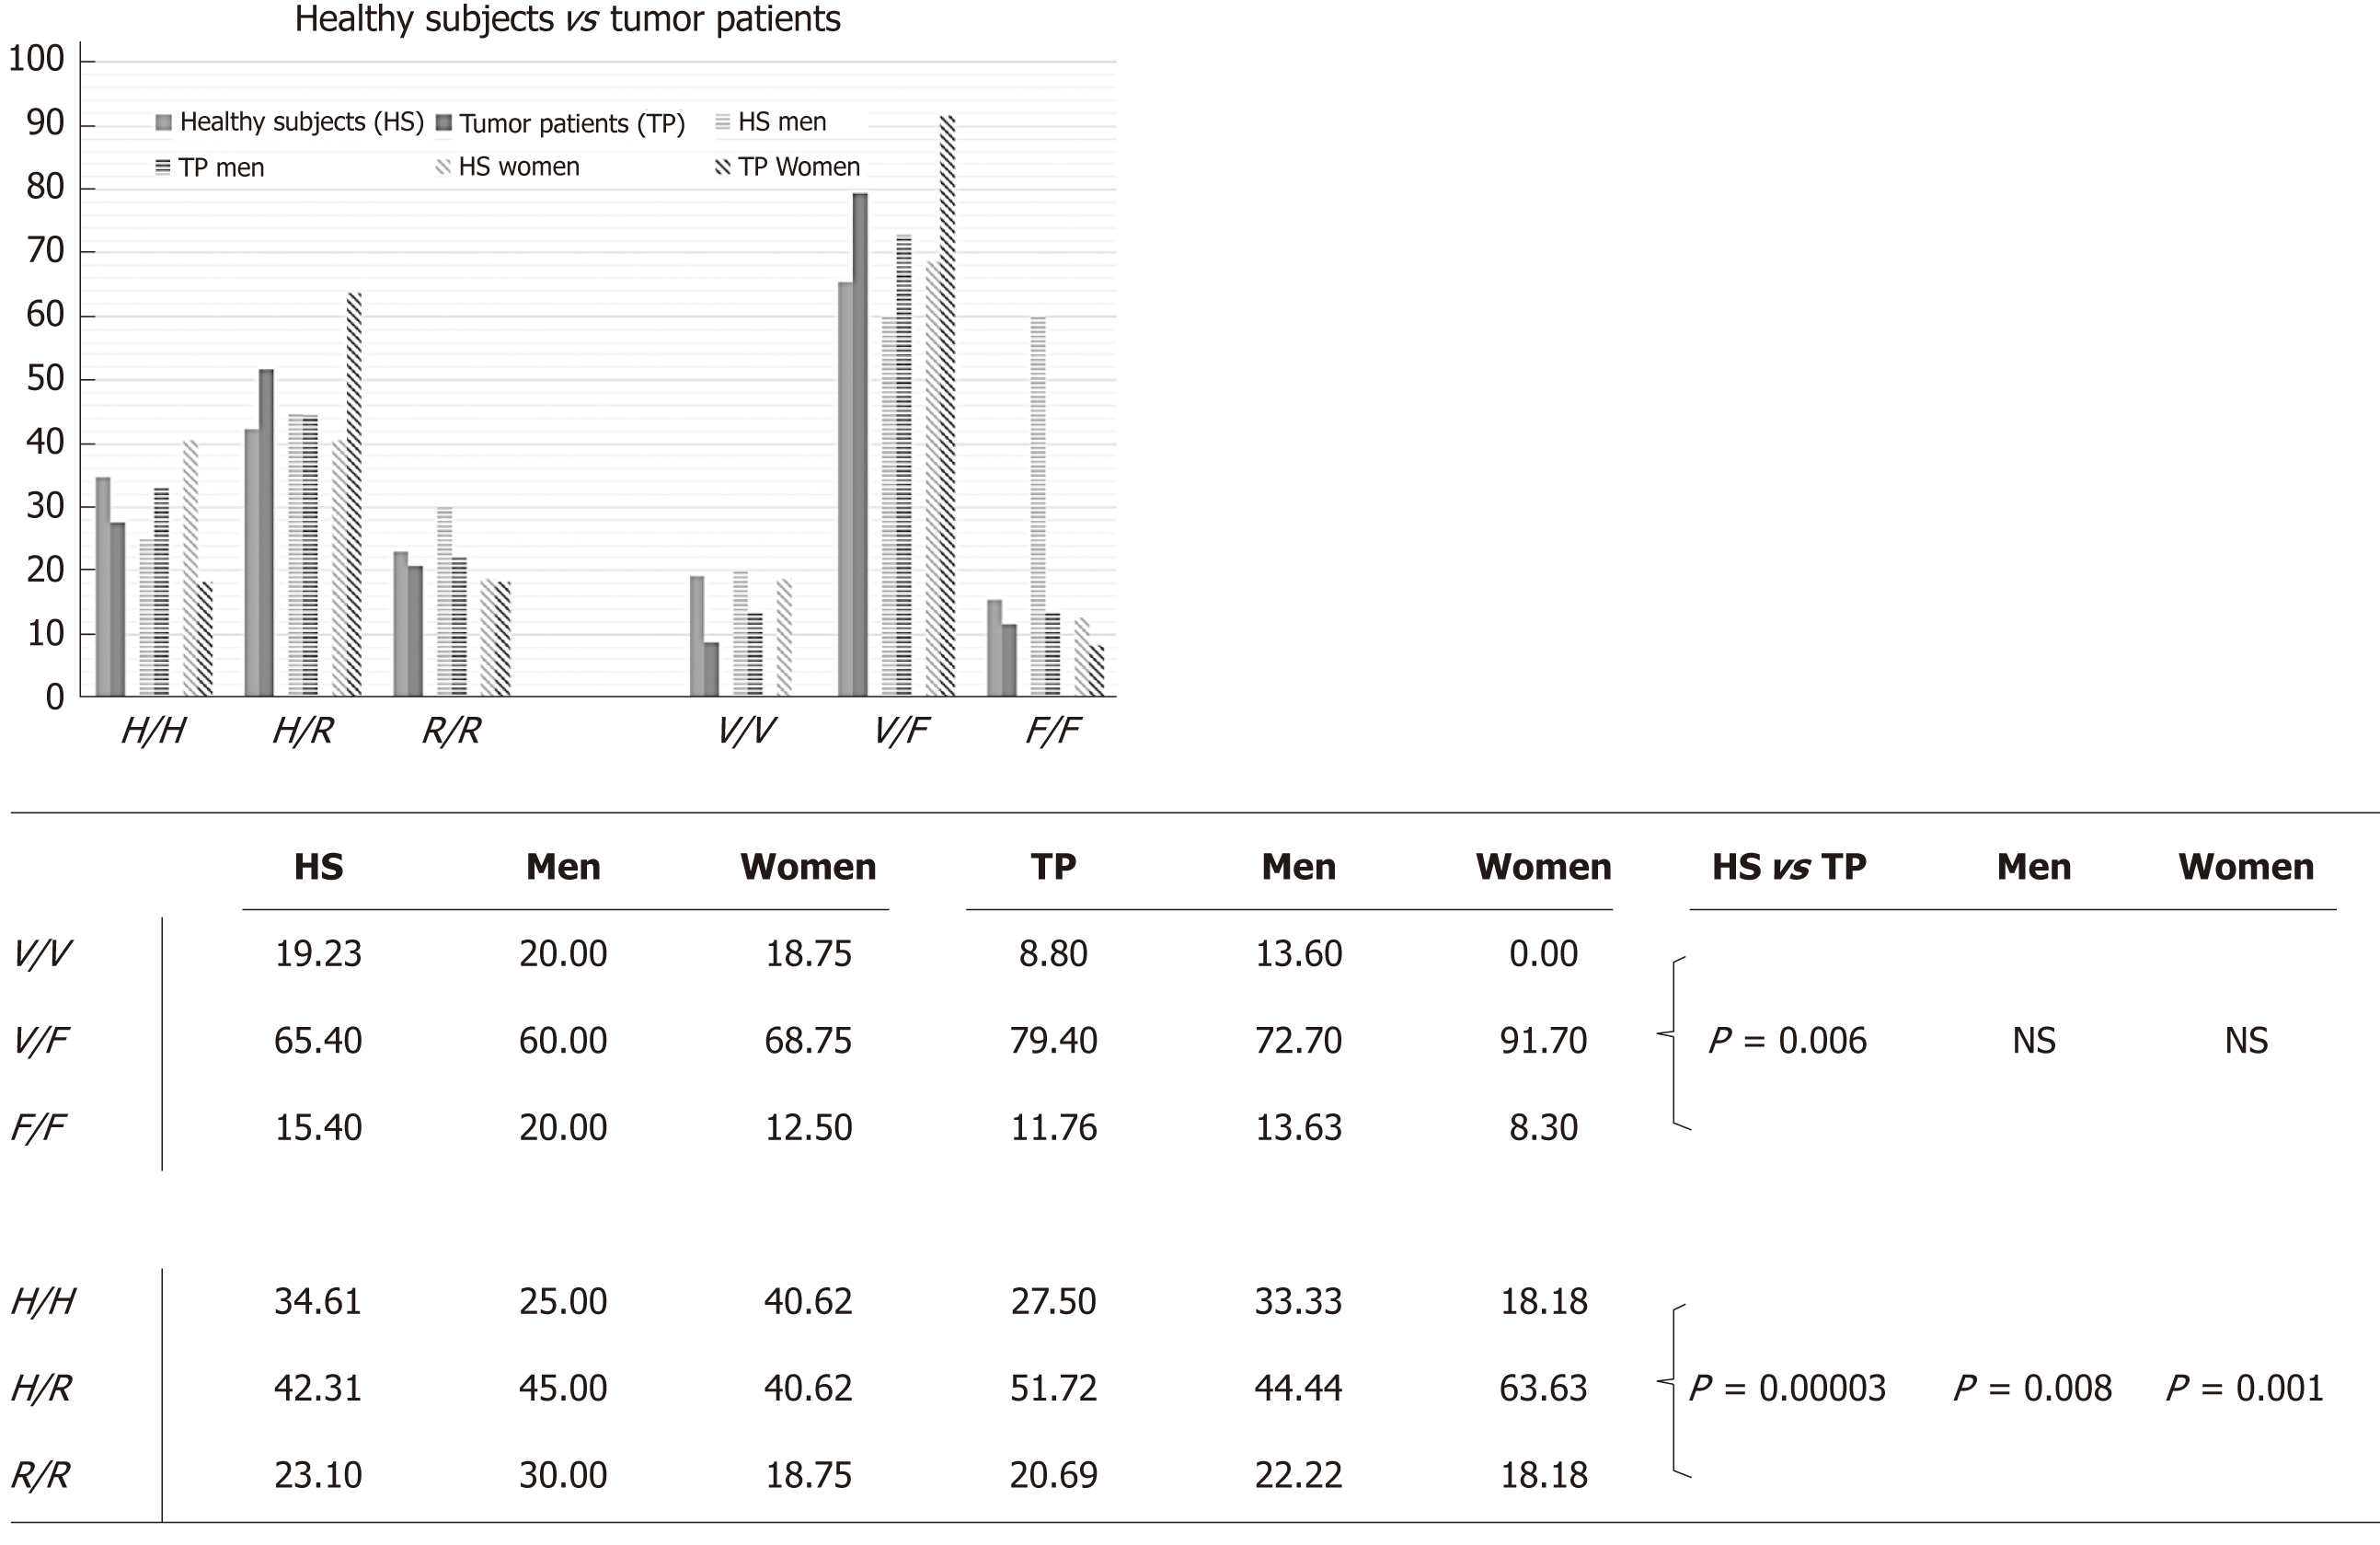
Figure 5 FcγRIIa and FcγRIIIa polymorphism frequencies in healthy subjects and tumor patients.
Values are expressed as percentages. The statistical data were obtained by using goodness-of-fit statistic. Values of P < 0.05 were considered significant. NS: Not significant; HS: Healthy subject; TP: Tumor patients.
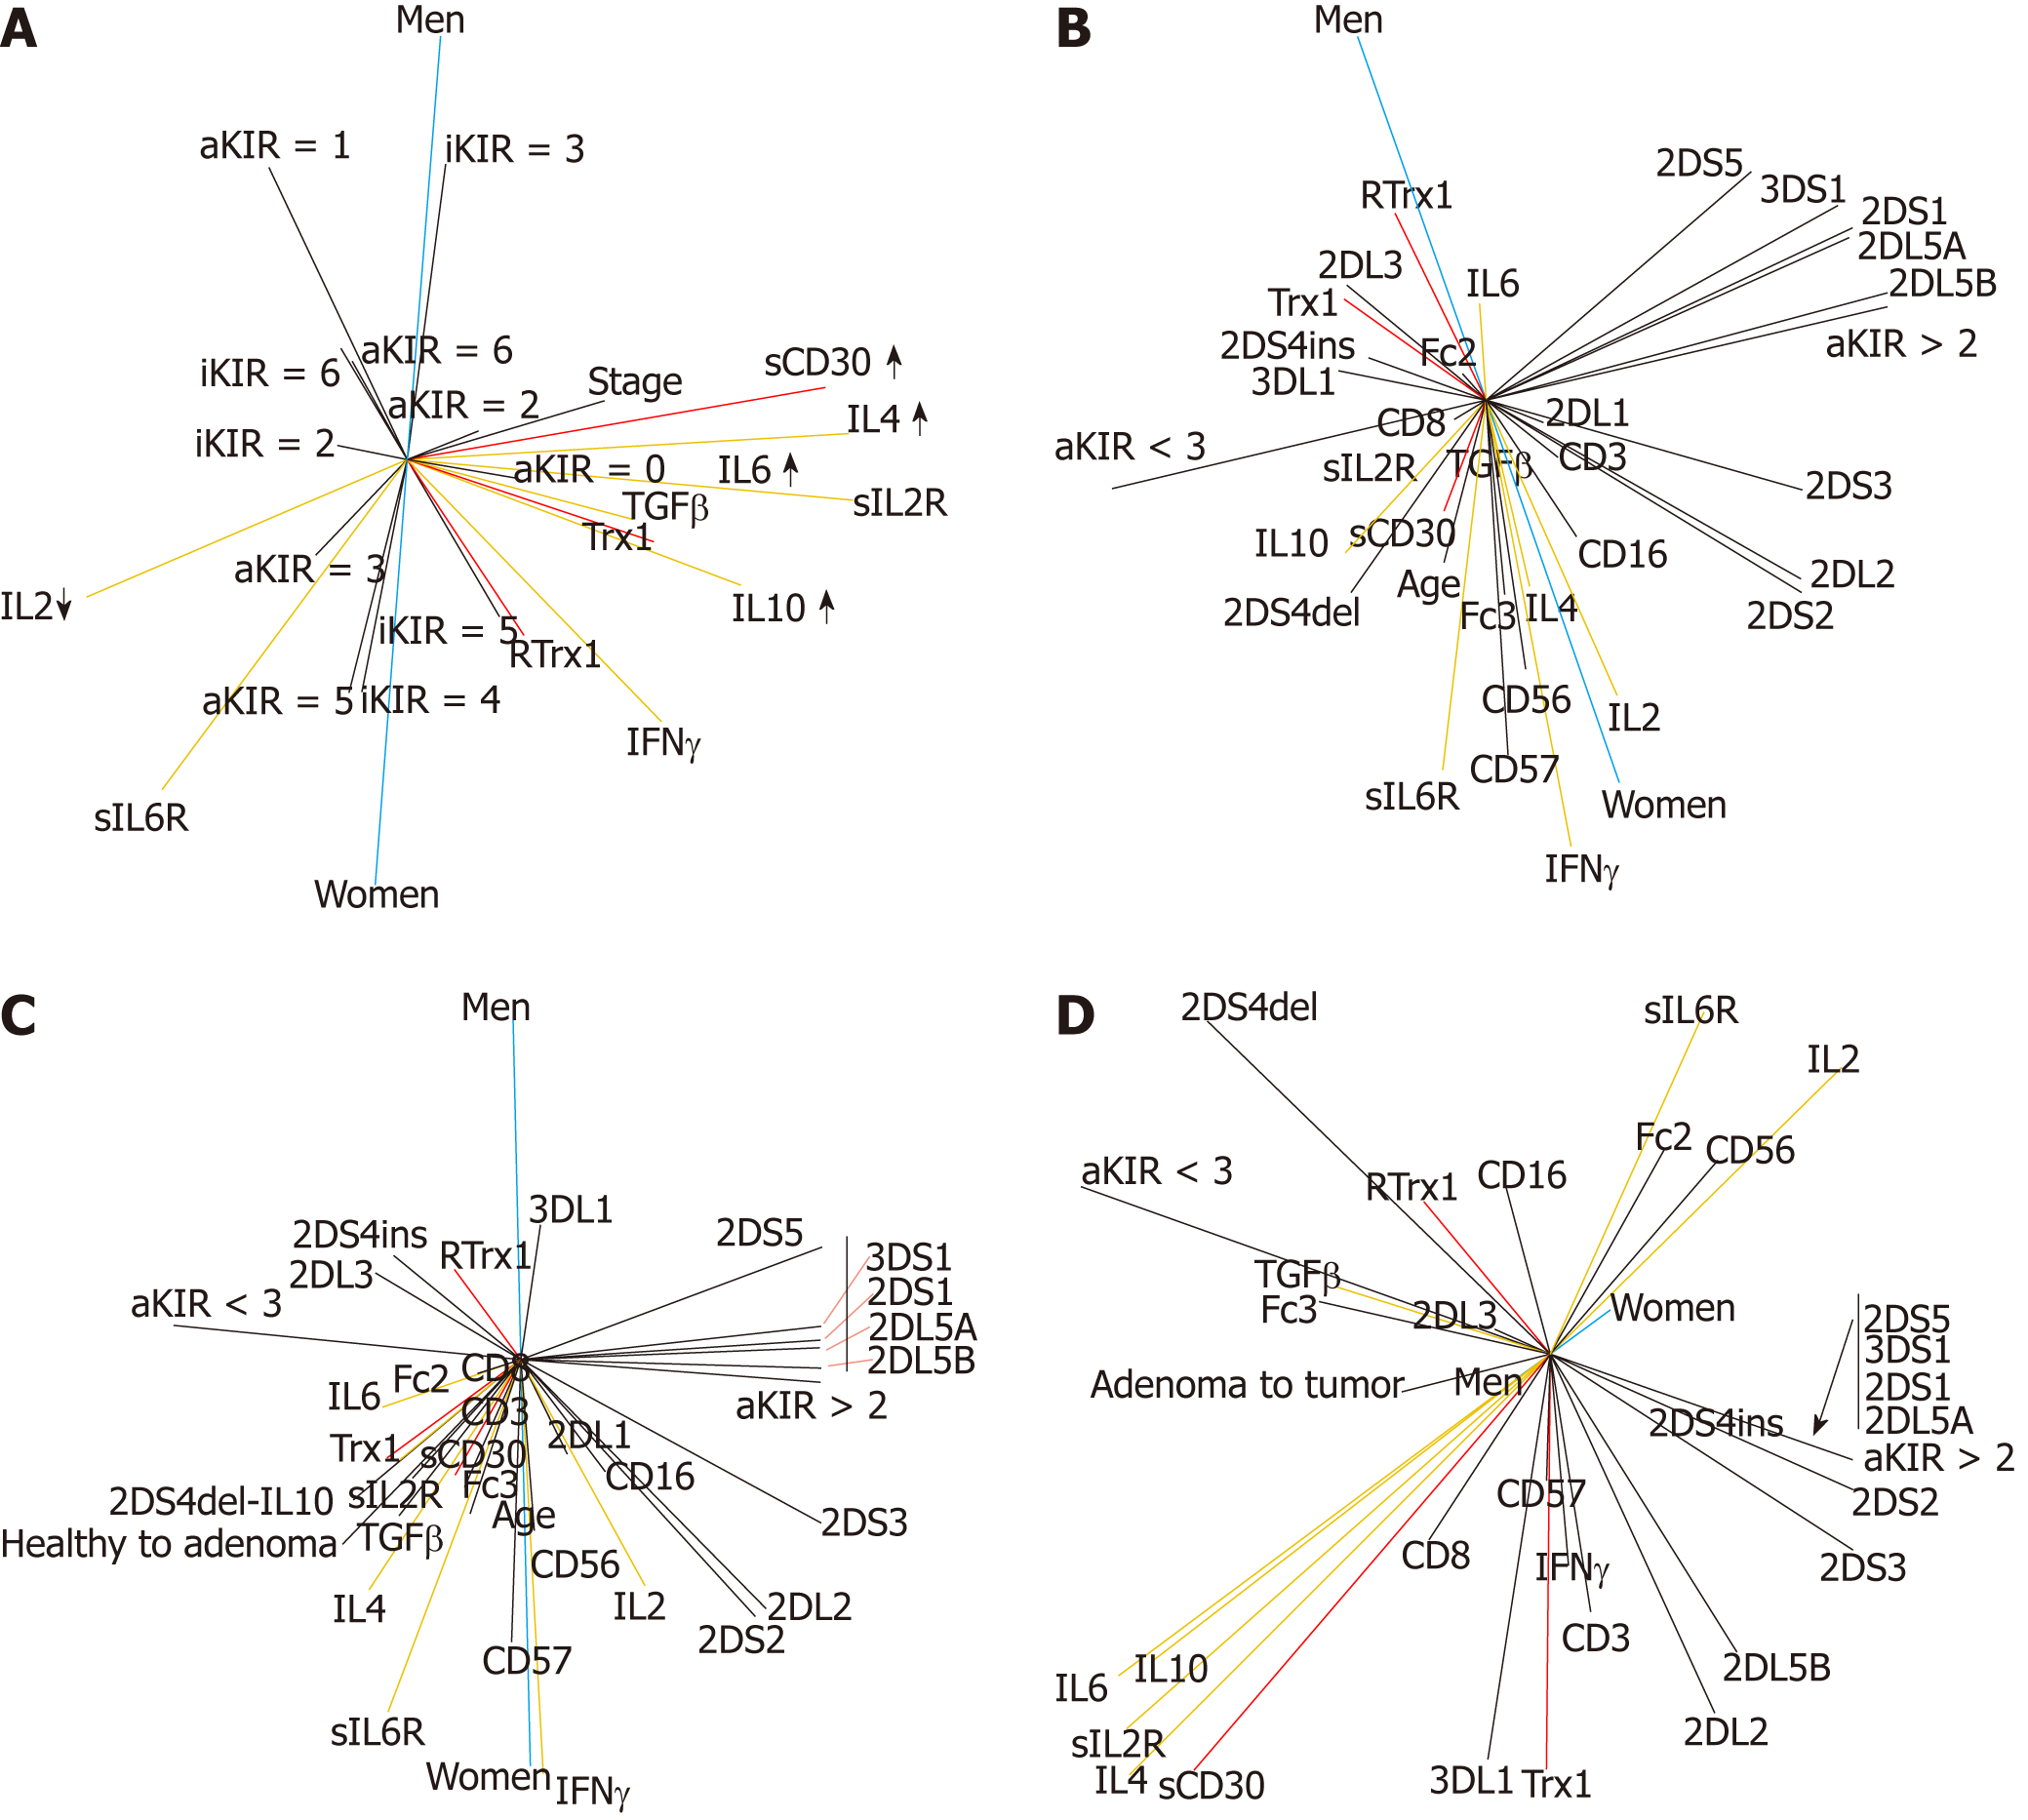
Figure 6 The polymorphisms of KIRs are useful biomarkers for categorizing the risk of non-homeostasis of the redox-immune systems.
The different pathways in men and women could be prognostic of disease in healthy subjects and of progression in patients. Principal component analysis plots of the network of correlations between aKIR, iKIR polymorphisms and the levels of Trx1, RTrx1, sCD30 and immunological parameters (with and without the age and the disease progression components, respectively). A: The network of the correlations between the different numbers of aKIRs and iKIRs of the patient group and the disease stage. The “Akir > 2” and “aKIR < 3” parameters are the limits of non-risk and risk of disease, respectively, and we used them as elements of stratification for the evaluation of the parameter relevance as prognostic biomarkers; B: Disease risk in healthy subjects; C: Healthy to Adenoma state disease progression (Healthy to Adenoma), in the group made up of healthy and adenoma subjects; D: Adenoma to Tumor state disease progression (Adenoma to Tumor), in the group made up of adenoma subjects and patients. Vector colors: The same color identifies a functional outline explained in the text. Parameter levels: Increase↑; decrease↓.
Figure 7 The unbalance of Trx1/CD3 is a biomarker of inactive natural killer cells.
A, B: Interactions between the levels of Trx1, RTrx1, sCD30 and immunological parameters with the CD3-CD56+ and CD8-CD57+ phenotypic markers, together with the age and the stage, in healthy subjects (A) and in patients (B), respectively. The chance of a healthy longevity for the elderly group is primarily determined by the homeostasis of the immune system redox regulation, in particular of sCD30, Trx1 and RTrx1; C: The most significant correlation of the subjects in the youngest class (“< 46”) is with the homeostasis of the redox immune response; D: The probability of a healthy longevity for the elderly group is primarily determined by the homeostasis of the immune system redox regulation, also when there are increased levels of IL6 [“> 89” and “< 46” vectors are closely related to each other and also with the RTrx1, Trx1 and sCD30 vectors (D)]. Vector colors: The same color identifies a functional outline explained in the text.
- Citation: Berghella AM, Aureli A, Canossi A, Beato TD, Colanardi A, Pellegrini P. Redox, immune and genetic biomarker system for personalized treatments in colorectal cancer. World J Gastrointest Oncol 2019; 11(2): 117-138
- URL: https://www.wjgnet.com/1948-5204/full/v11/i2/117.htm
- DOI: https://dx.doi.org/10.4251/wjgo.v11.i2.117


