Copyright
©The Author(s) 2019.
World J Gastrointest Oncol. Nov 15, 2019; 11(11): 1043-1053
Published online Nov 15, 2019. doi: 10.4251/wjgo.v11.i11.1043
Published online Nov 15, 2019. doi: 10.4251/wjgo.v11.i11.1043
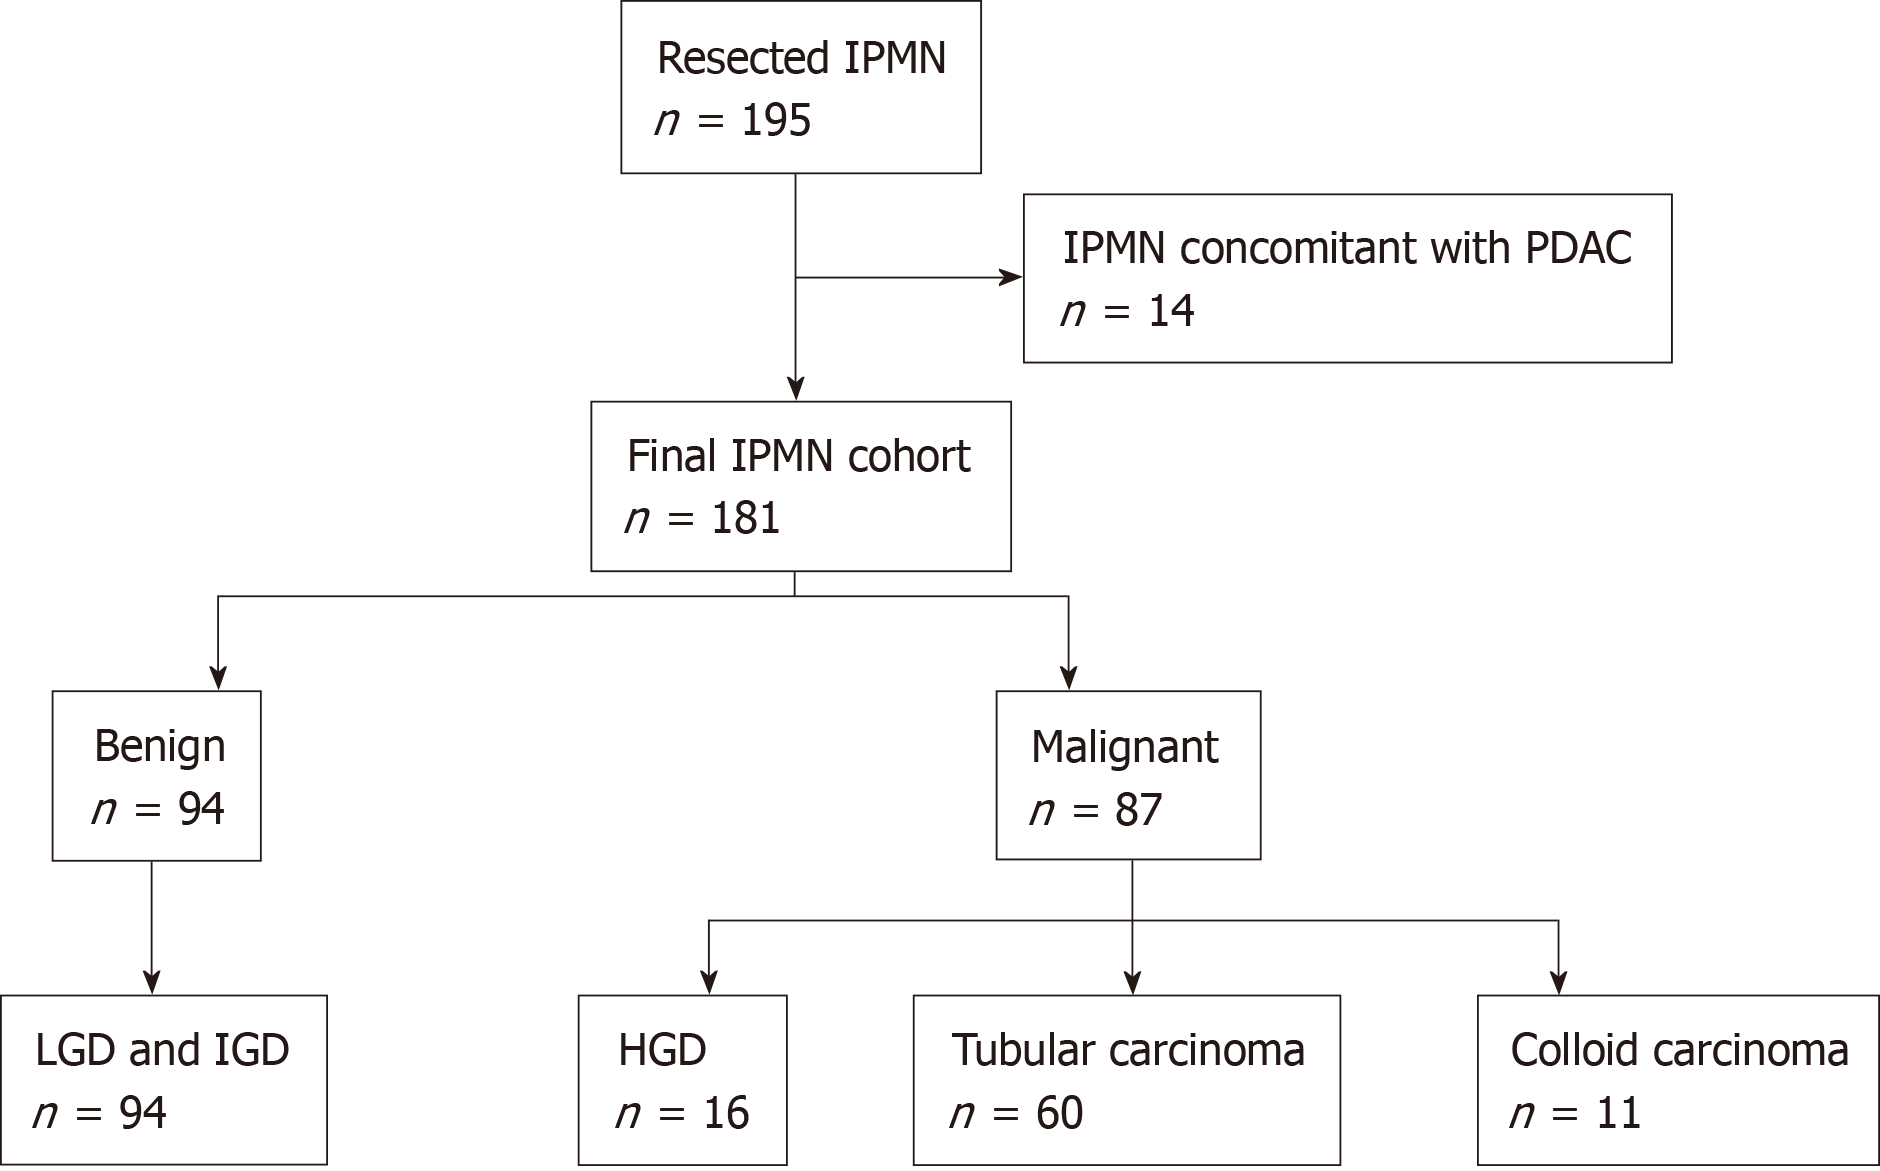
Figure 1 Study cohort.
HGD: High-grade dysplasia; IGD: Intermediate-grade dysplasia; IPMN: Intraductal papillary mucinous neoplasm; LGD: Low-grade dysplasia; PDAC: Pancreatic ductal adenocarcinoma.
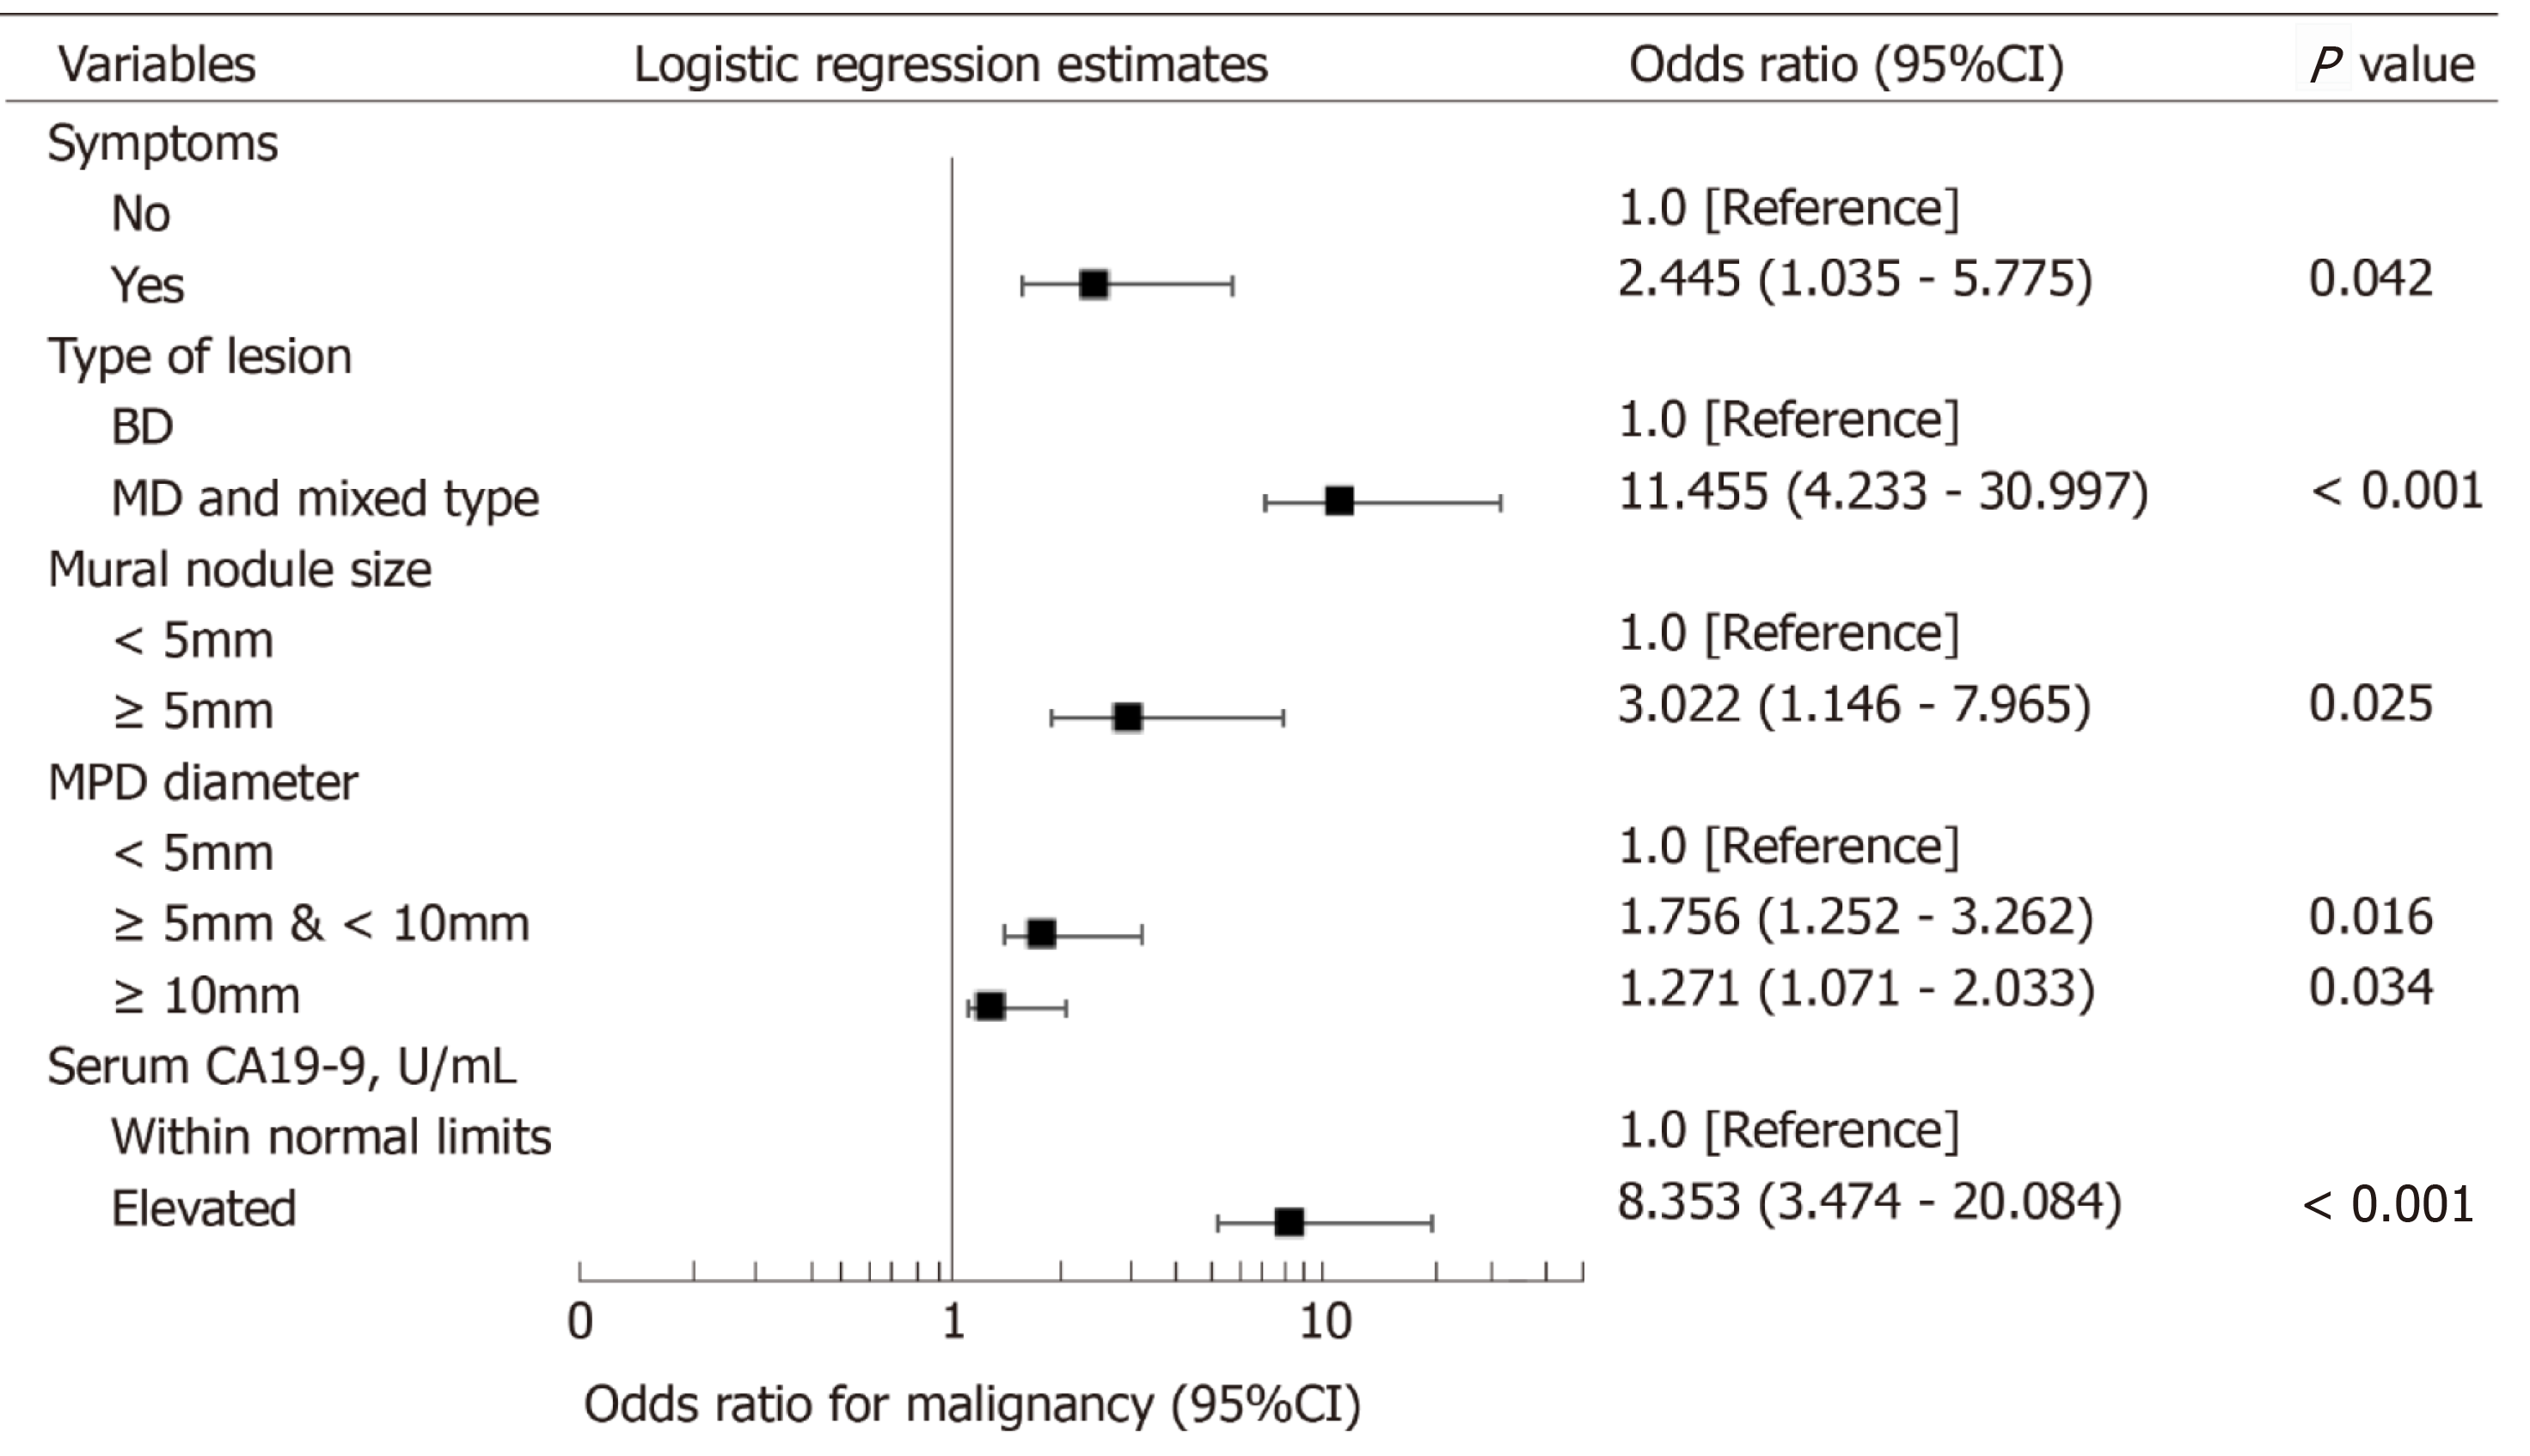
Figure 2 Associations between five risk factors and malignant intraductal papillary mucinous neoplasm in multivariate logistic regression analysis.
BD: Branch duct; CA: Carbohydrate antigen; CI: Confidence interval; MD: Main duct; MPD: Main pancreatic duct.
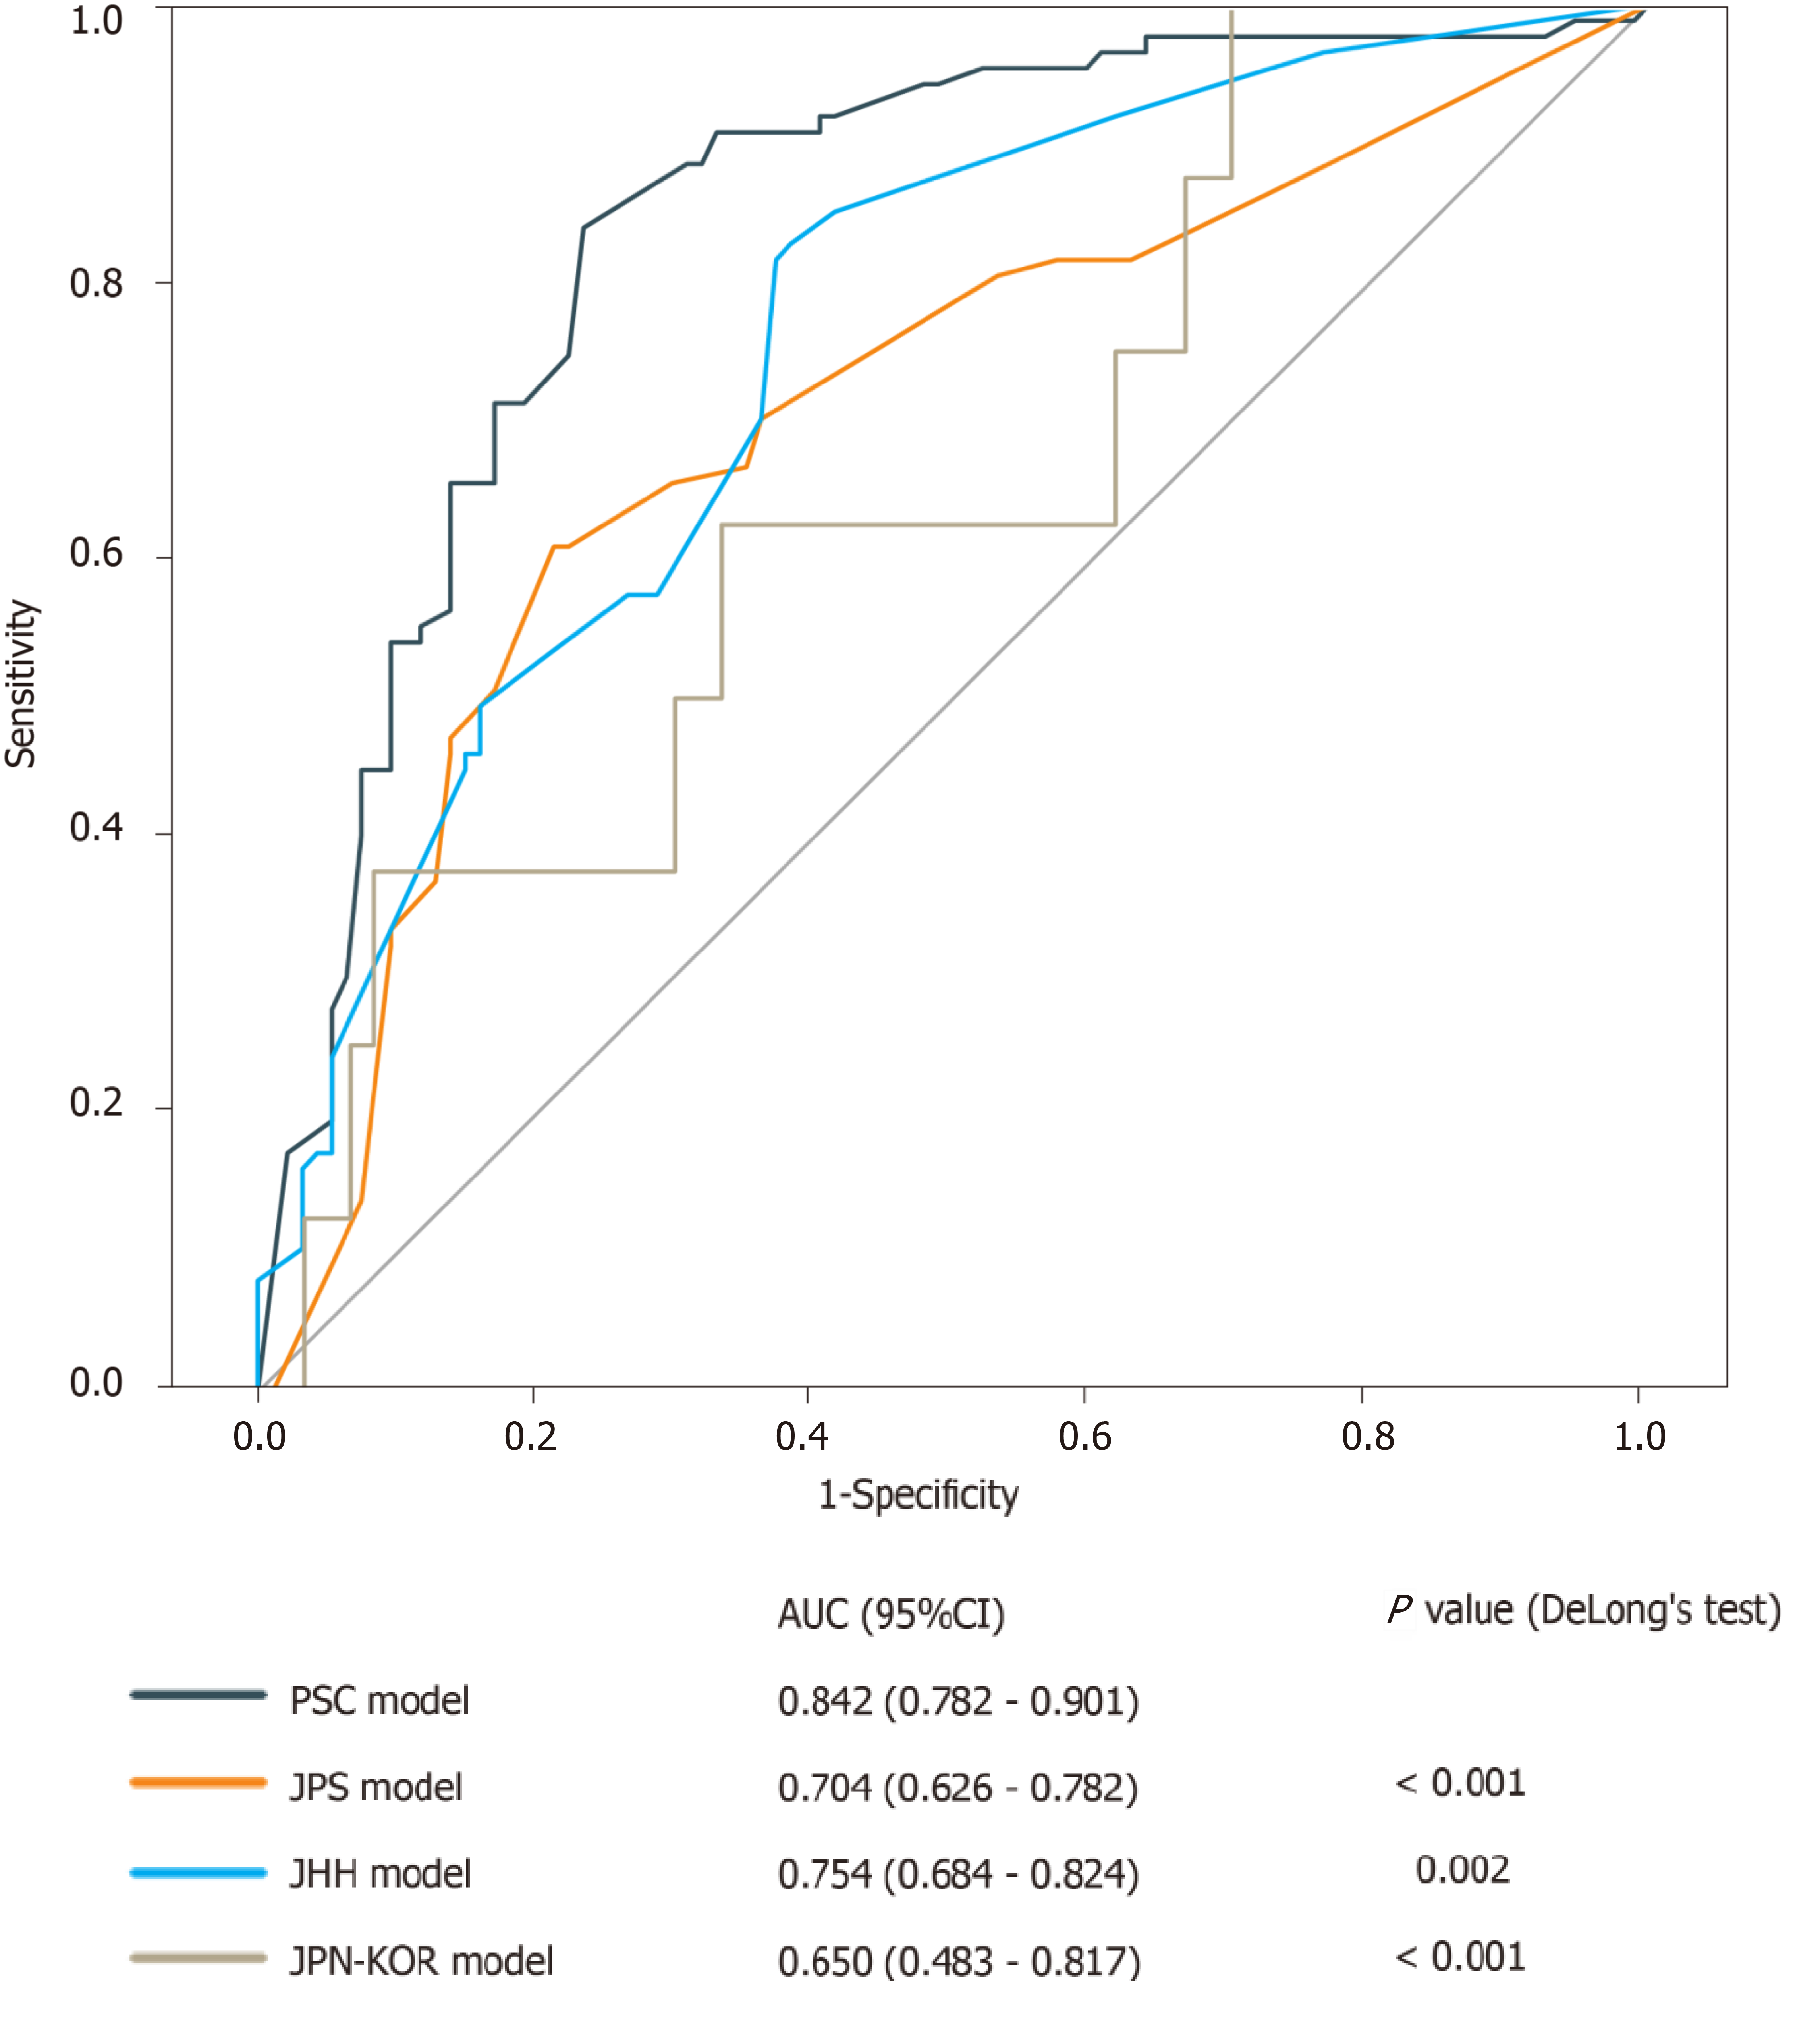
Figure 3 Comparison of the four models using receiver operating characteristic curves.
AUC: Area under the curve; CI: Confidence interval; JHH: Johns Hopkins Hospital; JPN-KOR: Japan-Korea; JPS: Japan Pancreas Society; PSC: Pancreatic Surgery Consortium.
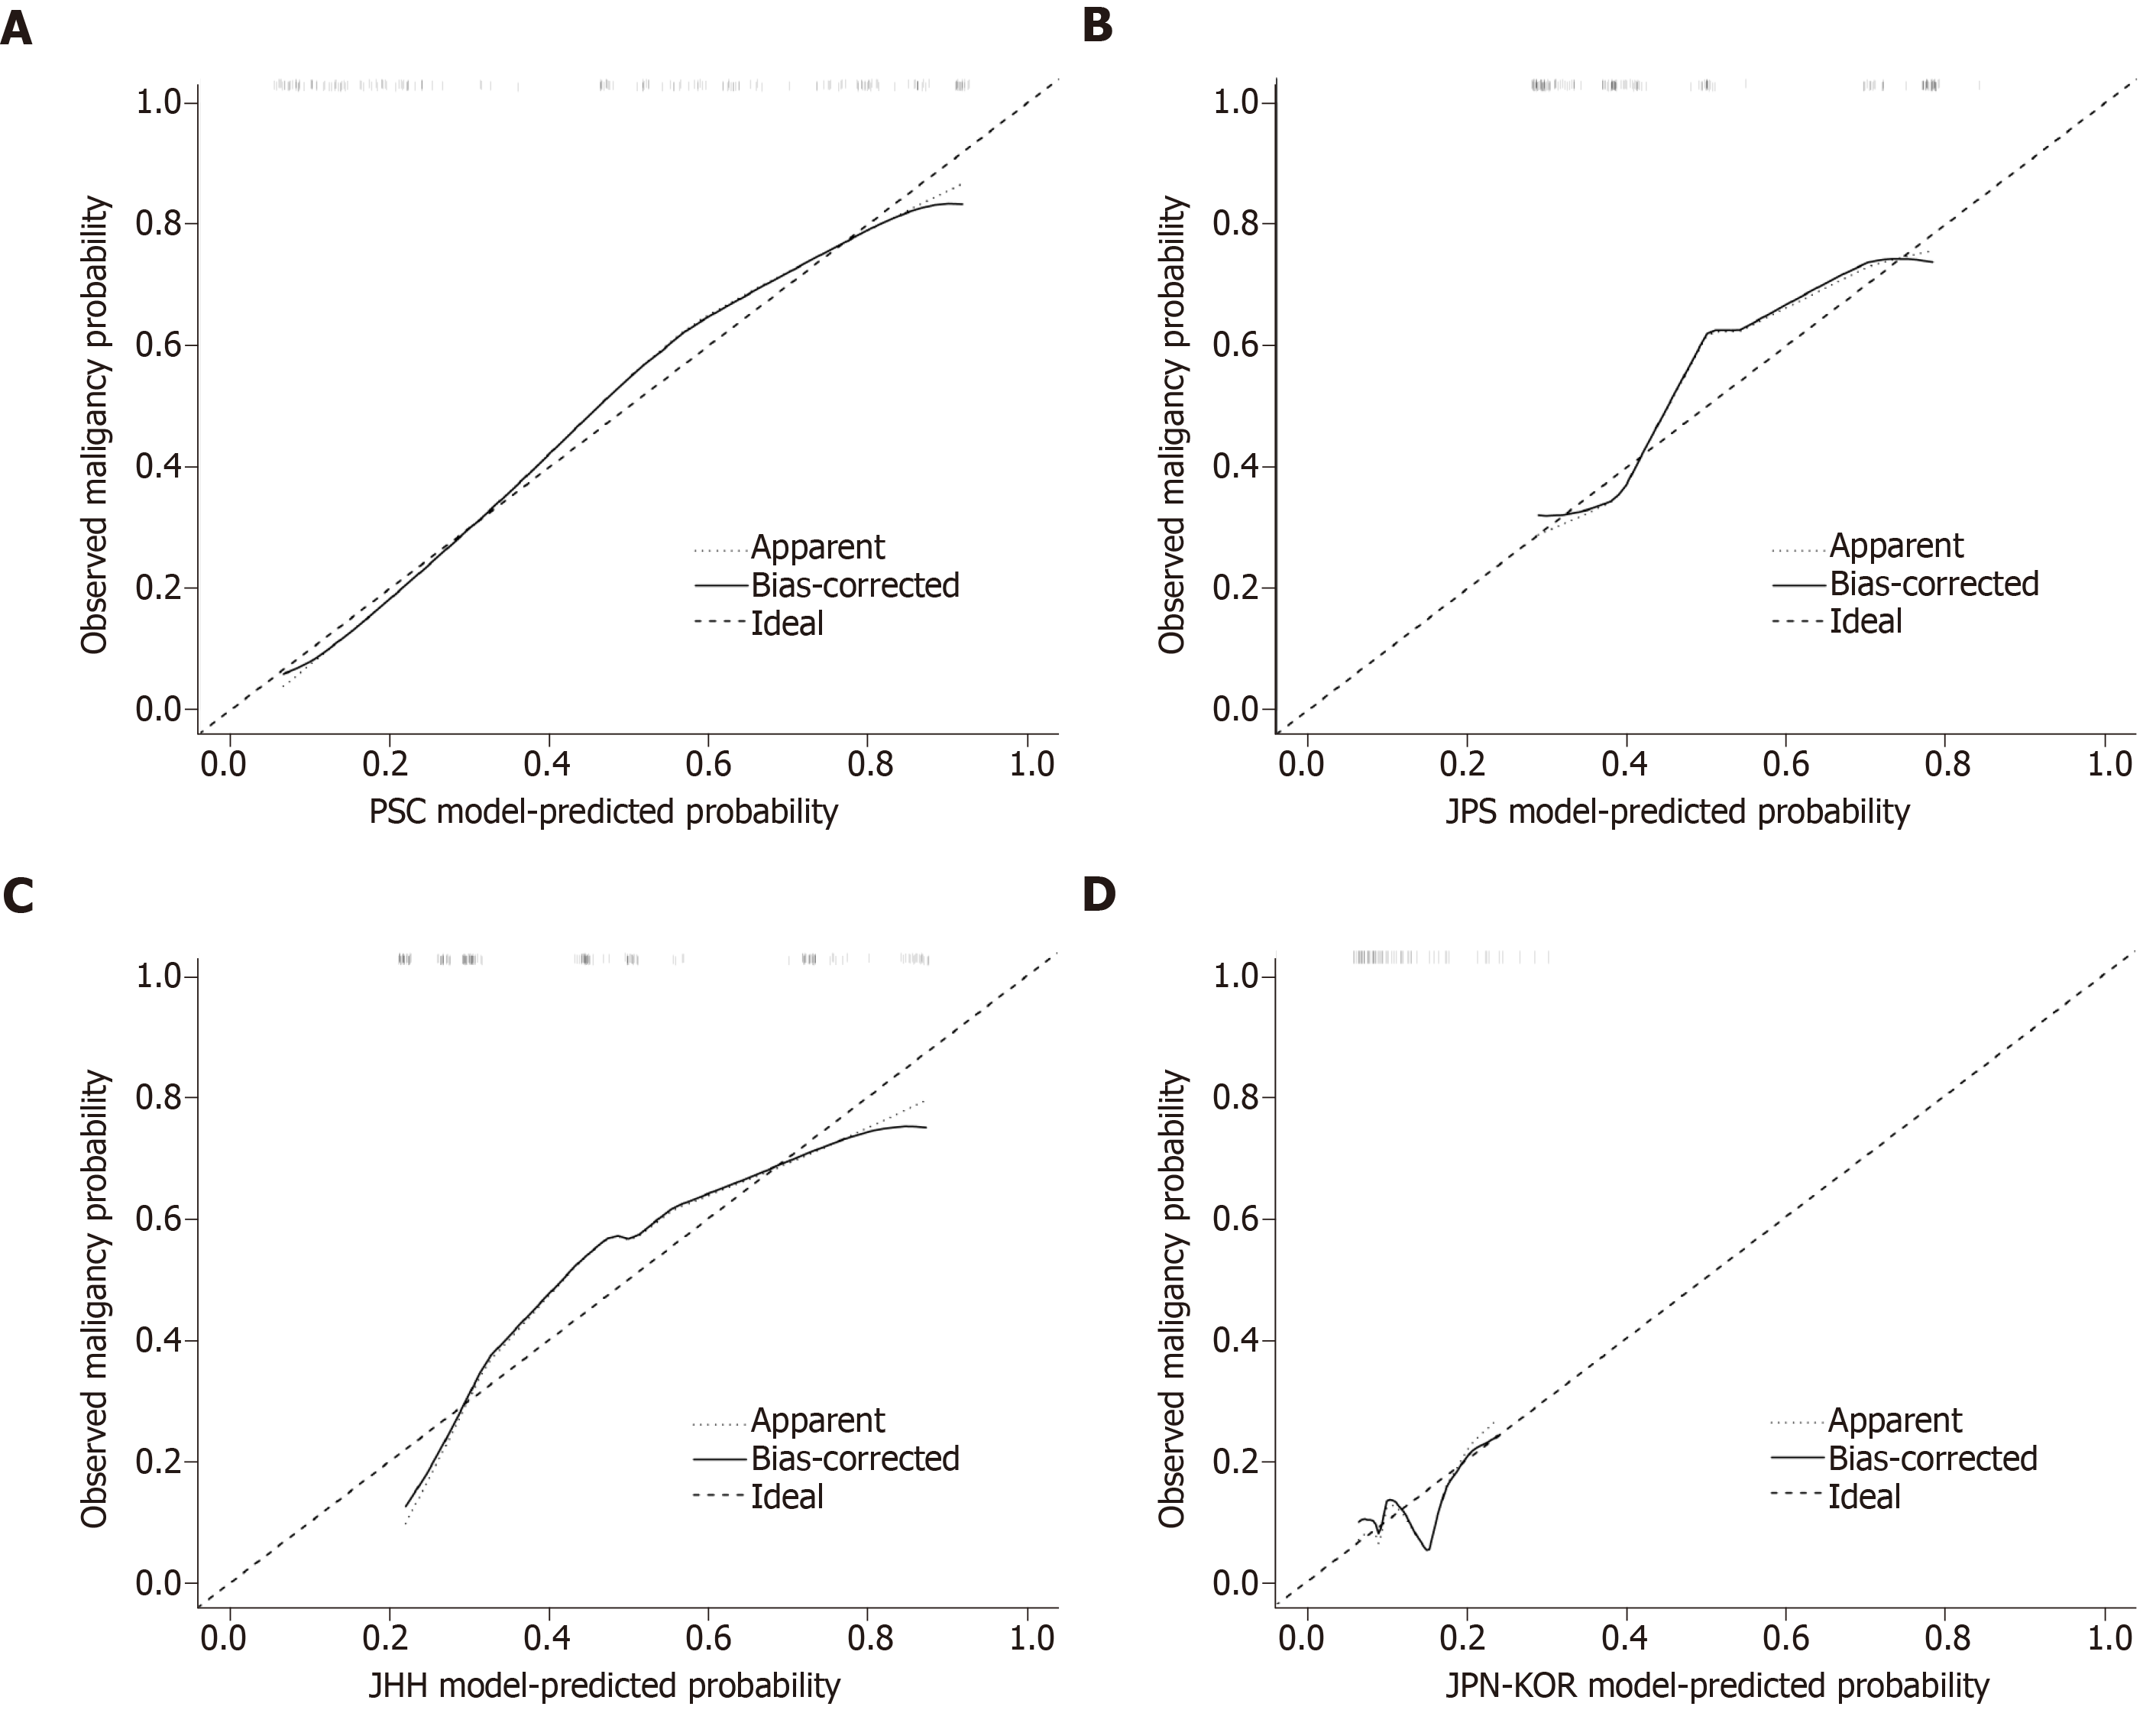
Figure 4 Calibration plots of the observed vs predicted probability of malignancy in patients with intraductal papillary mucinous neoplasm.
A: The PSC model; B: The JPS model; C: The JHH model; D: The JPN-KOR model. JHH: Johns Hopkins Hospital; JPN-KOR: Japan-Korea; JPS: Japan Pancreas Society; PSC: Pancreatic Surgery Consortium.
- Citation: Hua J, Zhang B, Yang XJ, Zhang YY, Wei MY, Liang C, Meng QC, Liu J, Yu XJ, Xu J, Shi S. Validation and head-to-head comparison of four models for predicting malignancy of intraductal papillary mucinous neoplasm of the pancreas: A study based on endoscopic ultrasound findings. World J Gastrointest Oncol 2019; 11(11): 1043-1053
- URL: https://www.wjgnet.com/1948-5204/full/v11/i11/1043.htm
- DOI: https://dx.doi.org/10.4251/wjgo.v11.i11.1043


