Copyright
©The Author(s) 2018.
World J Gastrointest Oncol. Dec 15, 2018; 10(12): 476-486
Published online Dec 15, 2018. doi: 10.4251/wjgo.v10.i12.476
Published online Dec 15, 2018. doi: 10.4251/wjgo.v10.i12.476
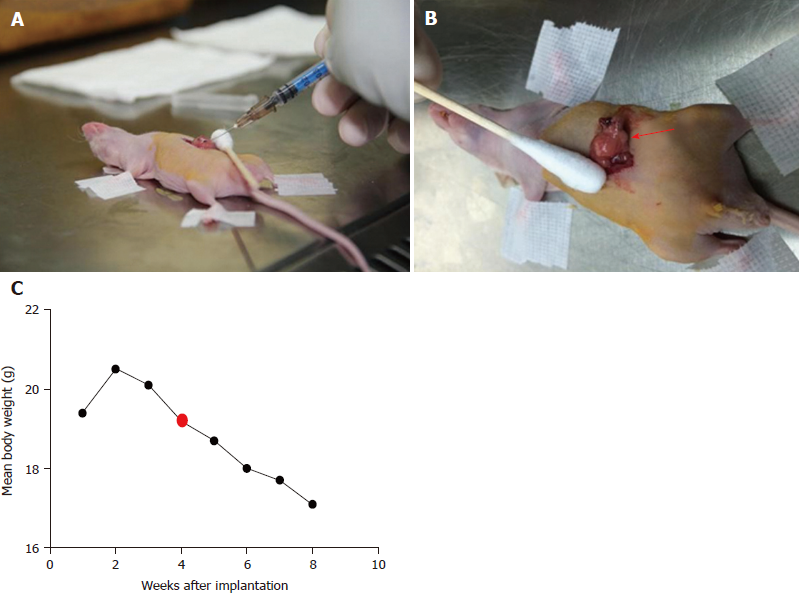
Figure 1 An orthotopic nude mouse with pancreatic cancer generated with human pancreatic cancer cells 1.
A: The administered cells generated a bubble on the pancreatic surface; B: The median tumor area at the time of ablation approximated 1 cm2; C: Changes in body weights of tumor-bearing mice at different times after transplantation.
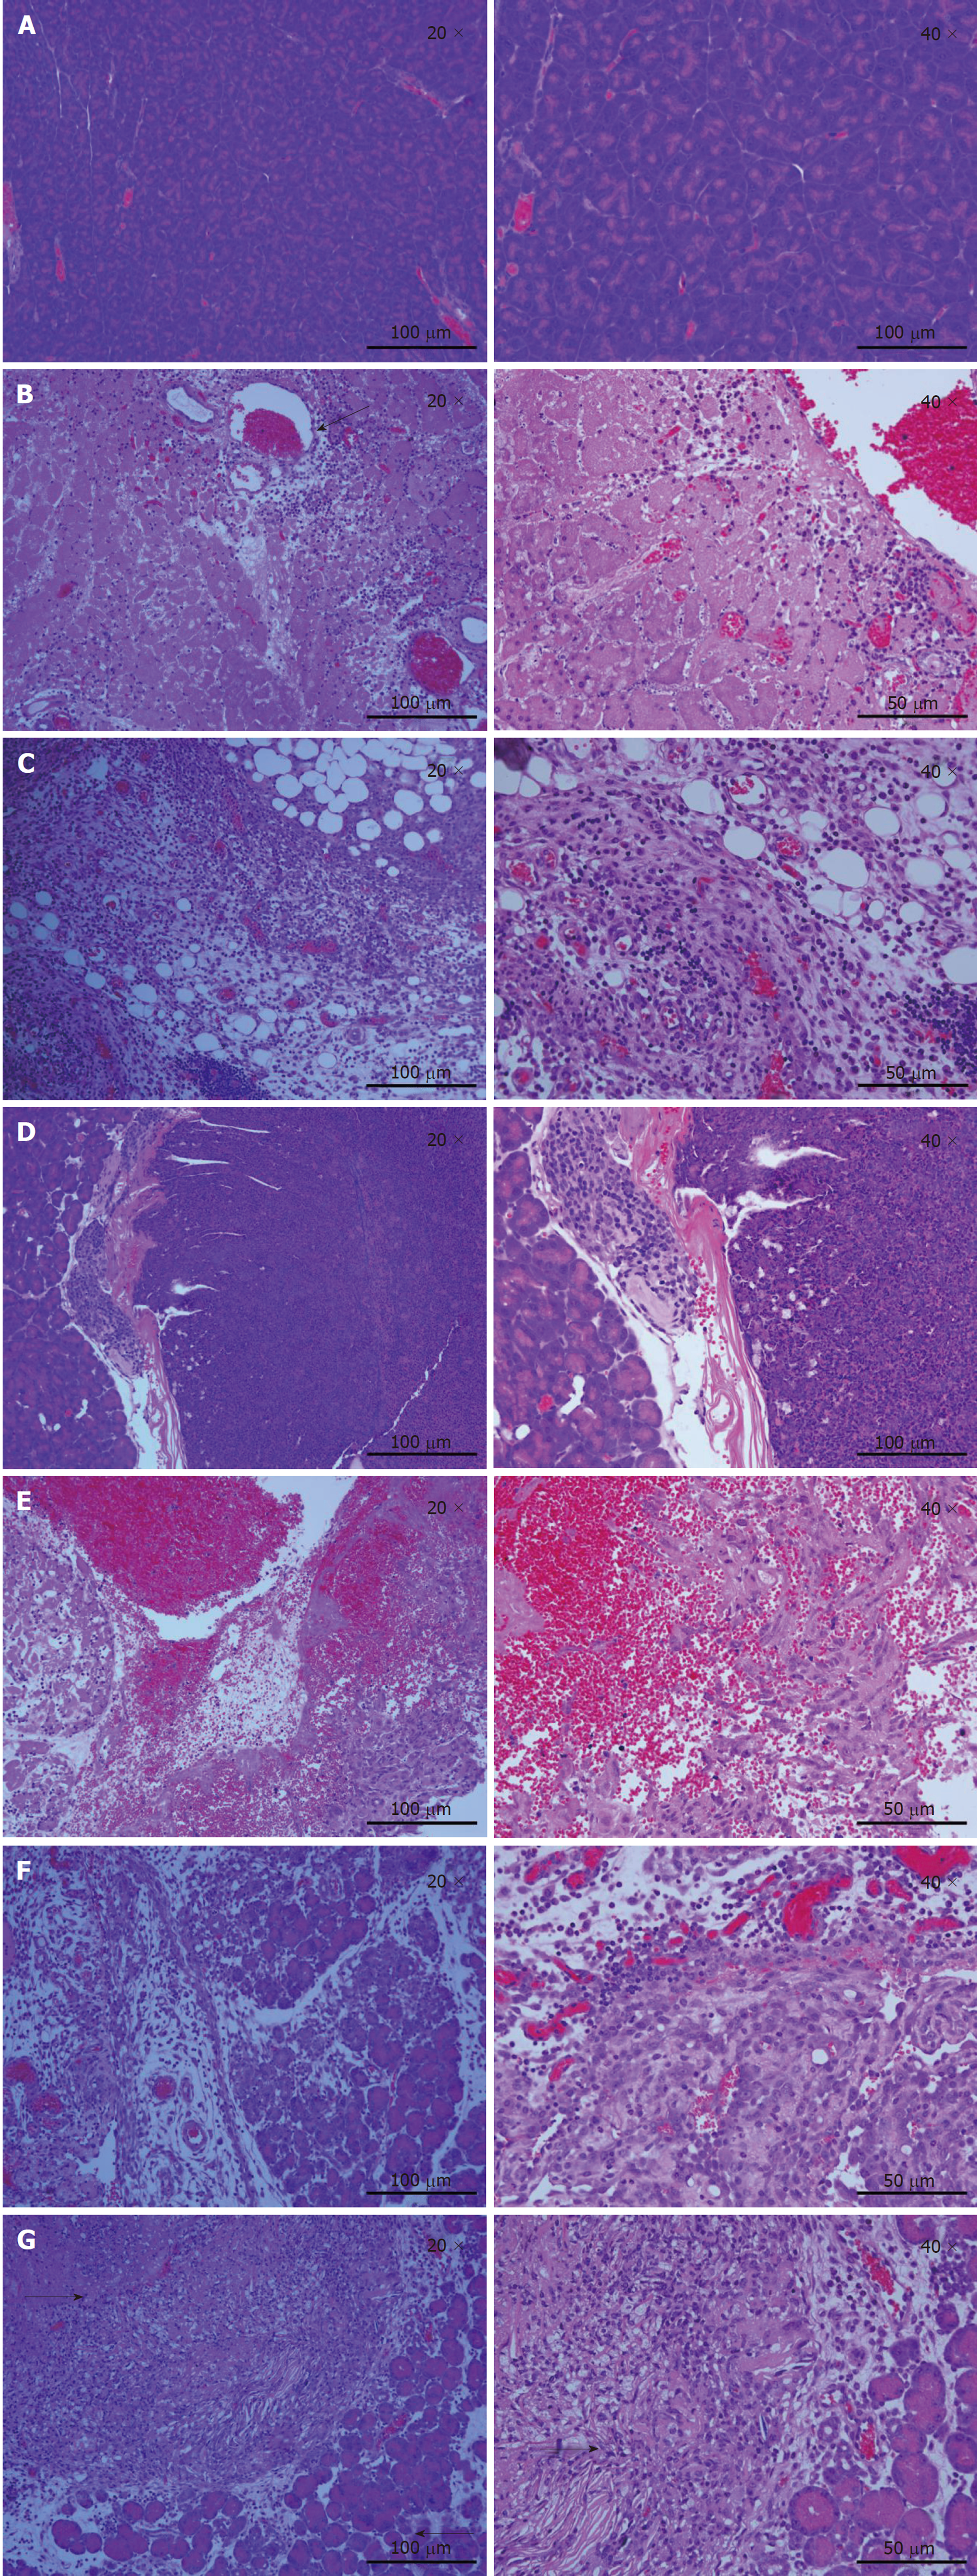
Figure 2 Hematoxylin and eosin staining of pancreatic cells in various groups.
A: Histologically stained tissues of pancreatic parenchyma in untreated animals; B, C: Histology showed a normal pancreas after IRE, and a seepage area of erythrocytes was observed around the ablation zone (arrow). Additionally, larger amounts of erythrocytes were observed at 3 d post-IRE compared with 7 d post-IRE (black arrows represent the erythrocyte zone). The vascular structure was not damaged; D: Hematoxylin and eosin staining of tumor cells; E: Nuclear agglutination was observed 1 d post-IRE. The nucleus-to-cytoplasm ratio tended to increase; F: At 3 d post-therapy, a heterogeneous necrotizing tumor was present; G: Micrograph depicting the human pancreatic cancer cells 1 tumor xenograft 7 d post-IRE. A clear demarcation between the ablated (left side) and normal tumor (right side) tissues is depicted (arrows). Tumor cells were arranged more loosely in G compared with F (× 200 or × 400). IRE: Irreversible electroporation.
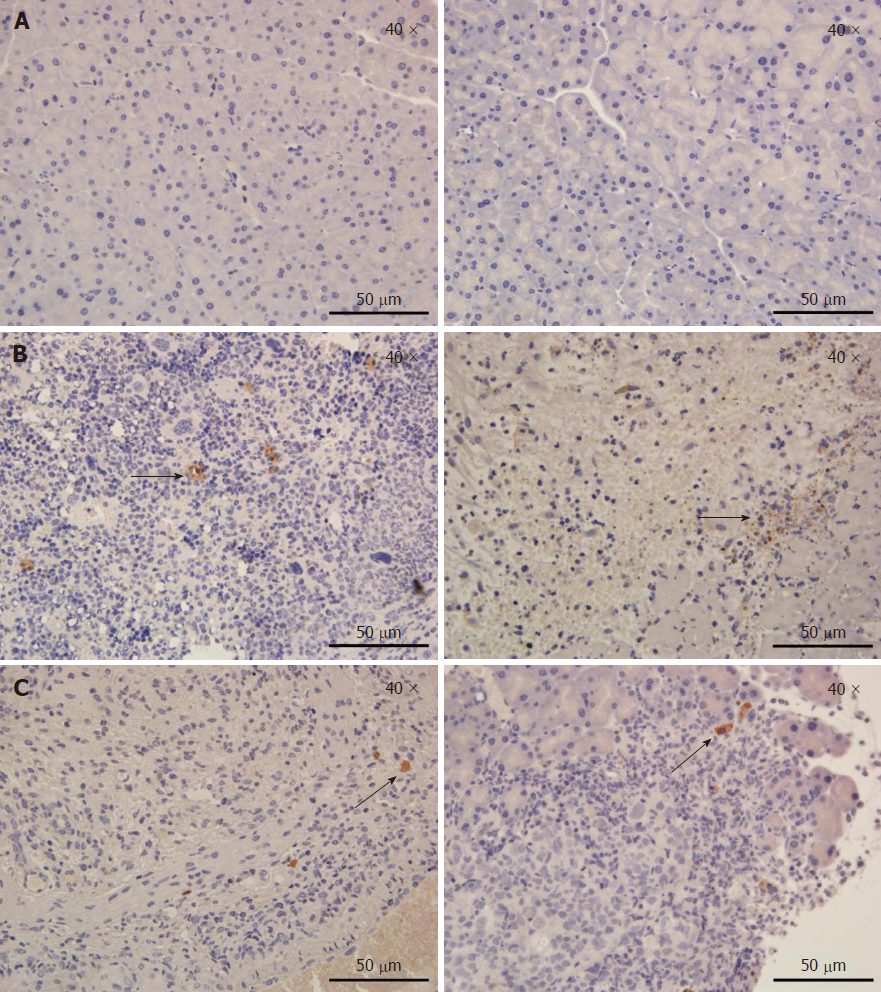
Figure 3 Tumor tissue sections at 1 d and 7 d after the irreversible electroporation treatment were stained for Ki67 and cleaved caspase-3.
A: A representative immunohistochemistry image in an untreated pancreatic parenchyma; B: In tumor tissues, extensive caspase-3 activation was observed on the first postoperative day. Irreversible electroporation significantly increased cell proliferation (Ki67 staining) at 1 d post-treatment, but cell proliferation was decreased at 7 d post-treatment (arrows); C: Limited caspase-3 staining at 7 d post-irreversible electroporation treatment was found in treated tumors, while most of the viable tumor tissues showed no caspase-3 activation. The slides were imaged at 400 × by light microscopy.
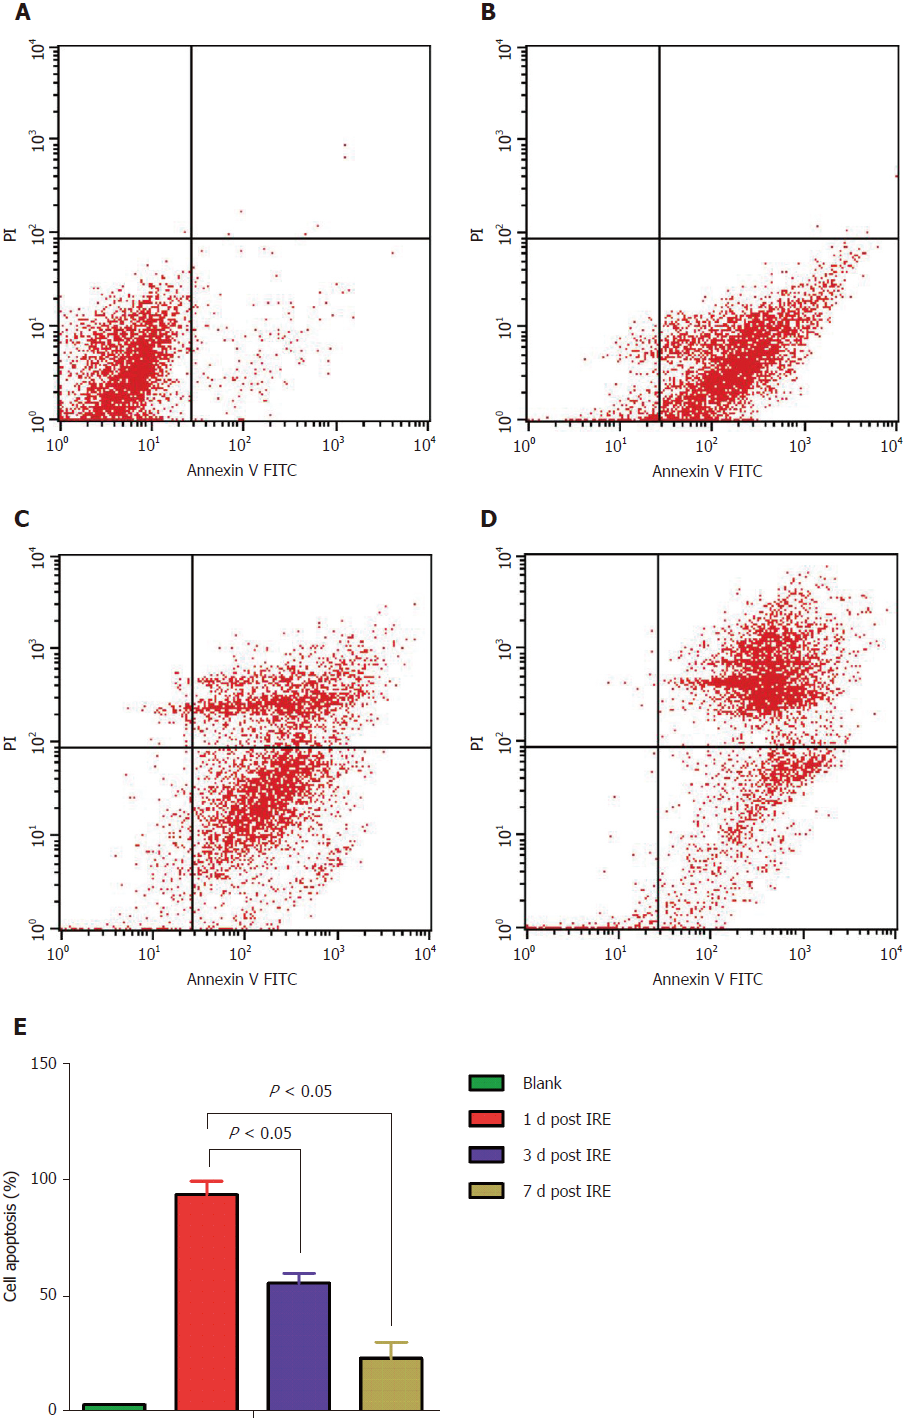
Figure 4 Apoptosis assay of mouse spleen cells before and after irreversible electroporation treatment using double-staining with annexin V-fluorescein isothiocyanate/propidium iodide.
Apoptosis was quantified by flow cytometry. A: Control group; B: 1 d post-IRE; C: 3 d post-IRE; D: 7 d post-IRE; E: Percentages of apoptotic cells before and after the IRE intervention. Data are mean ± SD (n = 8). IRE: irreversible electroporation.
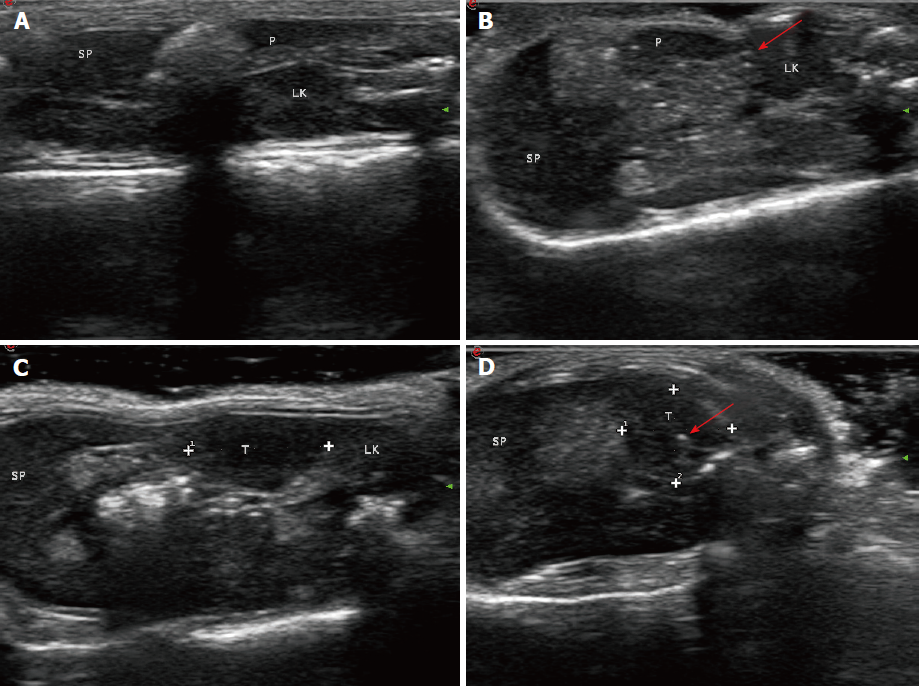
Figure 5 Evaluation of therapeutic effects of irreversible electroporation on tumors in vivo by ultrasound.
A: A pre-irreversible electroporation ultrasound image showing the normal pancreatic parenchyma; B: The ablation zone showed hyperechoic signals with a comet tail sign in the normal pancreatic tissue (arrow); C: White dots indicate the region of the tumor; D: Ultrasound image showing that the irreversible electroporation ablation zone in the tumor tissue became hyperechoic (arrow). SP: Spleen; LK: Left kidney; P: Pancreas; T: Tumor.
- Citation: Su JJ, Xu K, Wang PF, Zhang HY, Chen YL. Histological analysis of human pancreatic carcinoma following irreversible electroporation in a nude mouse model. World J Gastrointest Oncol 2018; 10(12): 476-486
- URL: https://www.wjgnet.com/1948-5204/full/v10/i12/476.htm
- DOI: https://dx.doi.org/10.4251/wjgo.v10.i12.476


