Copyright
©The Author(s) 2018.
World J Gastrointest Oncol. Oct 15, 2018; 10(10): 351-359
Published online Oct 15, 2018. doi: 10.4251/wjgo.v10.i10.351
Published online Oct 15, 2018. doi: 10.4251/wjgo.v10.i10.351
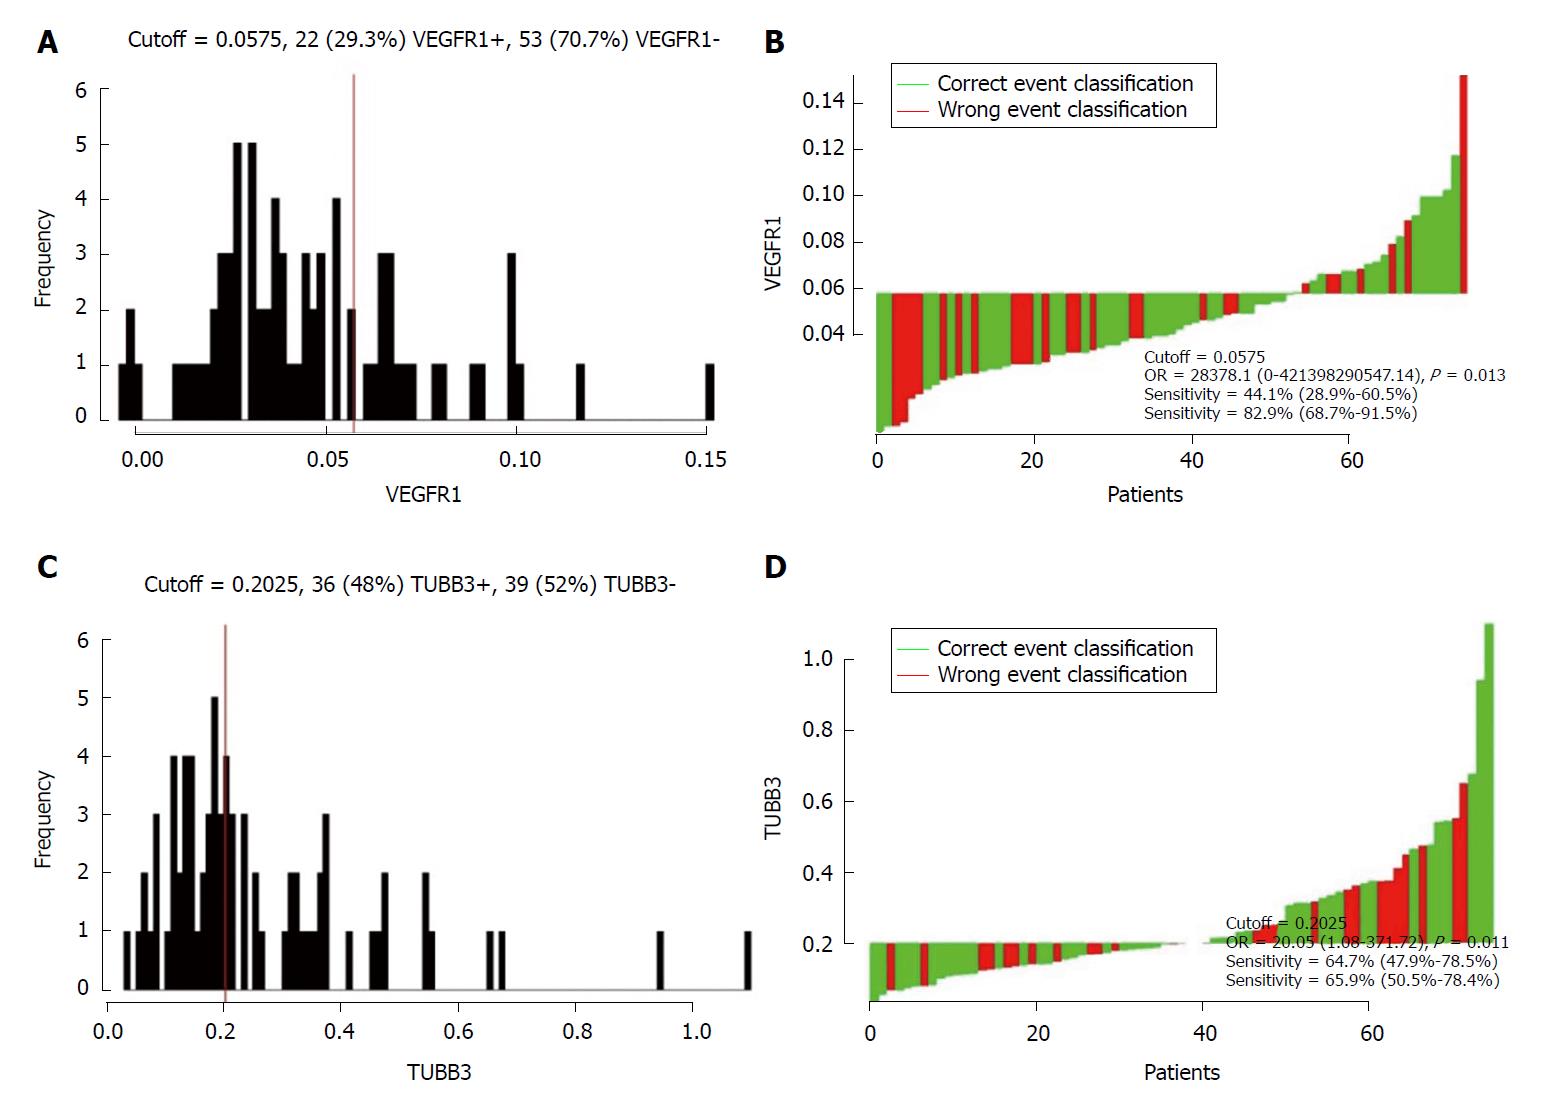
Figure 1 Distribution-based cutoff optimization of vascular endothelial growth factor receptor 1 and class III β-tubulin expression value in 75 non-metastatic rectal cancer patients.
A: Histograms of vascular endothelial growth factor receptor 1 (VEGFR1) expression value; B: Waterfall plot of optimal dichotomization for VEGFR1 expression value; C: Histograms of class III β-tubulin expression value; D: Waterfall plot of optimal dichotomization for VEGFR1 expression value.
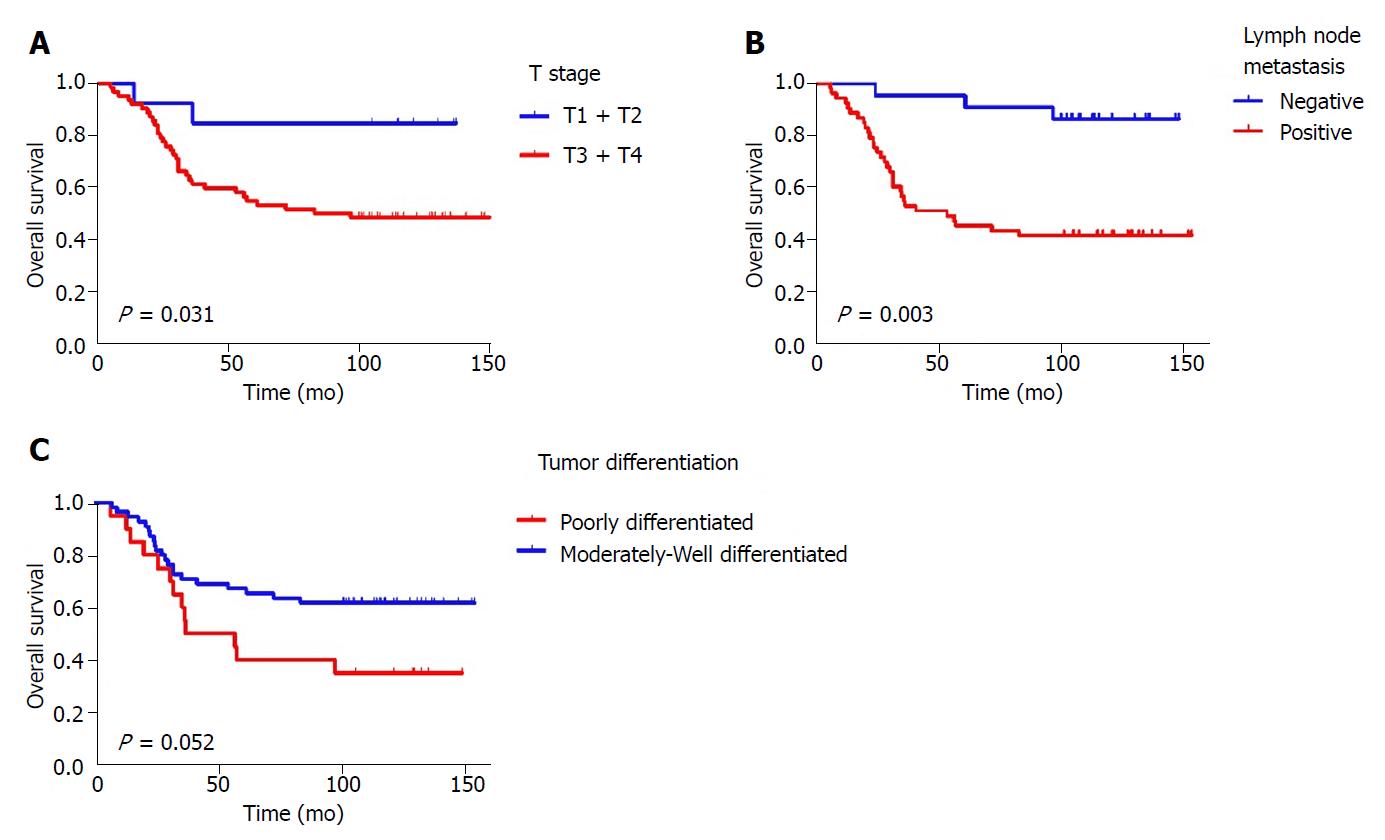
Figure 2 Kaplan-Meier survival curves of overall survival.
A: T stage (T1 + T2 vs T3 + T4, P = 0.031); B: Lymph node metastasis (negative vs positive, P = 0.003); C: Tumor differentiation (poorly differentiated vs moderately-well differentiated, P = 0.052).
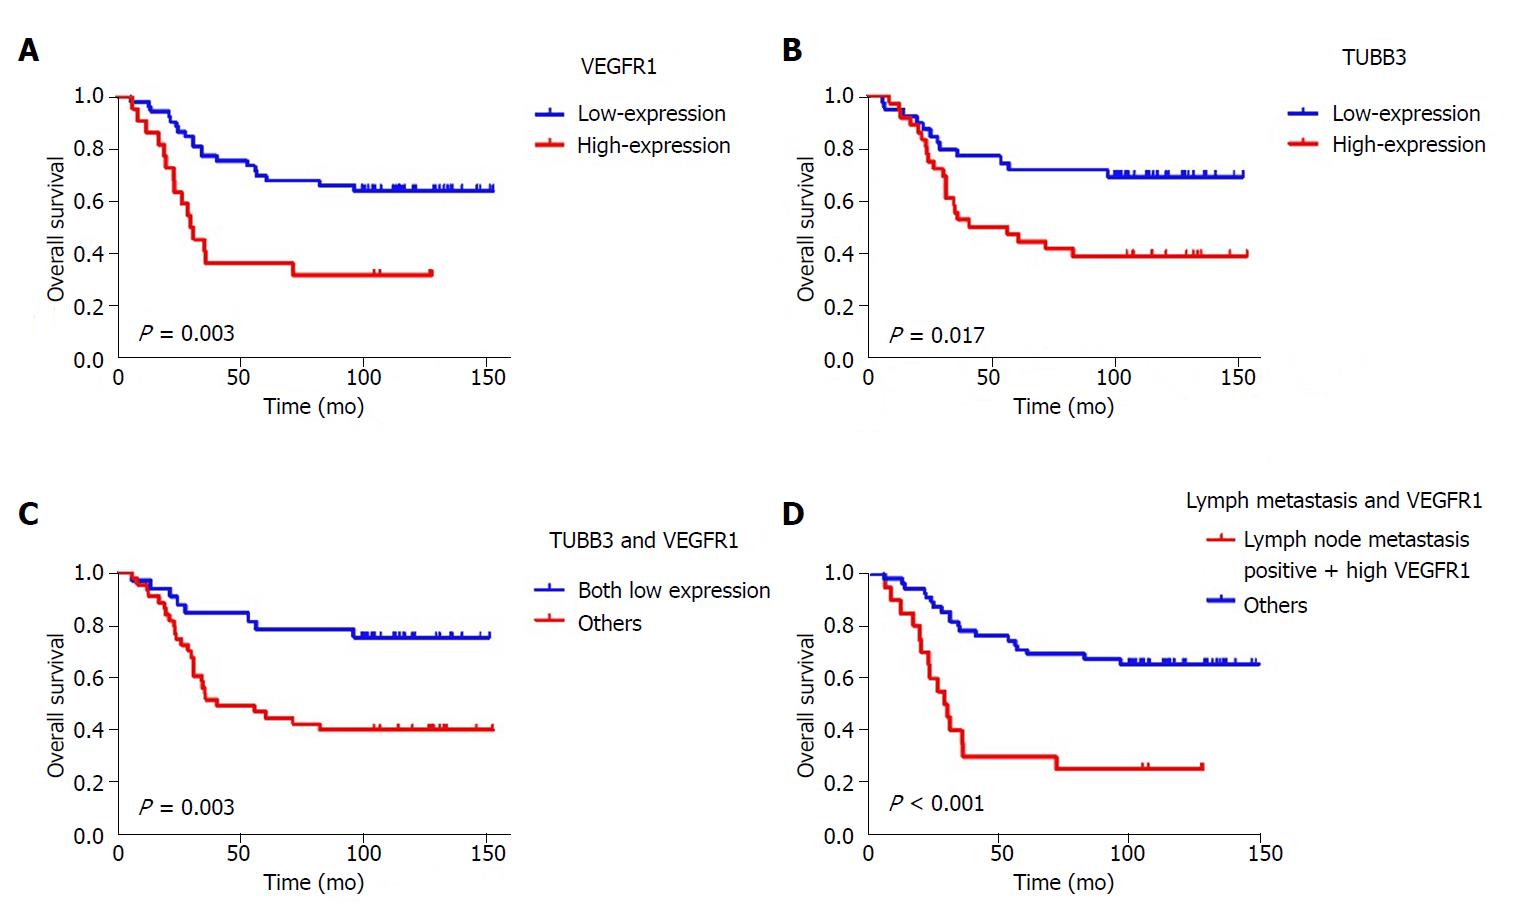
Figure 3 Kaplan-Meier survival curves of Overall Survival.
A: Vascular endothelial growth factor receptor 1 (VEGFR1) expression (low vs high, P = 0.003); B: Class III β-tubulin (TUBB3) expression (low vs high, P = 0.017); C: TUBB3 and VEGFR1 (both low expression vs others, P = 0.003); D: TNM stage and VEGFR1 (stage III + high VEGFR1 expression vs others, P < 0.001).
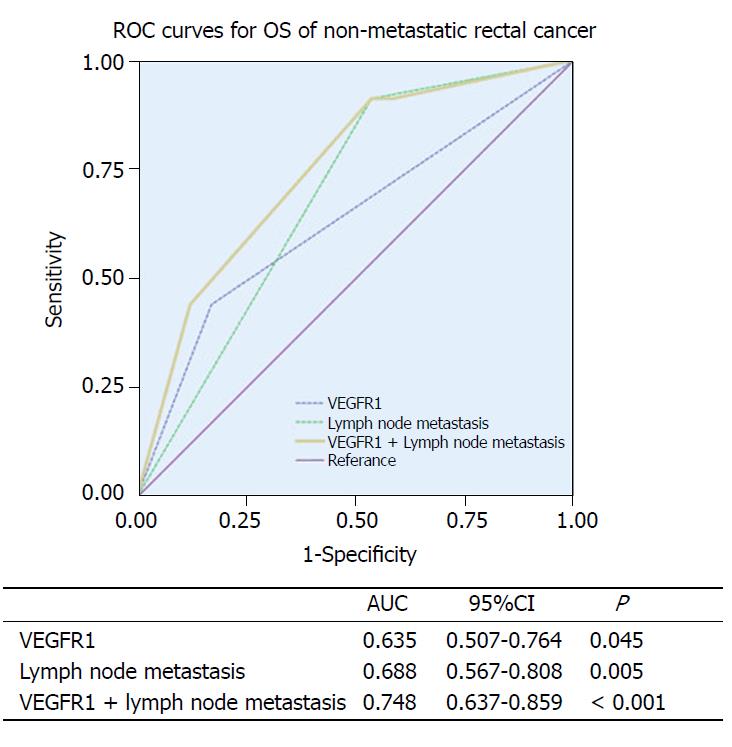
Figure 4 Receiver operating characteristic analyses in non-metastatic rectal cancer patients.
P-values show the area under the receiver operating characteristic (ROC) curves in the three models. ROC analyses of the prediction of overall survival by vascular endothelial growth factor receptor 1 (VEGFR1) expression model, lymph node metastasis, and the combined VEGFR1 expression-lymph node metastasis model.
- Citation: Kong XQ, Huang YX, Li JL, Zhang XQ, Peng QQ, Tang LR, Wu JX. Prognostic value of vascular endothelial growth factor receptor 1 and class III β-tubulin in survival for non-metastatic rectal cancer. World J Gastrointest Oncol 2018; 10(10): 351-359
- URL: https://www.wjgnet.com/1948-5204/full/v10/i10/351.htm
- DOI: https://dx.doi.org/10.4251/wjgo.v10.i10.351


