Copyright
©The Author(s) 2018.
World J Gastrointest Oncol. Oct 15, 2018; 10(10): 344-350
Published online Oct 15, 2018. doi: 10.4251/wjgo.v10.i10.344
Published online Oct 15, 2018. doi: 10.4251/wjgo.v10.i10.344
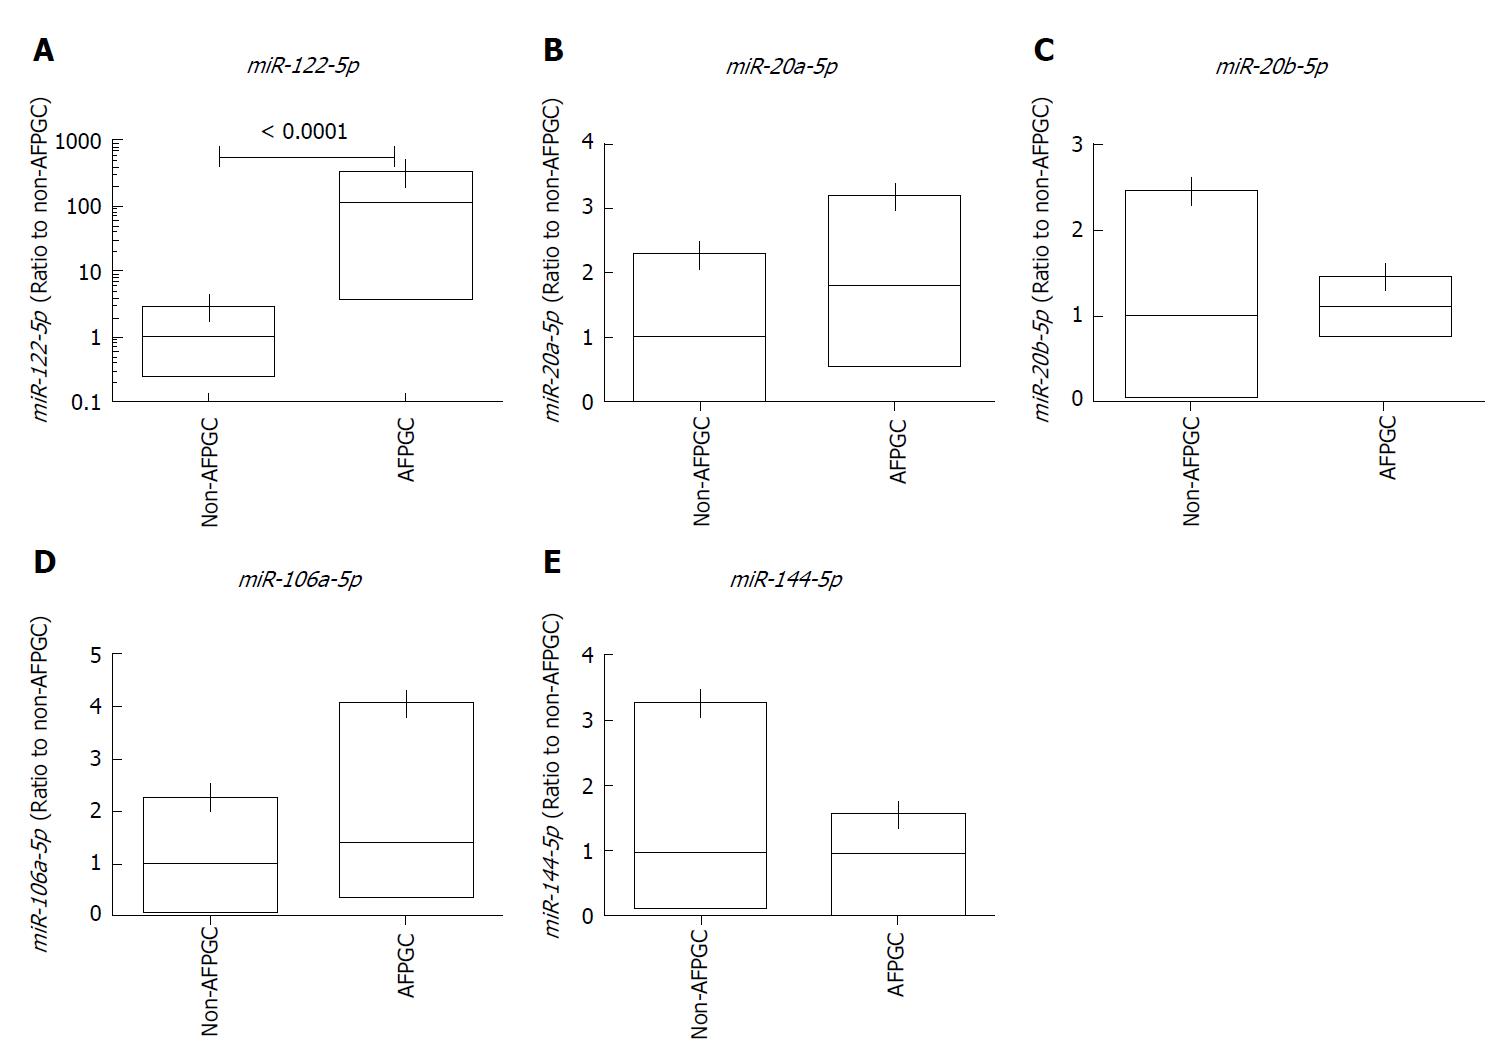
Figure 1 Validation of five microRNAs in non-alpha-fetoprotein producing gastric cancer and alpha-fetoprotein producing gastric cancer tissue samples performed by quantitative reverse transcription-polymerase chain reaction.
A: miR-122-5p; B: miR-20a-5p; C: miR-20b-5p; D: miR-106a-5p; E: miR-144-5p. The lines inside the bow plot represent the average size. AFPGC: Alpha-fetoprotein-producing gastric cancer.
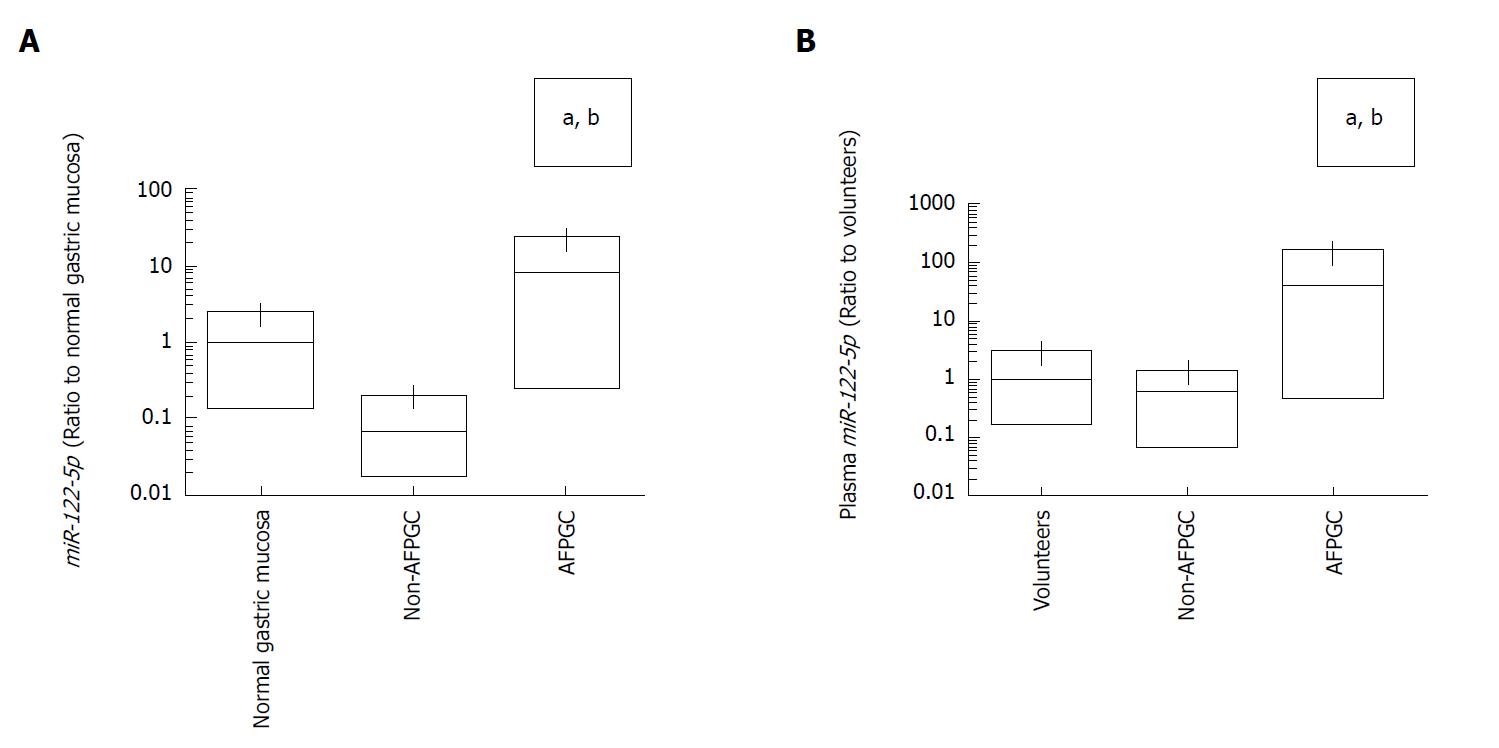
Figure 2 Quantification of miR-122-5p expression levels by quantitative reverse transcription-polymerase chain reaction.
A: Comparison of miR-122-5p expression levels between normal gastric mucosa, non-alpha-fetoprotein-producing gastric cancer (AFPGC) and AFPGC in tissue samples. aP < 0.05, compared to normal gastric mucosa; bP < 0.05, compared to non-AFPGC; B: Comparison of miR-122-5p expression levels between health volunteers, non-AFPGC and AFPGC in plasma sample. aP < 0.05, compared to health volunteers; bP < 0.05, compared to non-AFPGC. The lines inside the bow plot represent the average size.
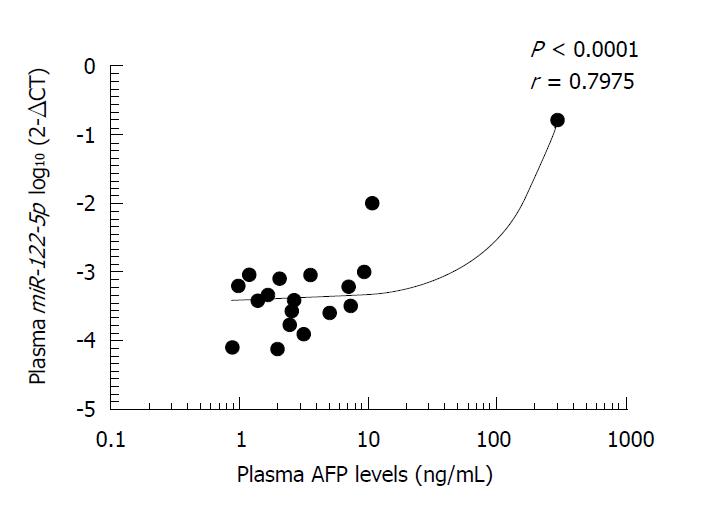
Figure 3 Relationship between plasma alpha-fetoprotein levels and plasma miR-122-5p expression levels.
Plasma miR-122-5p expression level was strongly correlated with plasma alpha-fetoprotein (AFP) levels in gastric cancer patients (r = 0.7975, P < 0.0001).
Figure 4 Correlation between malignant potential and tissue miR-122-5p expression levels in alpha-fetoprotein-producing gastric cancer patients.
White symbols indicate current alive and black symbols indicate current death. AFP: Alpha-fetoprotein.
- Citation: Maruyama S, Furuya S, Shiraishi K, Shimizu H, Akaike H, Hosomura N, Kawaguchi Y, Amemiya H, Kawaida H, Sudo M, Inoue S, Kono H, Ichikawa D. miR-122-5p as a novel biomarker for alpha-fetoprotein-producing gastric cancer. World J Gastrointest Oncol 2018; 10(10): 344-350
- URL: https://www.wjgnet.com/1948-5204/full/v10/i10/344.htm
- DOI: https://dx.doi.org/10.4251/wjgo.v10.i10.344


