Copyright
©The Author(s) 2016.
World J Gastrointest Endosc. Dec 16, 2016; 8(20): 777-784
Published online Dec 16, 2016. doi: 10.4253/wjge.v8.i20.777
Published online Dec 16, 2016. doi: 10.4253/wjge.v8.i20.777
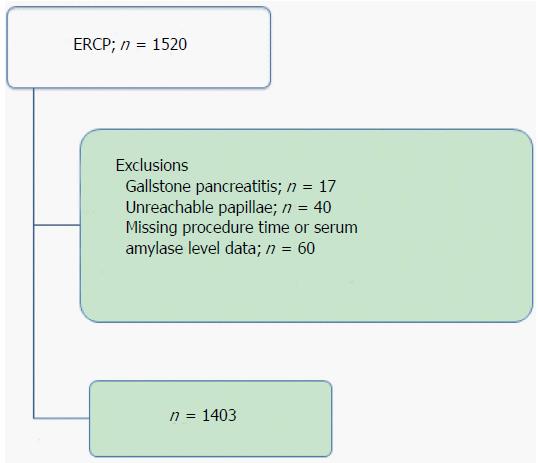
Figure 1 Study flow chart.
ERCP: Endoscopic retrograde cholangiopancreatography.
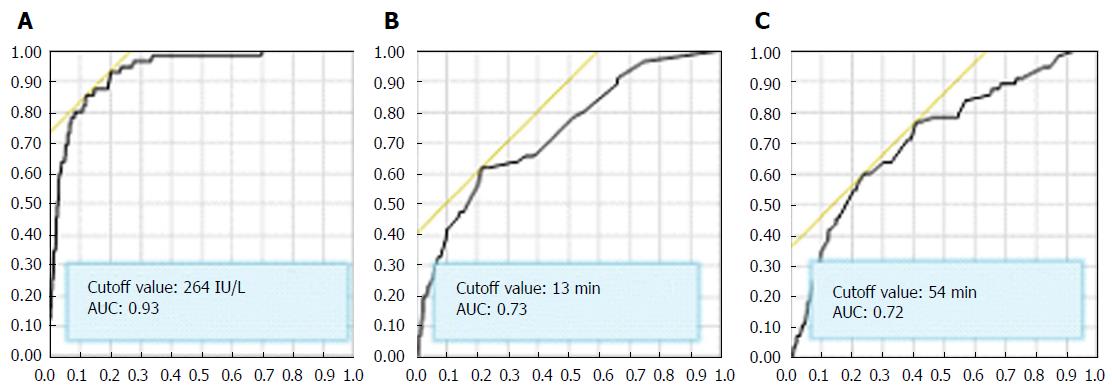
Figure 2 Receiver operating characteristic curve of 2 h amylase levels (A), cannulation times (B), and procedure times (C).
AUC: Area under the curve.
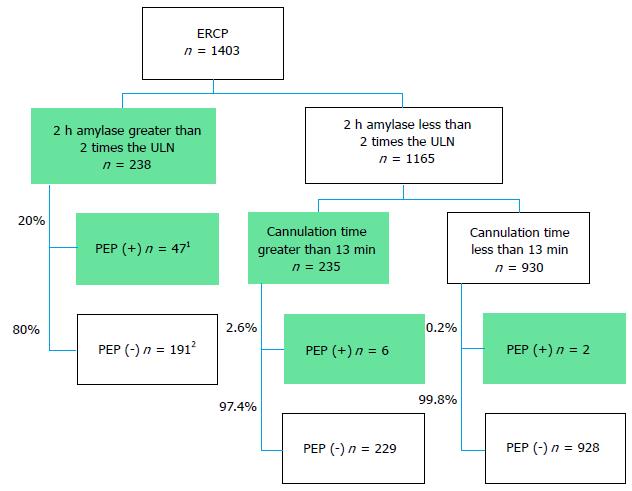
Figure 3 Flow chart using two-hour amylase levels and cannulation times for predicting pancreatitis.
1Includes cannulation times greater than 13 min, n = 28; 2Includes cannulation times greater than 13 min, n = 64. ERCP: Endoscopic retrograde cholangiopancreatography; PEP: Post ERCP Pancreatitis; ULN: Upper limit of normal.
- Citation: Hayashi S, Nishida T, Shimakoshi H, Shimoda A, Amano T, Sugimoto A, Takahashi K, Mukai K, Matsubara T, Yamamoto M, Nakajima S, Fukui K, Inada M. Combination of two-hour post-endoscopic retrograde cholangiopancreatography amylase levels and cannulation times is useful for predicting post-endoscopic retrograde cholangiopancreatography pancreatitis. World J Gastrointest Endosc 2016; 8(20): 777-784
- URL: https://www.wjgnet.com/1948-5190/full/v8/i20/777.htm
- DOI: https://dx.doi.org/10.4253/wjge.v8.i20.777


