Copyright
©2014 Baishideng Publishing Group Inc.
World J Gastrointest Endosc. May 16, 2014; 6(5): 176-185
Published online May 16, 2014. doi: 10.4253/wjge.v6.i5.176
Published online May 16, 2014. doi: 10.4253/wjge.v6.i5.176
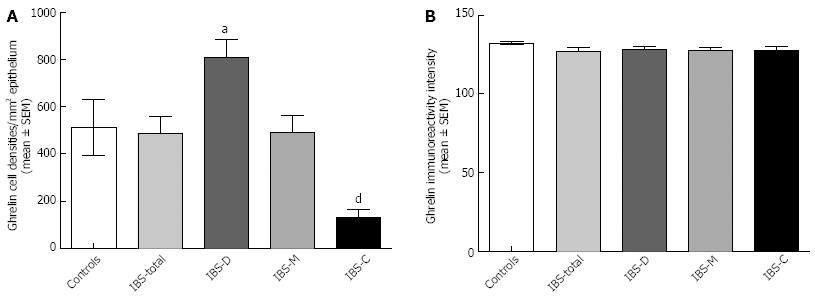
Figure 1 Ghrelin cell densities (A) and ghrelin immunoreactivity intensities (B) in the oxyntic mucosa of the stomach of controls and IBS-total, IBS-D, IBS-M and IBS-C patients.
aP < 0.05, and dP < 0.01 vs controls. IBS: Irritable bowel syndrome; IBS-total: All patients with irritable bowel syndrome; IBS-D: Patients with diarrhea as the predominant syndrome; IBS-M: Patients with both diarrhea and constipation; IBS-C: Patients with constipation as the predominant syndrome.
Figure 2 Ghrelin-immunoreactive cells in a control subject (A), a patient with IBS-D (B), and a patient with IBS-C (C).
IBS: Irritable bowel syndrome; IBS-D: Patients with diarrhea as the predominant syndrome; IBS-C: Patients with constipation as the predominant syndrome.
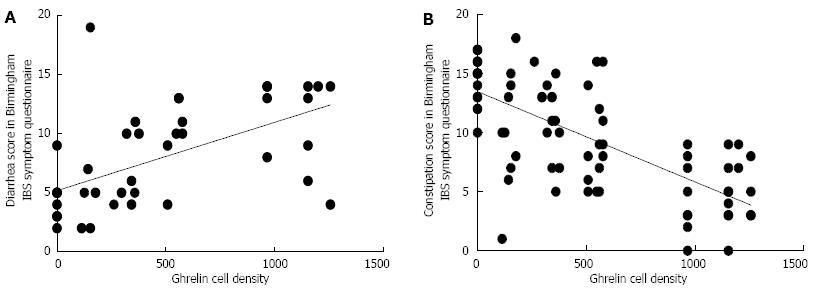
Figure 3 Correlations of ghrelin cell density with diarrhea (A) and constipation (B) scores as assessed by the Birmingham irritable bowel syndrome symptom questionnaire.
IBS: Irritable bowel syndrome.
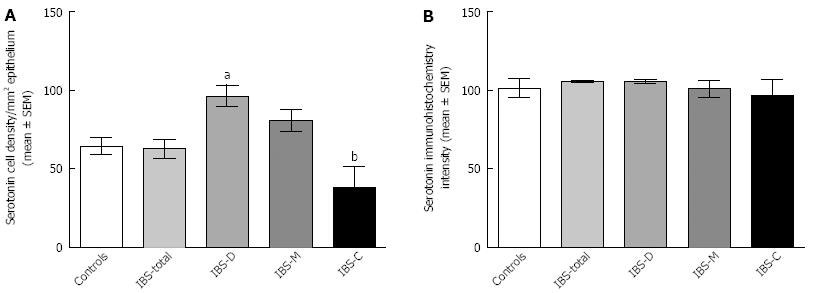
Figure 4 Serotonin cell densities (A) and serotonin immunoreactivity intensities (B) in IBS-total, IBS-D, IBS-M and IBS-C patients.
aP < 0.05, bP < 0.01 vs controls. IBS: Irritable bowel syndrome; IBS-total: All patients with irritable bowel syndrome; IBS-D: Patients with diarrhea as the predominant syndrome; IBS-M: Patients with both diarrhea and constipation; IBS-C: Patients with constipation as the predominant syndrome.
Figure 5 Serotonin cells in the oxyntic mucosa of the stomach of a control subject (A), a patient with IBS-D (B), and a patient with IBS-C (C).
IBS: Irritable bowel syndrome; IBS-D: Patients with diarrhea as the predominant syndrome; IBS-C: Patients with constipation as the predominant syndrome.
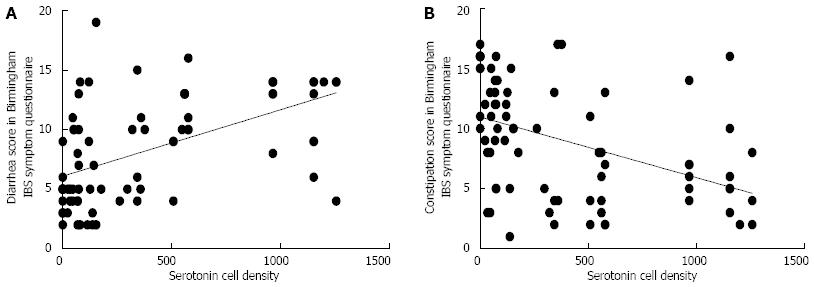
Figure 6 Correlations of serotonin cell density with diarrhea (A) and constipation (B) scores as assessed by the Birmingham irritable bowel syndrome symptom questionnaire.
IBS: Irritable bowel syndrome.
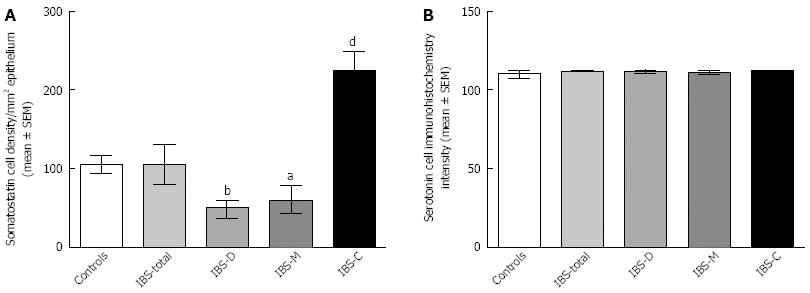
Figure 7 Somatostatin cell densities (A) and somatostatin immunoreactivity intensities (B) in IBS-total, IBS-D, IBS-M and IBS-D patients.
The symbols are the same as in Figures 1 and 4. IBS: Irritable bowel syndrome; IBS-total: All patients with irritable bowel syndrome; IBS-D: Patients with diarrhea as the predominant syndrome; IBS-M: Patients with both diarrhea and constipation; IBS-C: Patients with constipation as the predominant syndrome. aP < 0.05, bP < 0.01 and dP < 0.01 vs controls.
Figure 8 Somatostatin cells in the oxyntic mucosa of the stomach of a control subject (A), a patient with IBS-D (B), and a patient with IBS-C (C).
IBS: Irritable bowel syndrome; IBS-D: Patients with diarrhea as the predominant syndrome; IBS-C: Patients with constipation as the predominant syndrome.
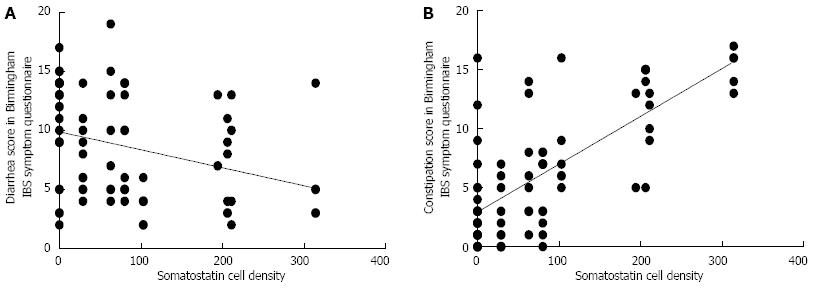
Figure 9 Correlations of somatostatin cell density with diarrhea (A) and constipation (B) scores as assessed by the Birmingham irritable bowel syndrome symptom questionnaire.
IBS: Irritable bowel syndrome.
- Citation: El-Salhy M, Gilja OH, Gundersen D, Hausken T. Endocrine cells in the oxyntic mucosa of the stomach in patients with irritable bowel syndrome. World J Gastrointest Endosc 2014; 6(5): 176-185
- URL: https://www.wjgnet.com/1948-5190/full/v6/i5/176.htm
- DOI: https://dx.doi.org/10.4253/wjge.v6.i5.176


