Copyright
©The Author(s) 2024.
World J Gastrointest Endosc. Aug 16, 2024; 16(8): 483-488
Published online Aug 16, 2024. doi: 10.4253/wjge.v16.i8.483
Published online Aug 16, 2024. doi: 10.4253/wjge.v16.i8.483
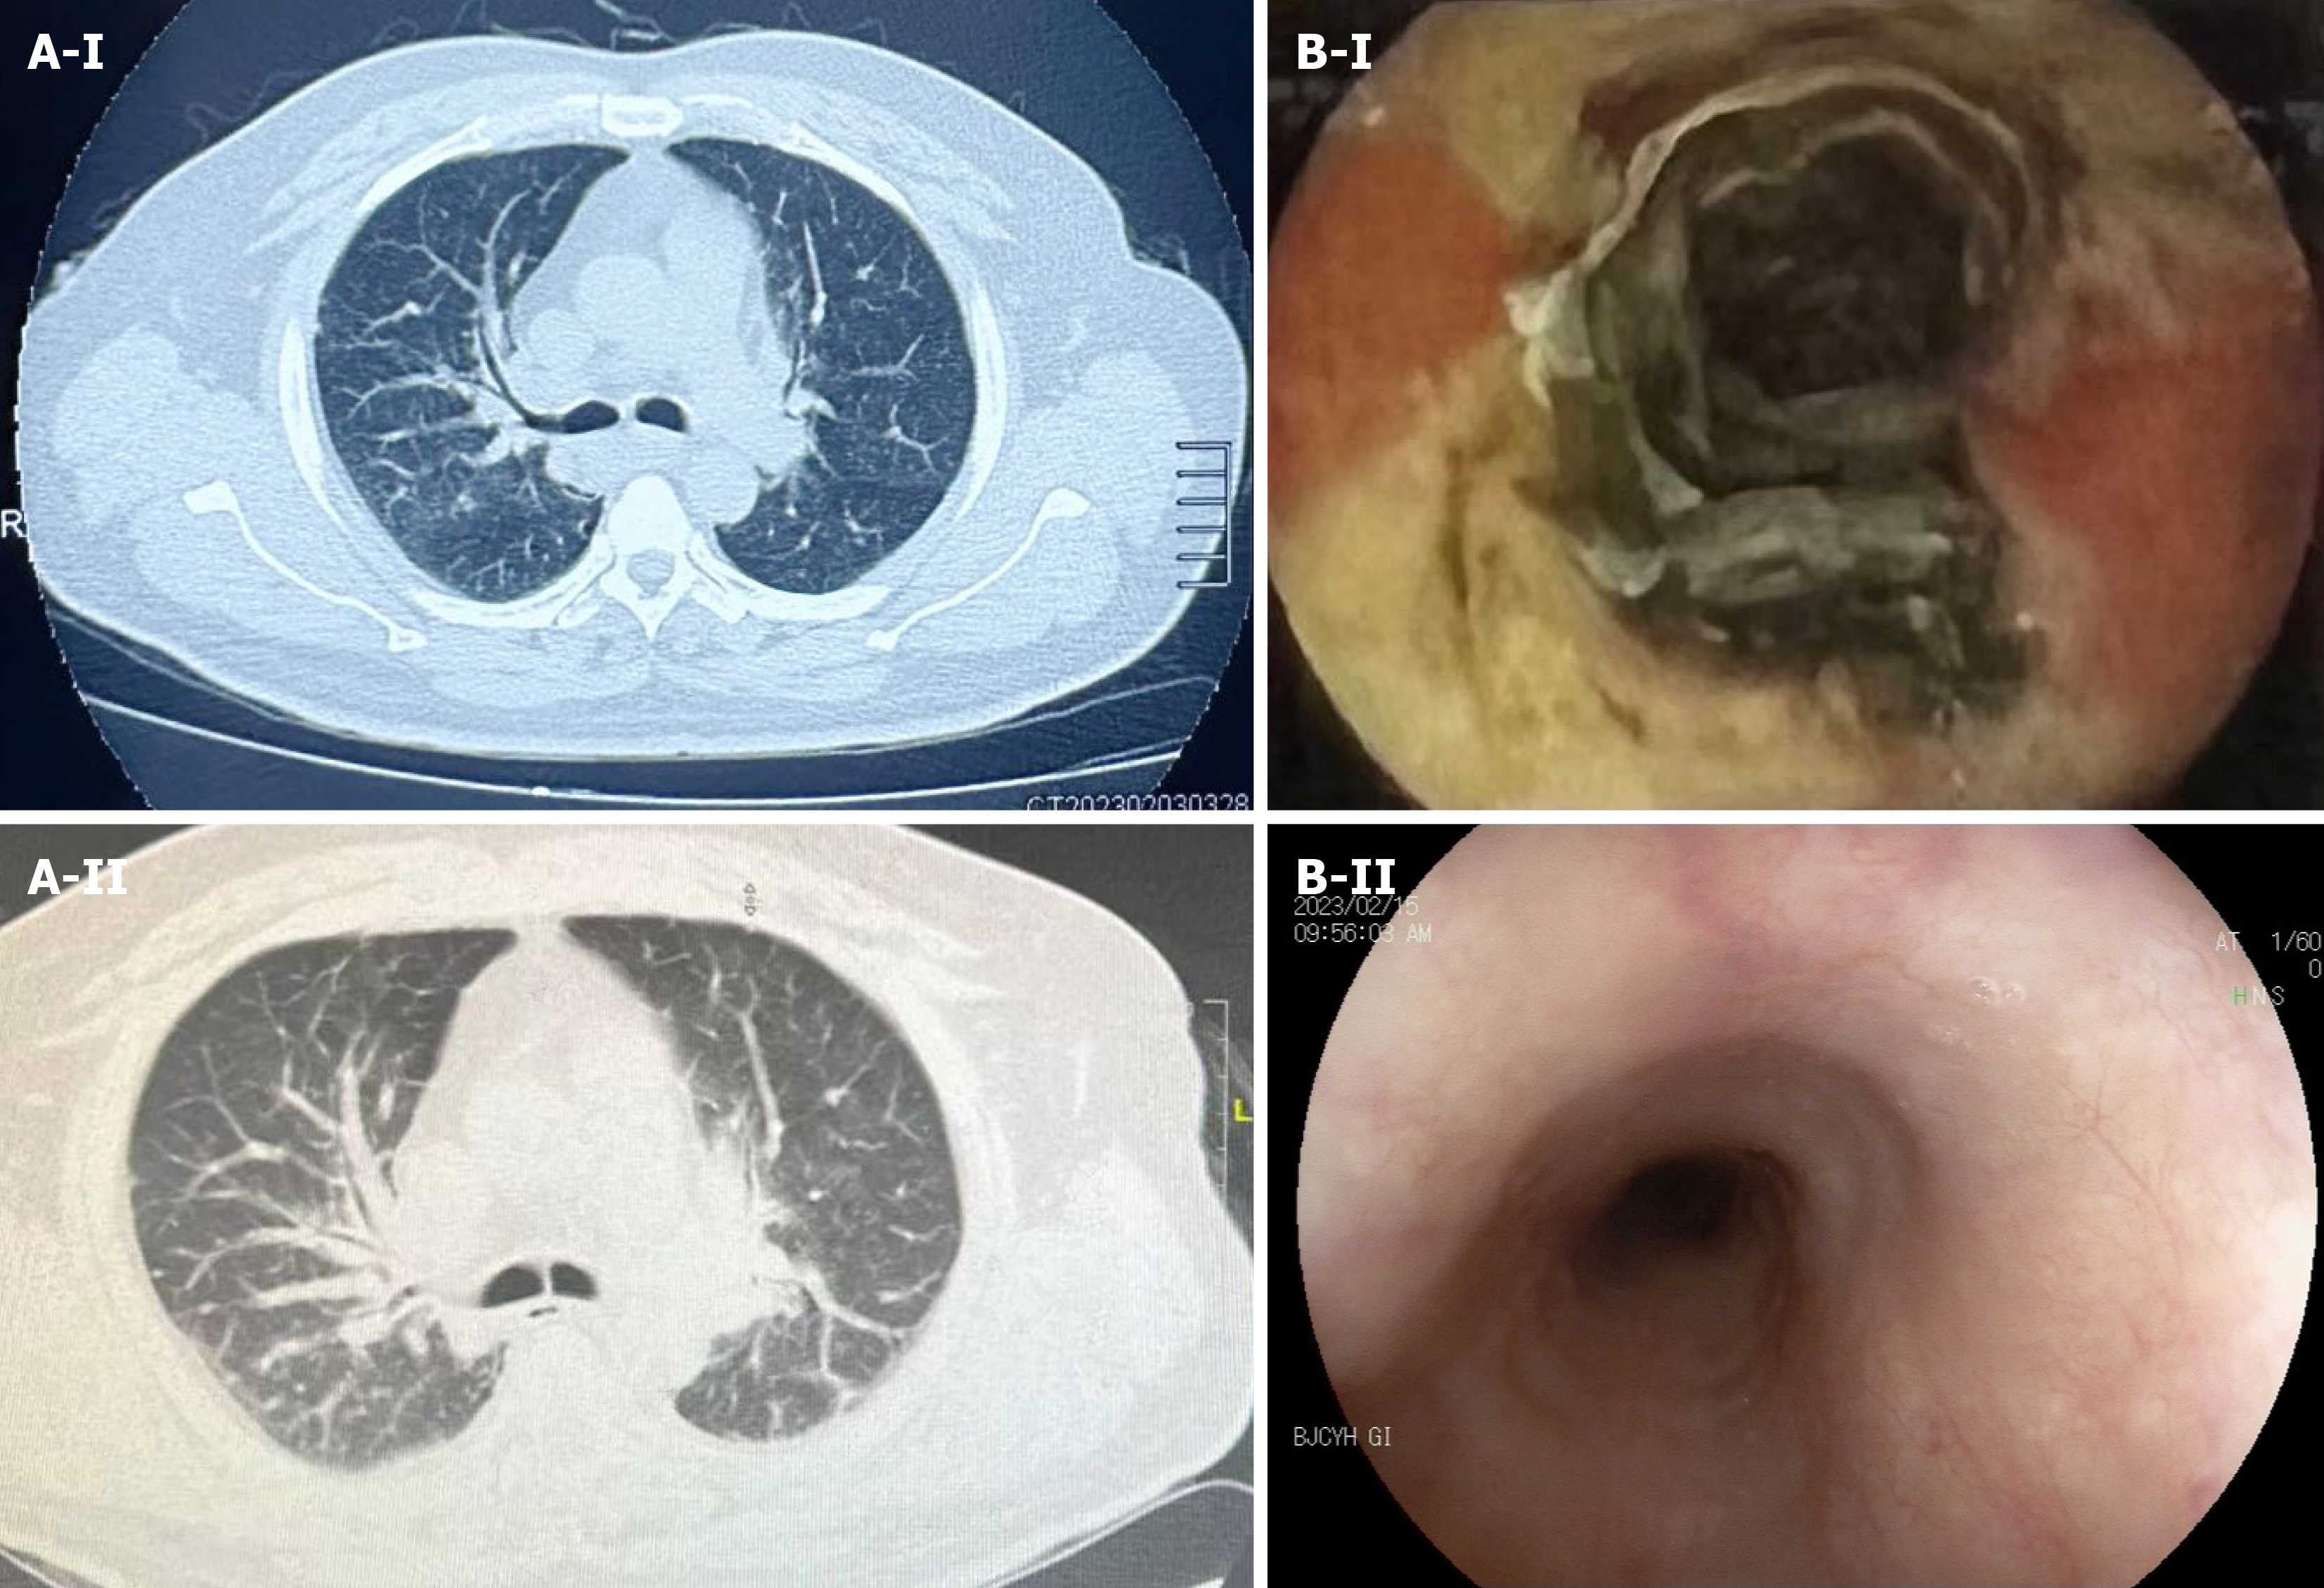
Figure 1 Computed tomography and endoscopy.
A-I: Chest computed tomography (CT) on day 1 after onset of complained symptoms showing pulmonary inflammation; A-II: Chest CT on day 12 showing pulmonary edema; B-I: Endoscopic findings on day 9 showing esophageal ulcer 34 cm from the incisor; B-II: Endoscopic findings on day 19 showing smooth esophageal mucosa.
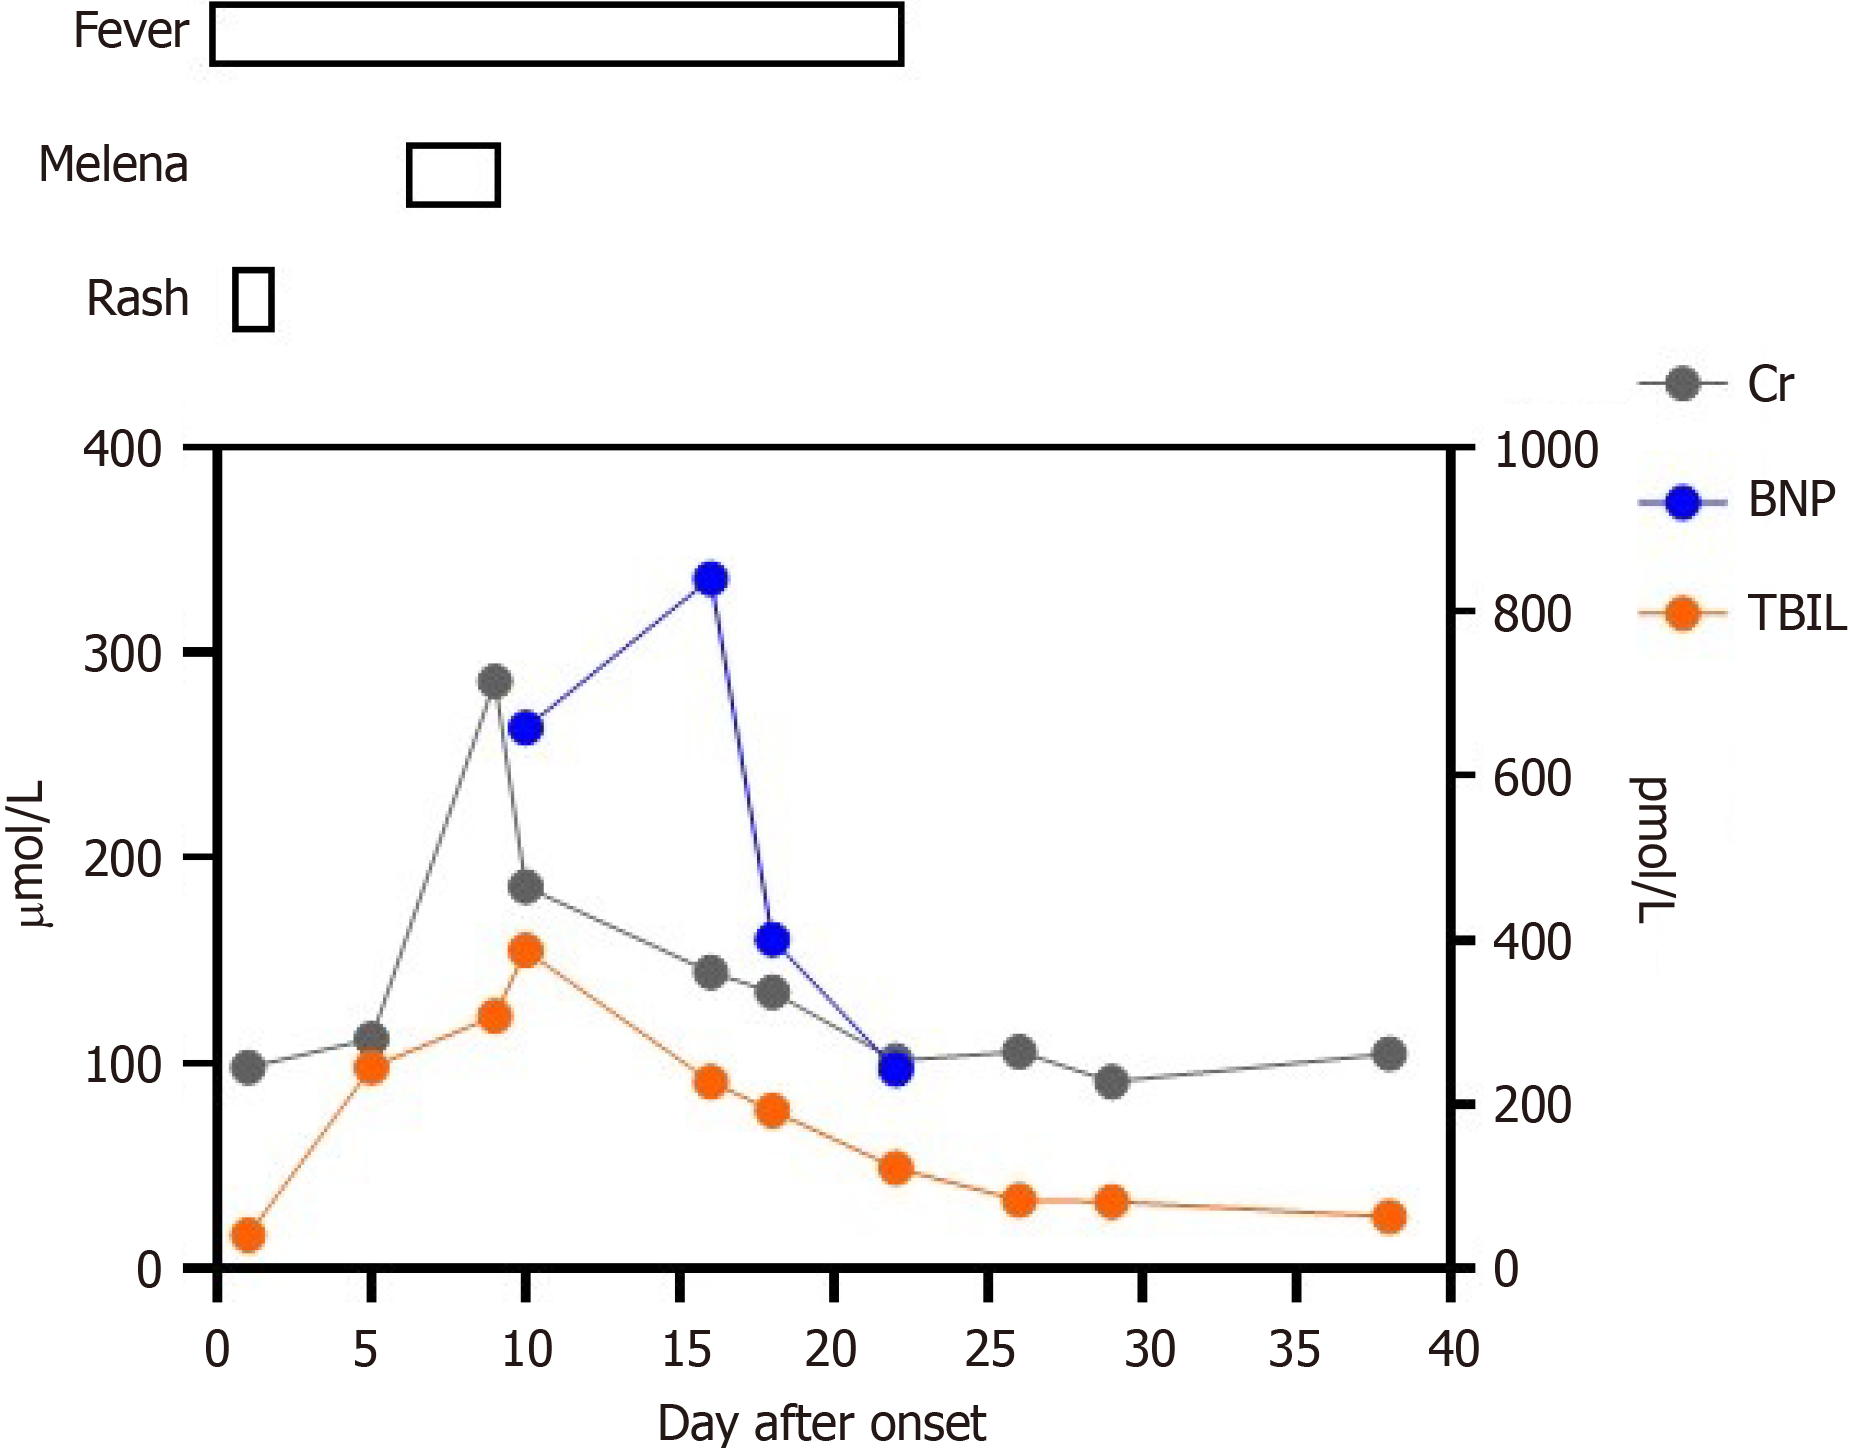
Figure 2 Changes of total bilirubin, creatinine and brain natriuretic peptide.
TBIL: Total bilirubin; Cr: Creatinine; BNP: Brain natriuretic peptide.
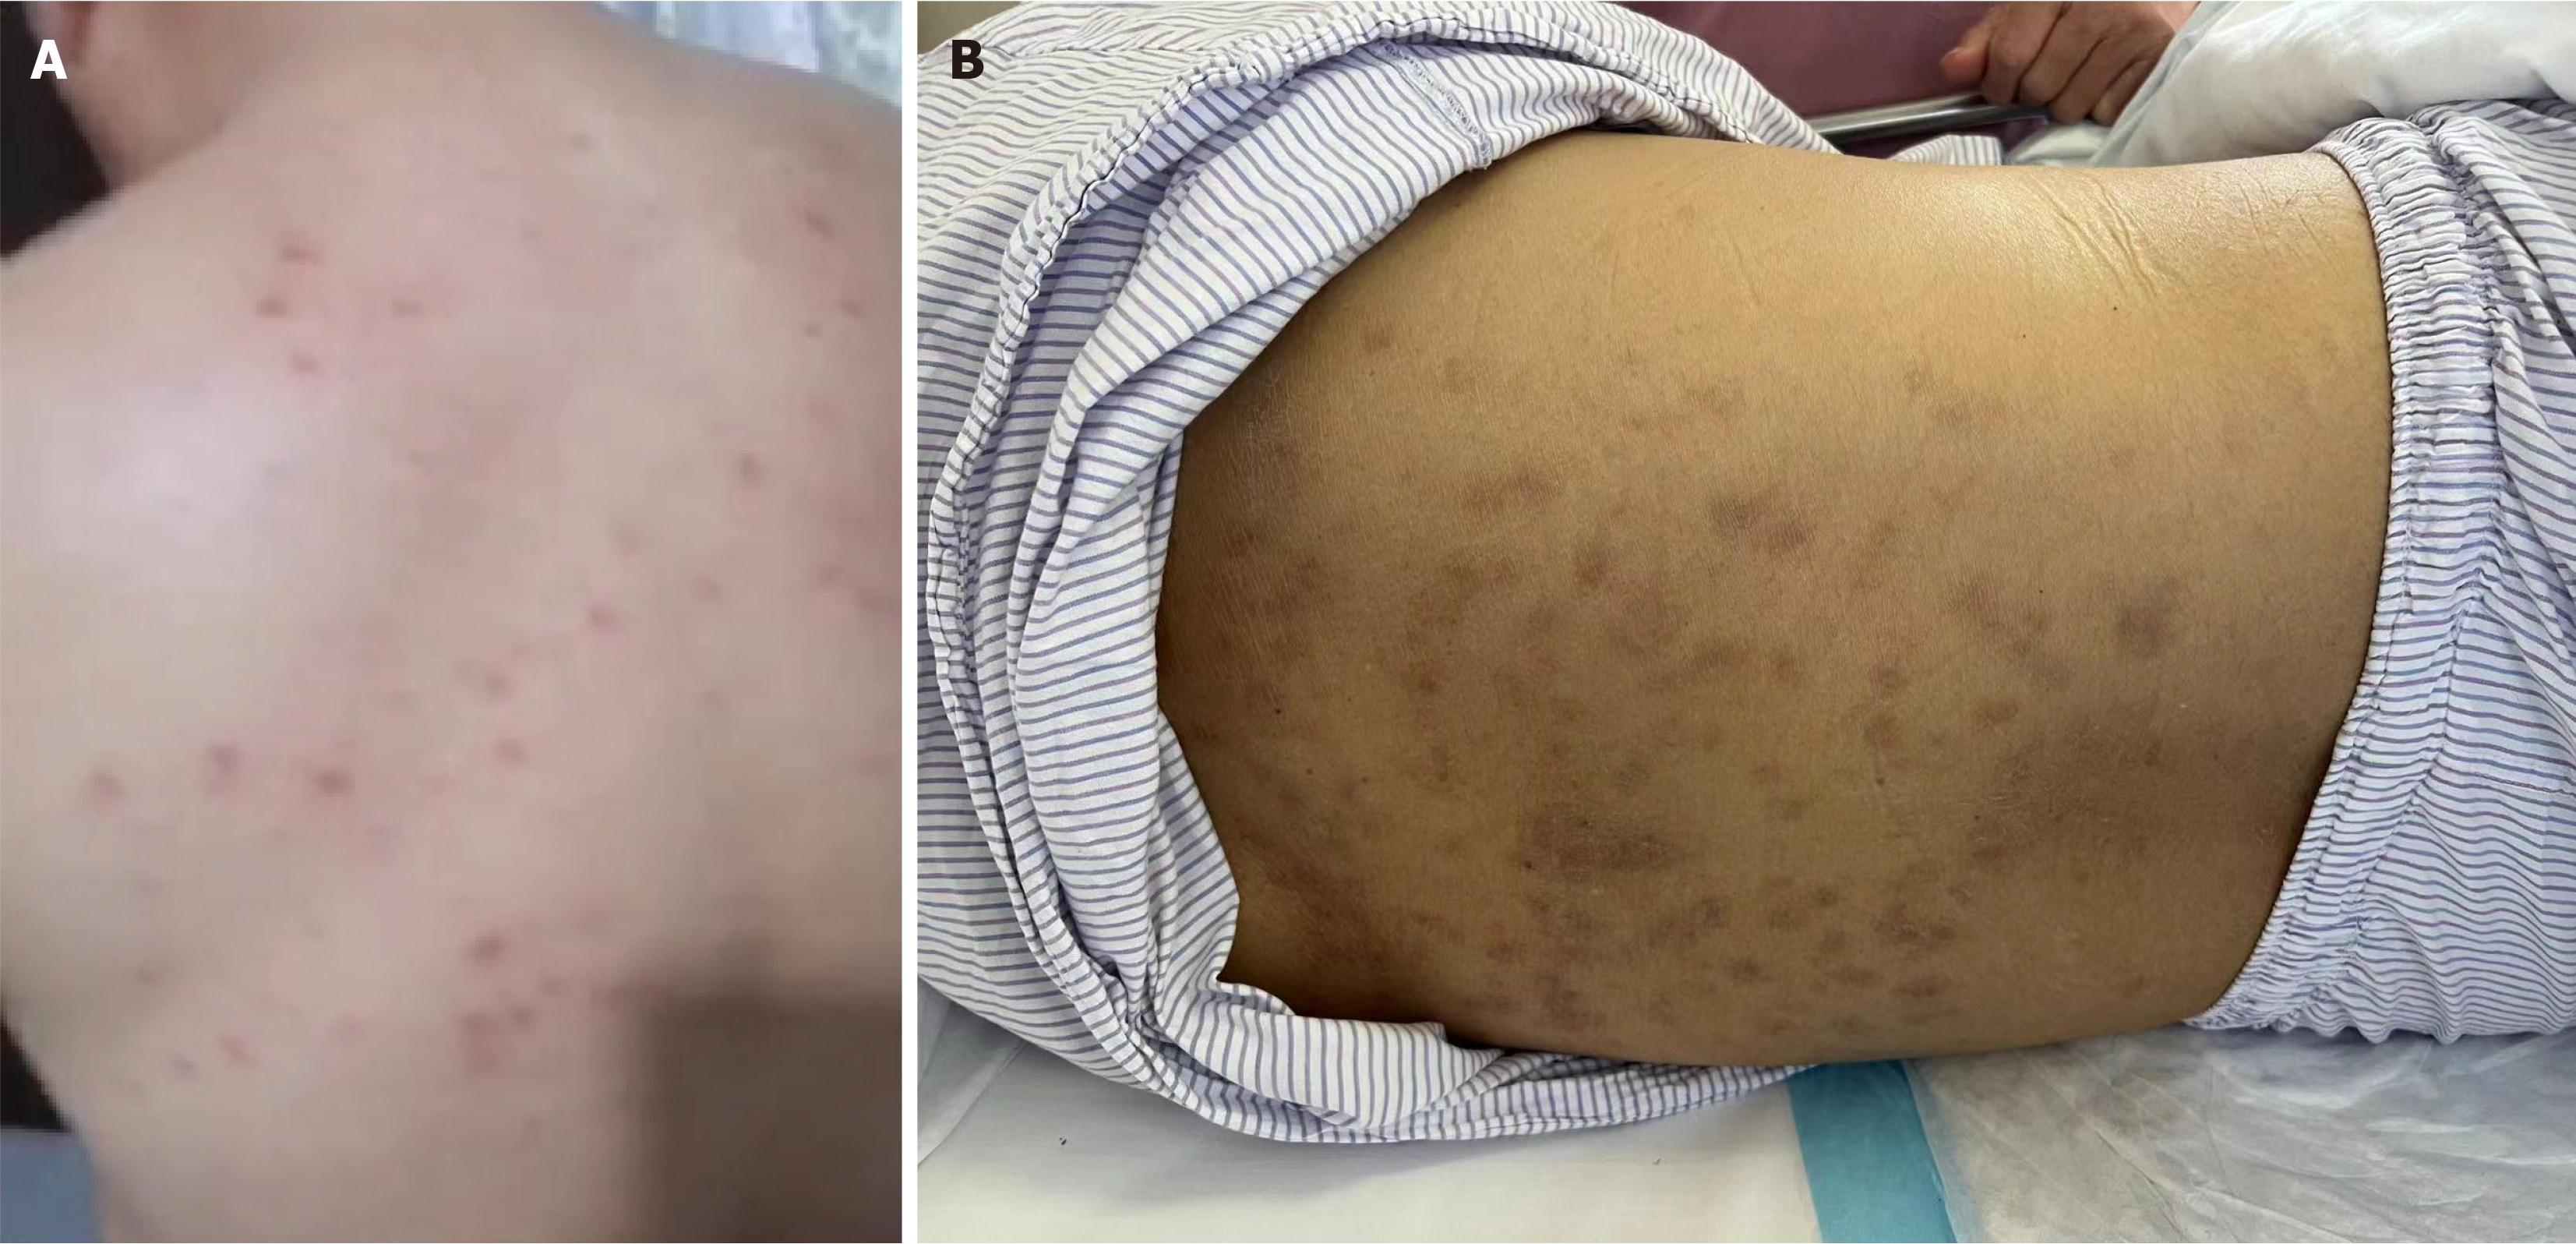
Figure 3 Patients with back rash at different times.
A: Rash on day 2 of complained symptoms; B: Rash on day 12 of the symptoms.
- Citation: Yang N, Liu Z, Jin T, Xin HW, Gu L, Zheng Y, Zhou HX, Li N, Liu XJ. Esophageal ulcer and multisystem inflammatory syndrome after COVID-19: A case report. World J Gastrointest Endosc 2024; 16(8): 483-488
- URL: https://www.wjgnet.com/1948-5190/full/v16/i8/483.htm
- DOI: https://dx.doi.org/10.4253/wjge.v16.i8.483


