Copyright
©The Author(s) 2020.
World J Gastrointest Endosc. May 16, 2020; 12(5): 159-171
Published online May 16, 2020. doi: 10.4253/wjge.v12.i5.159
Published online May 16, 2020. doi: 10.4253/wjge.v12.i5.159
Figure 1 Flow chart of assessment of studies identified in the network meta-analysis.
IBD: Inflammatory bowel disease; UC: Ulcerative colitis.
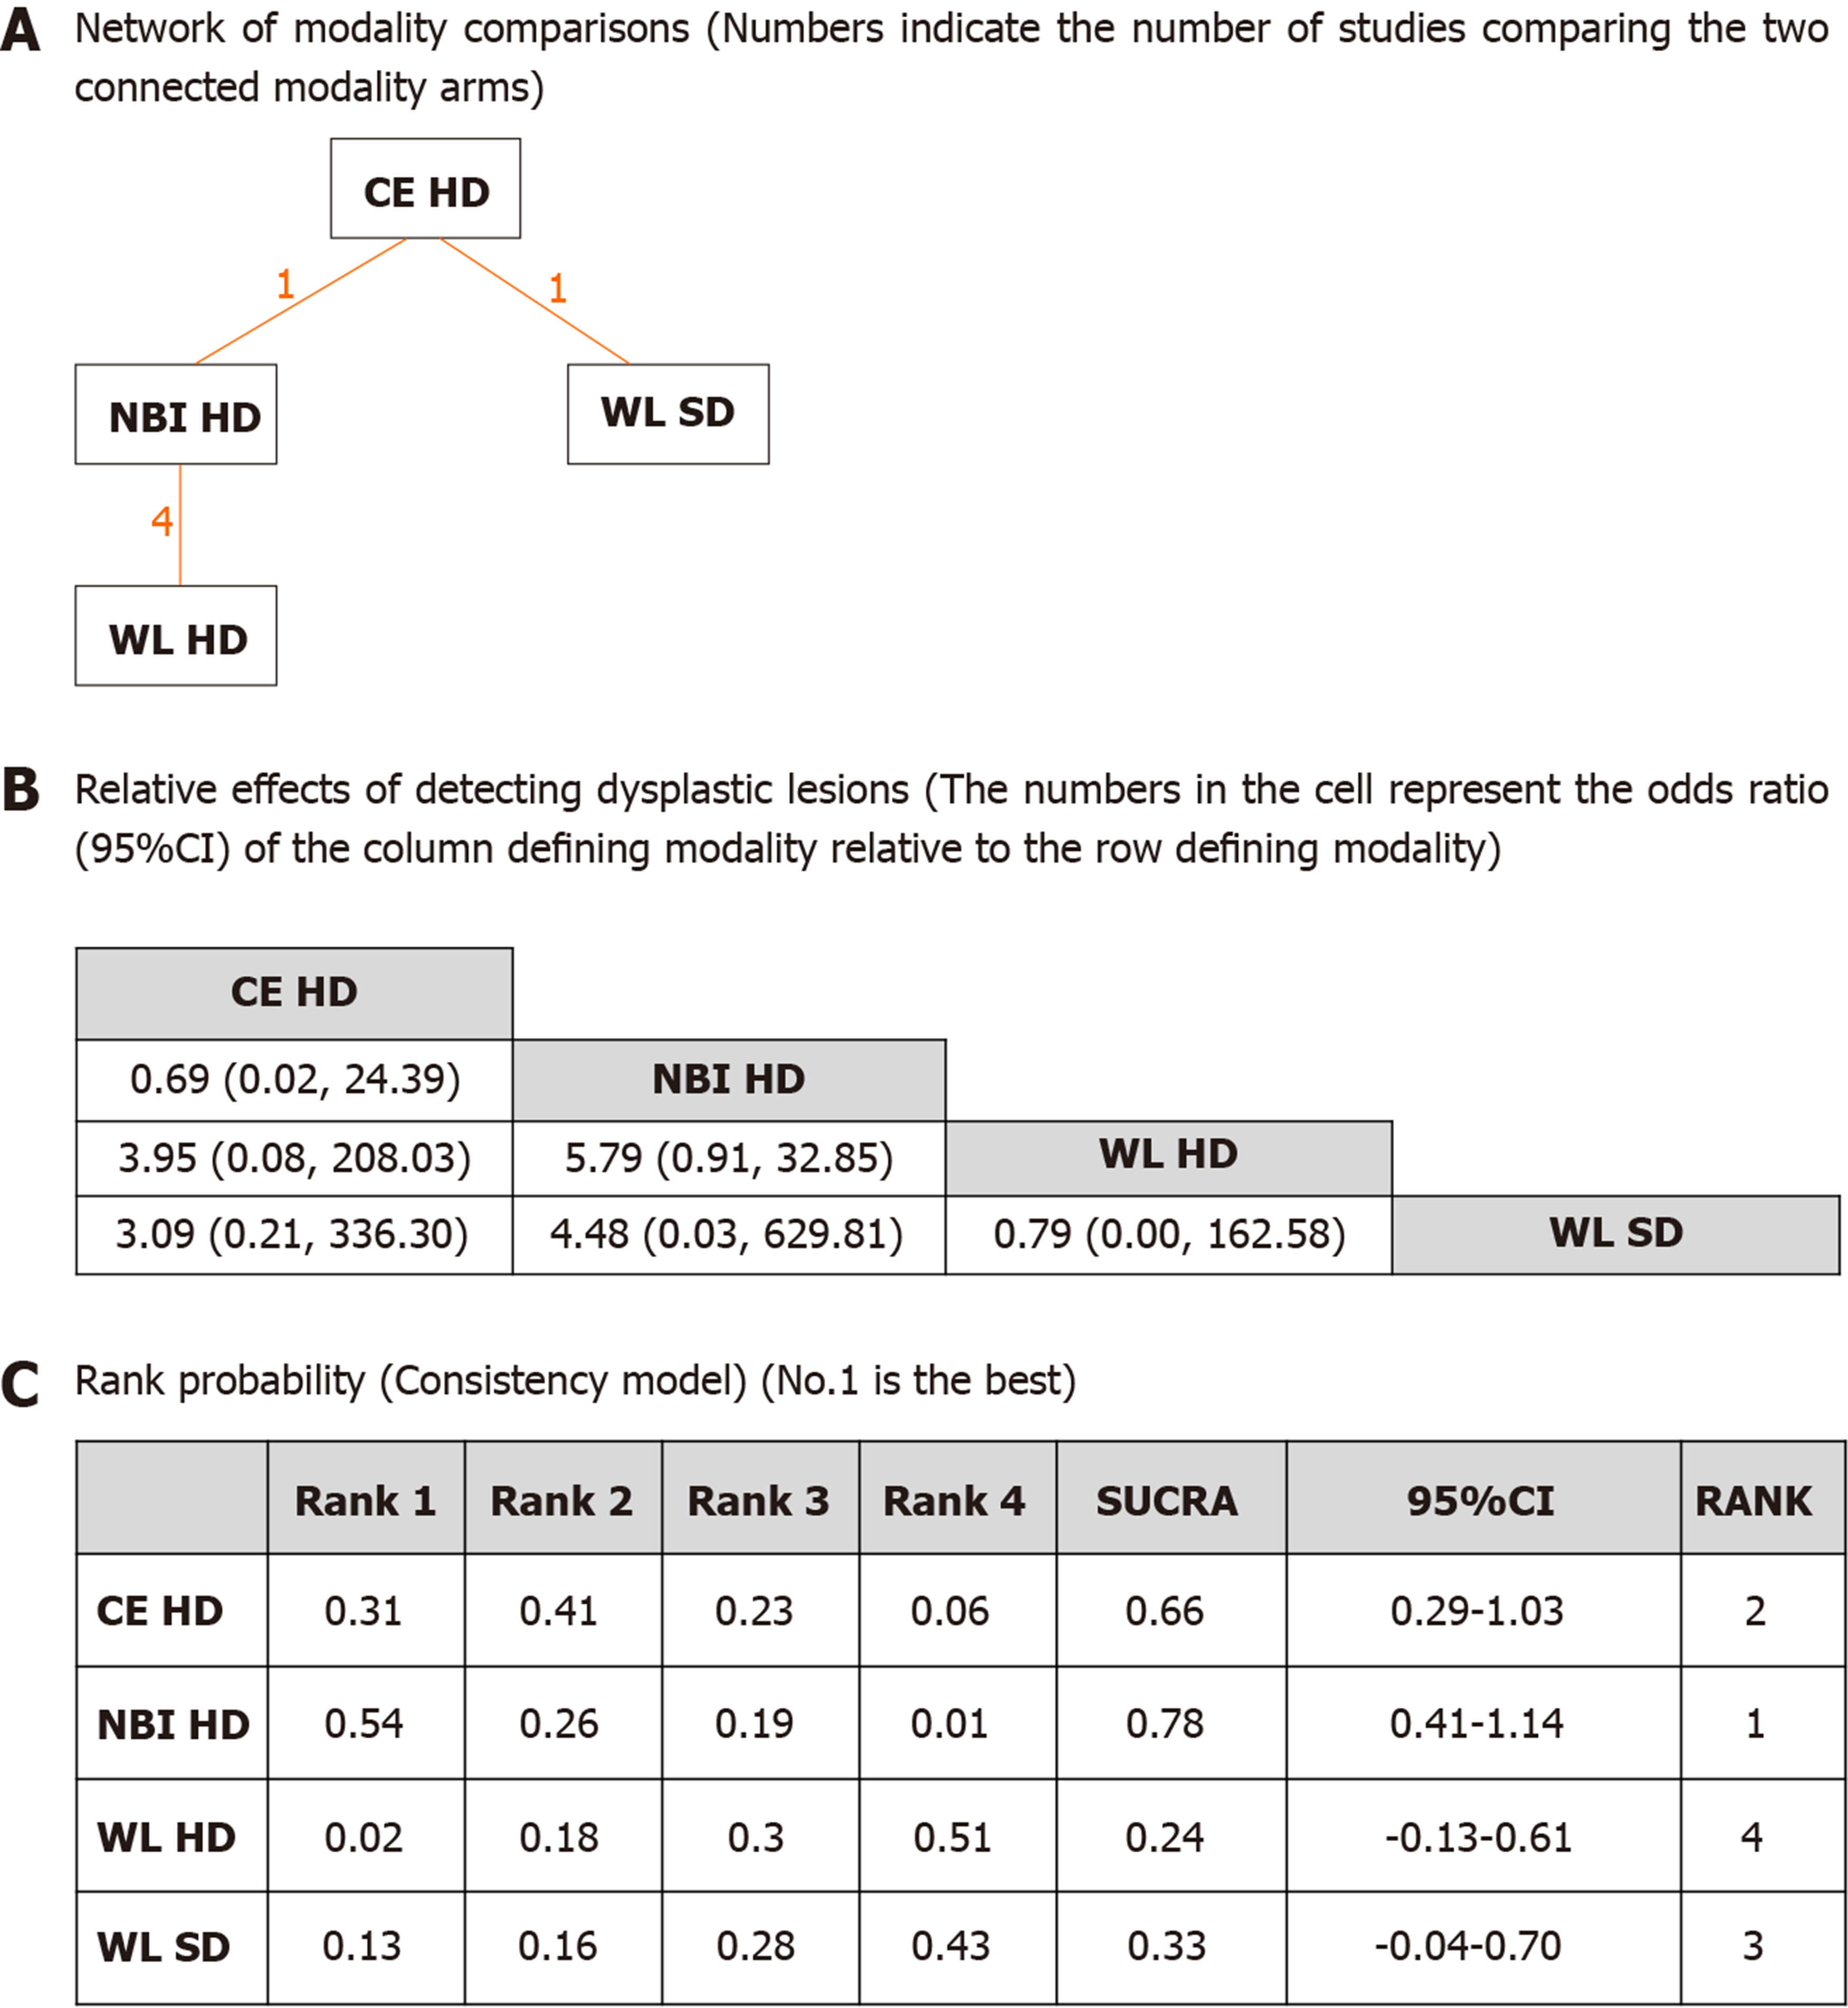
Figure 2 Network meta-analysis of different endoscopic modalities for dysplasia detection rates per biopsy.
A: Network of modality comparisons. Numbers indicate the number of studies comparing the two connected treatment arms; B: Relative effects of detecting dysplastic lesions. The numbers in the cell represent the odds ratio (95% Confidence Intervals) of the column defining modality relative to the row defining treatment; C: Rank probabilities (Consistency model) for each modality based on dysplasia outcome. Indicated is the possibility of each rank and the overall rank interpreted by surface under the cumulative ranking technique. NBI: Narrow band imaging; CE: Chromoendoscopy; WL: White light; HD: High definition; SD: Standard definition.
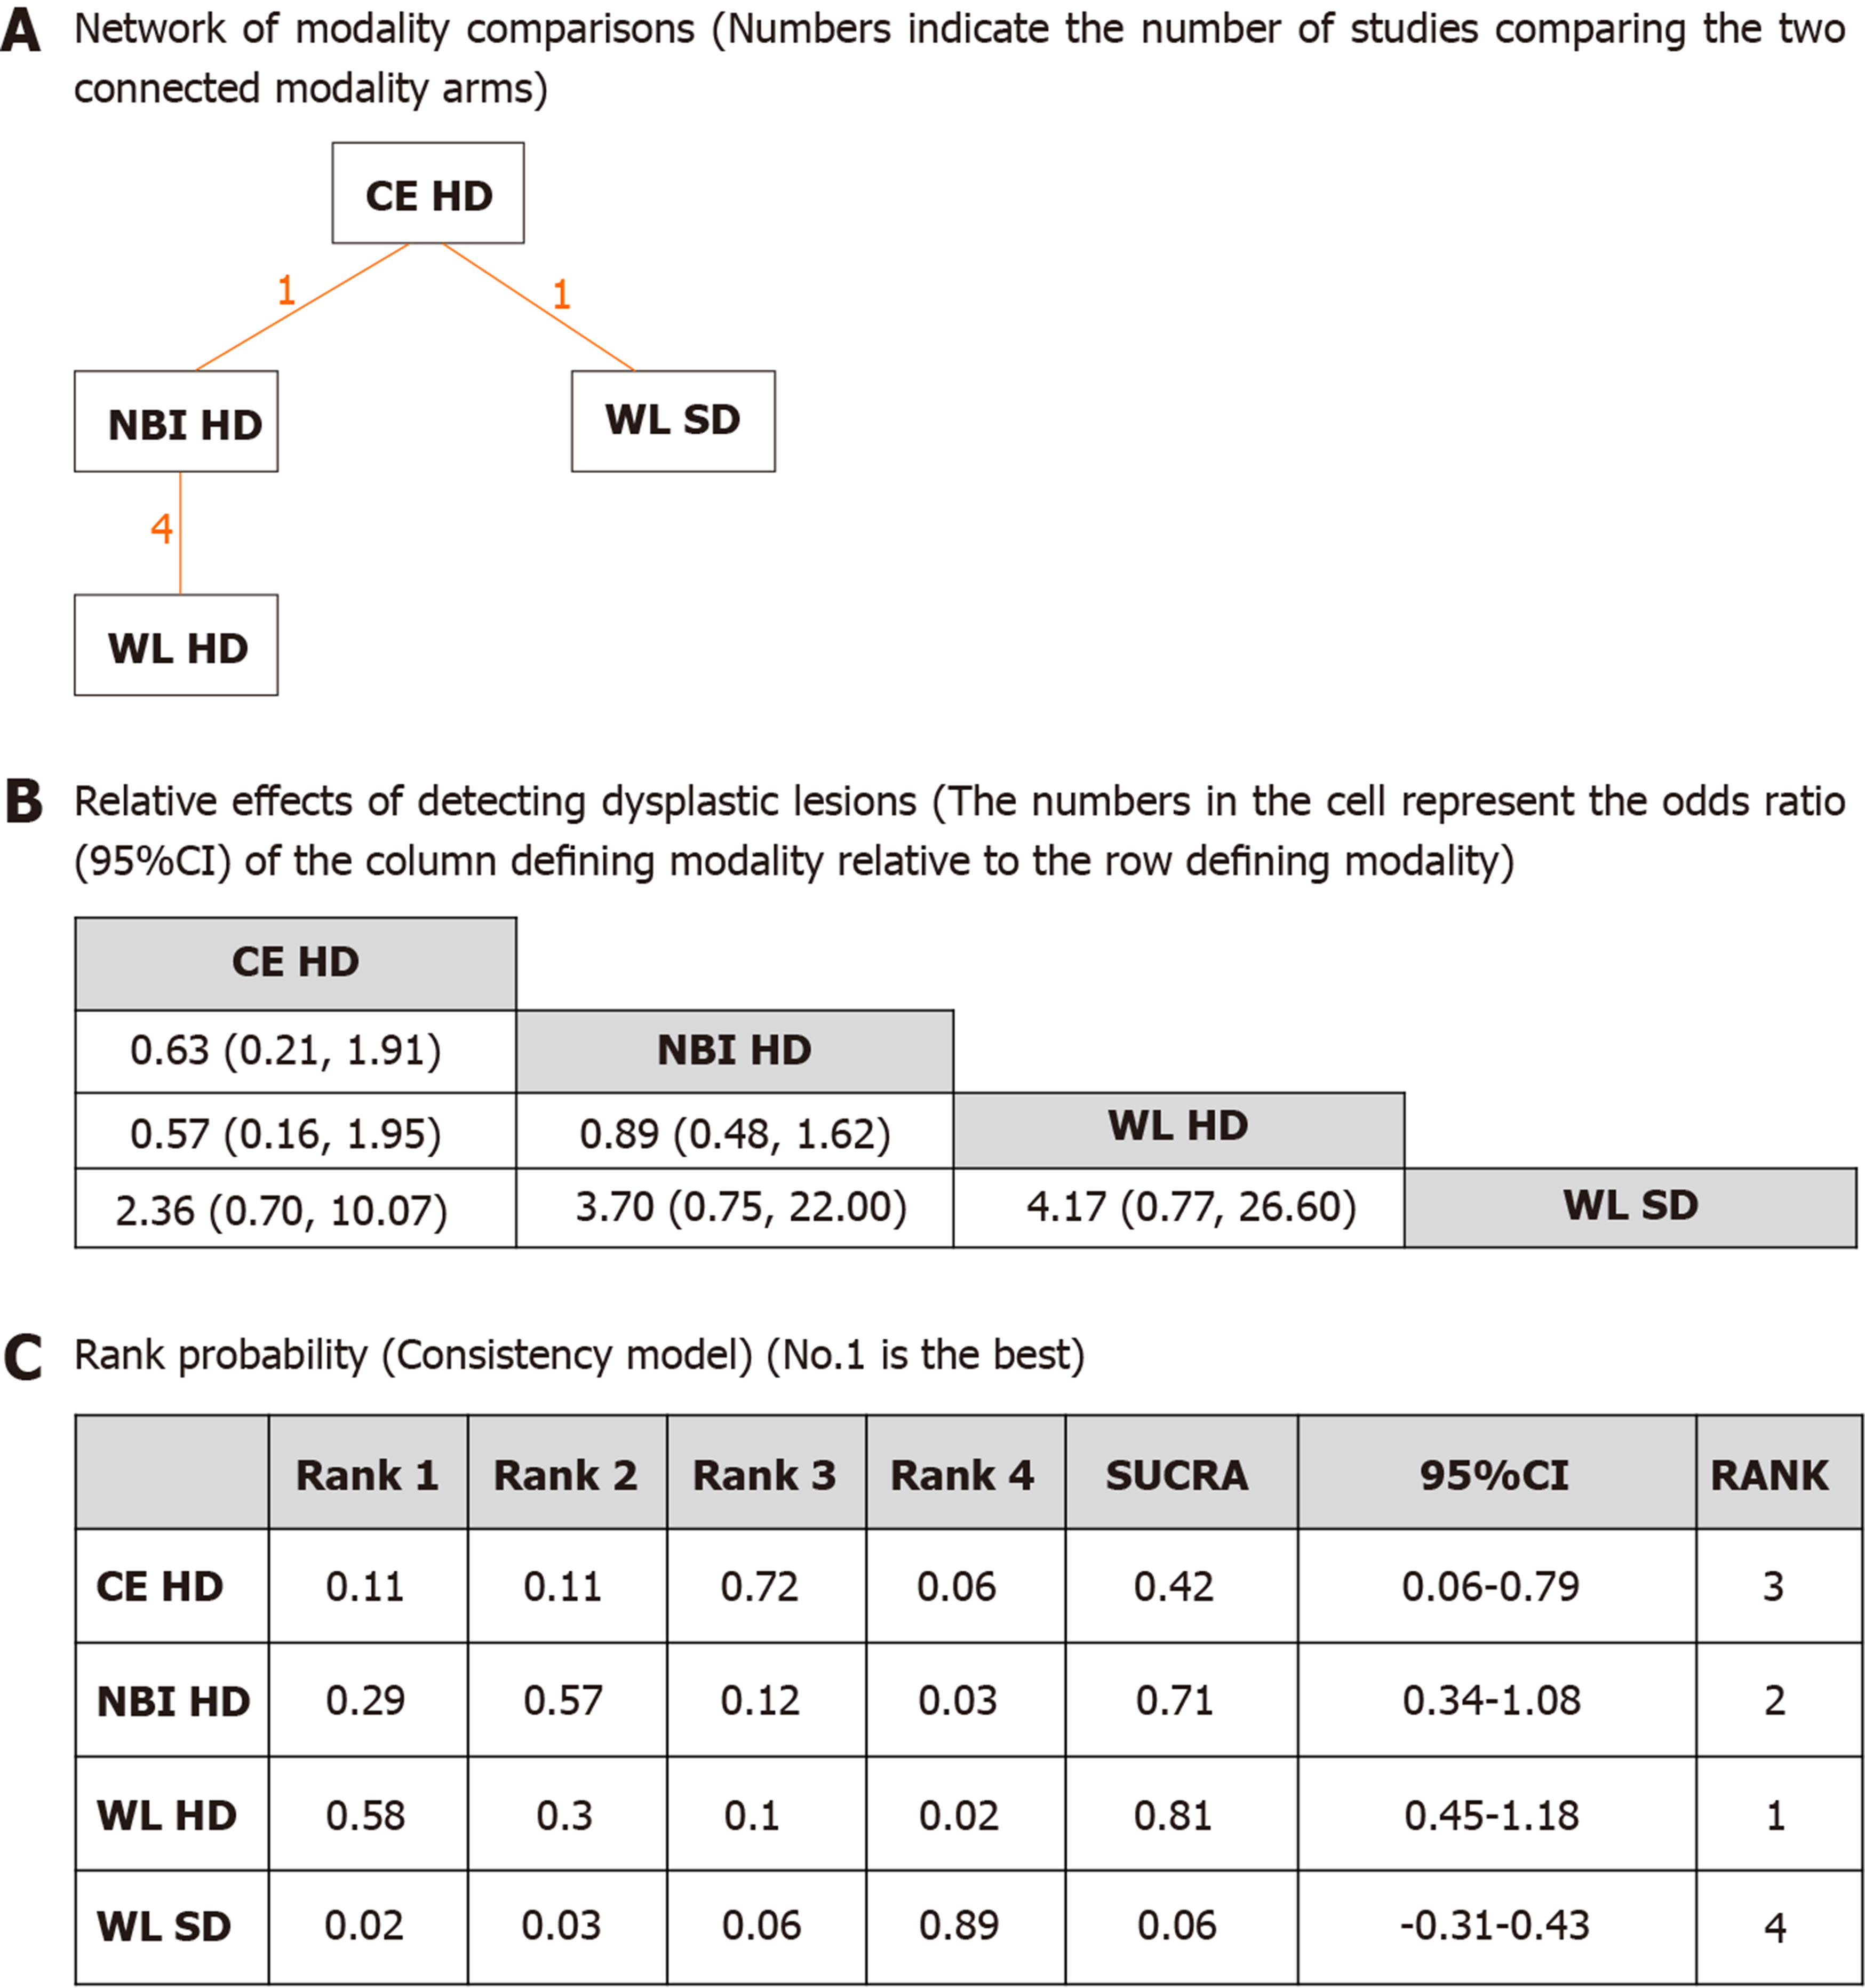
Figure 3 Network meta-analysis of different endoscopic modalities for dysplasia detection rates per patient.
A: Network of modality comparisons. Numbers indicate the number of studies comparing the two connected treatment arms; B: Relative effects of detecting dysplastic lesions. The numbers in the cell represent the odds ratio (95% Confidence Intervals) of the column defining modality relative to the row defining treatment; C: Rank probabilities (Consistency model) for each modality based on dysplasia outcome. Indicated is the possibility of each rank and the overall rank interpreted by surface under the cumulative ranking technique. NBI: Narrow band imaging; CE: Chromoendoscopy; WL: White light; HD: High definition; SD: Standard definition.
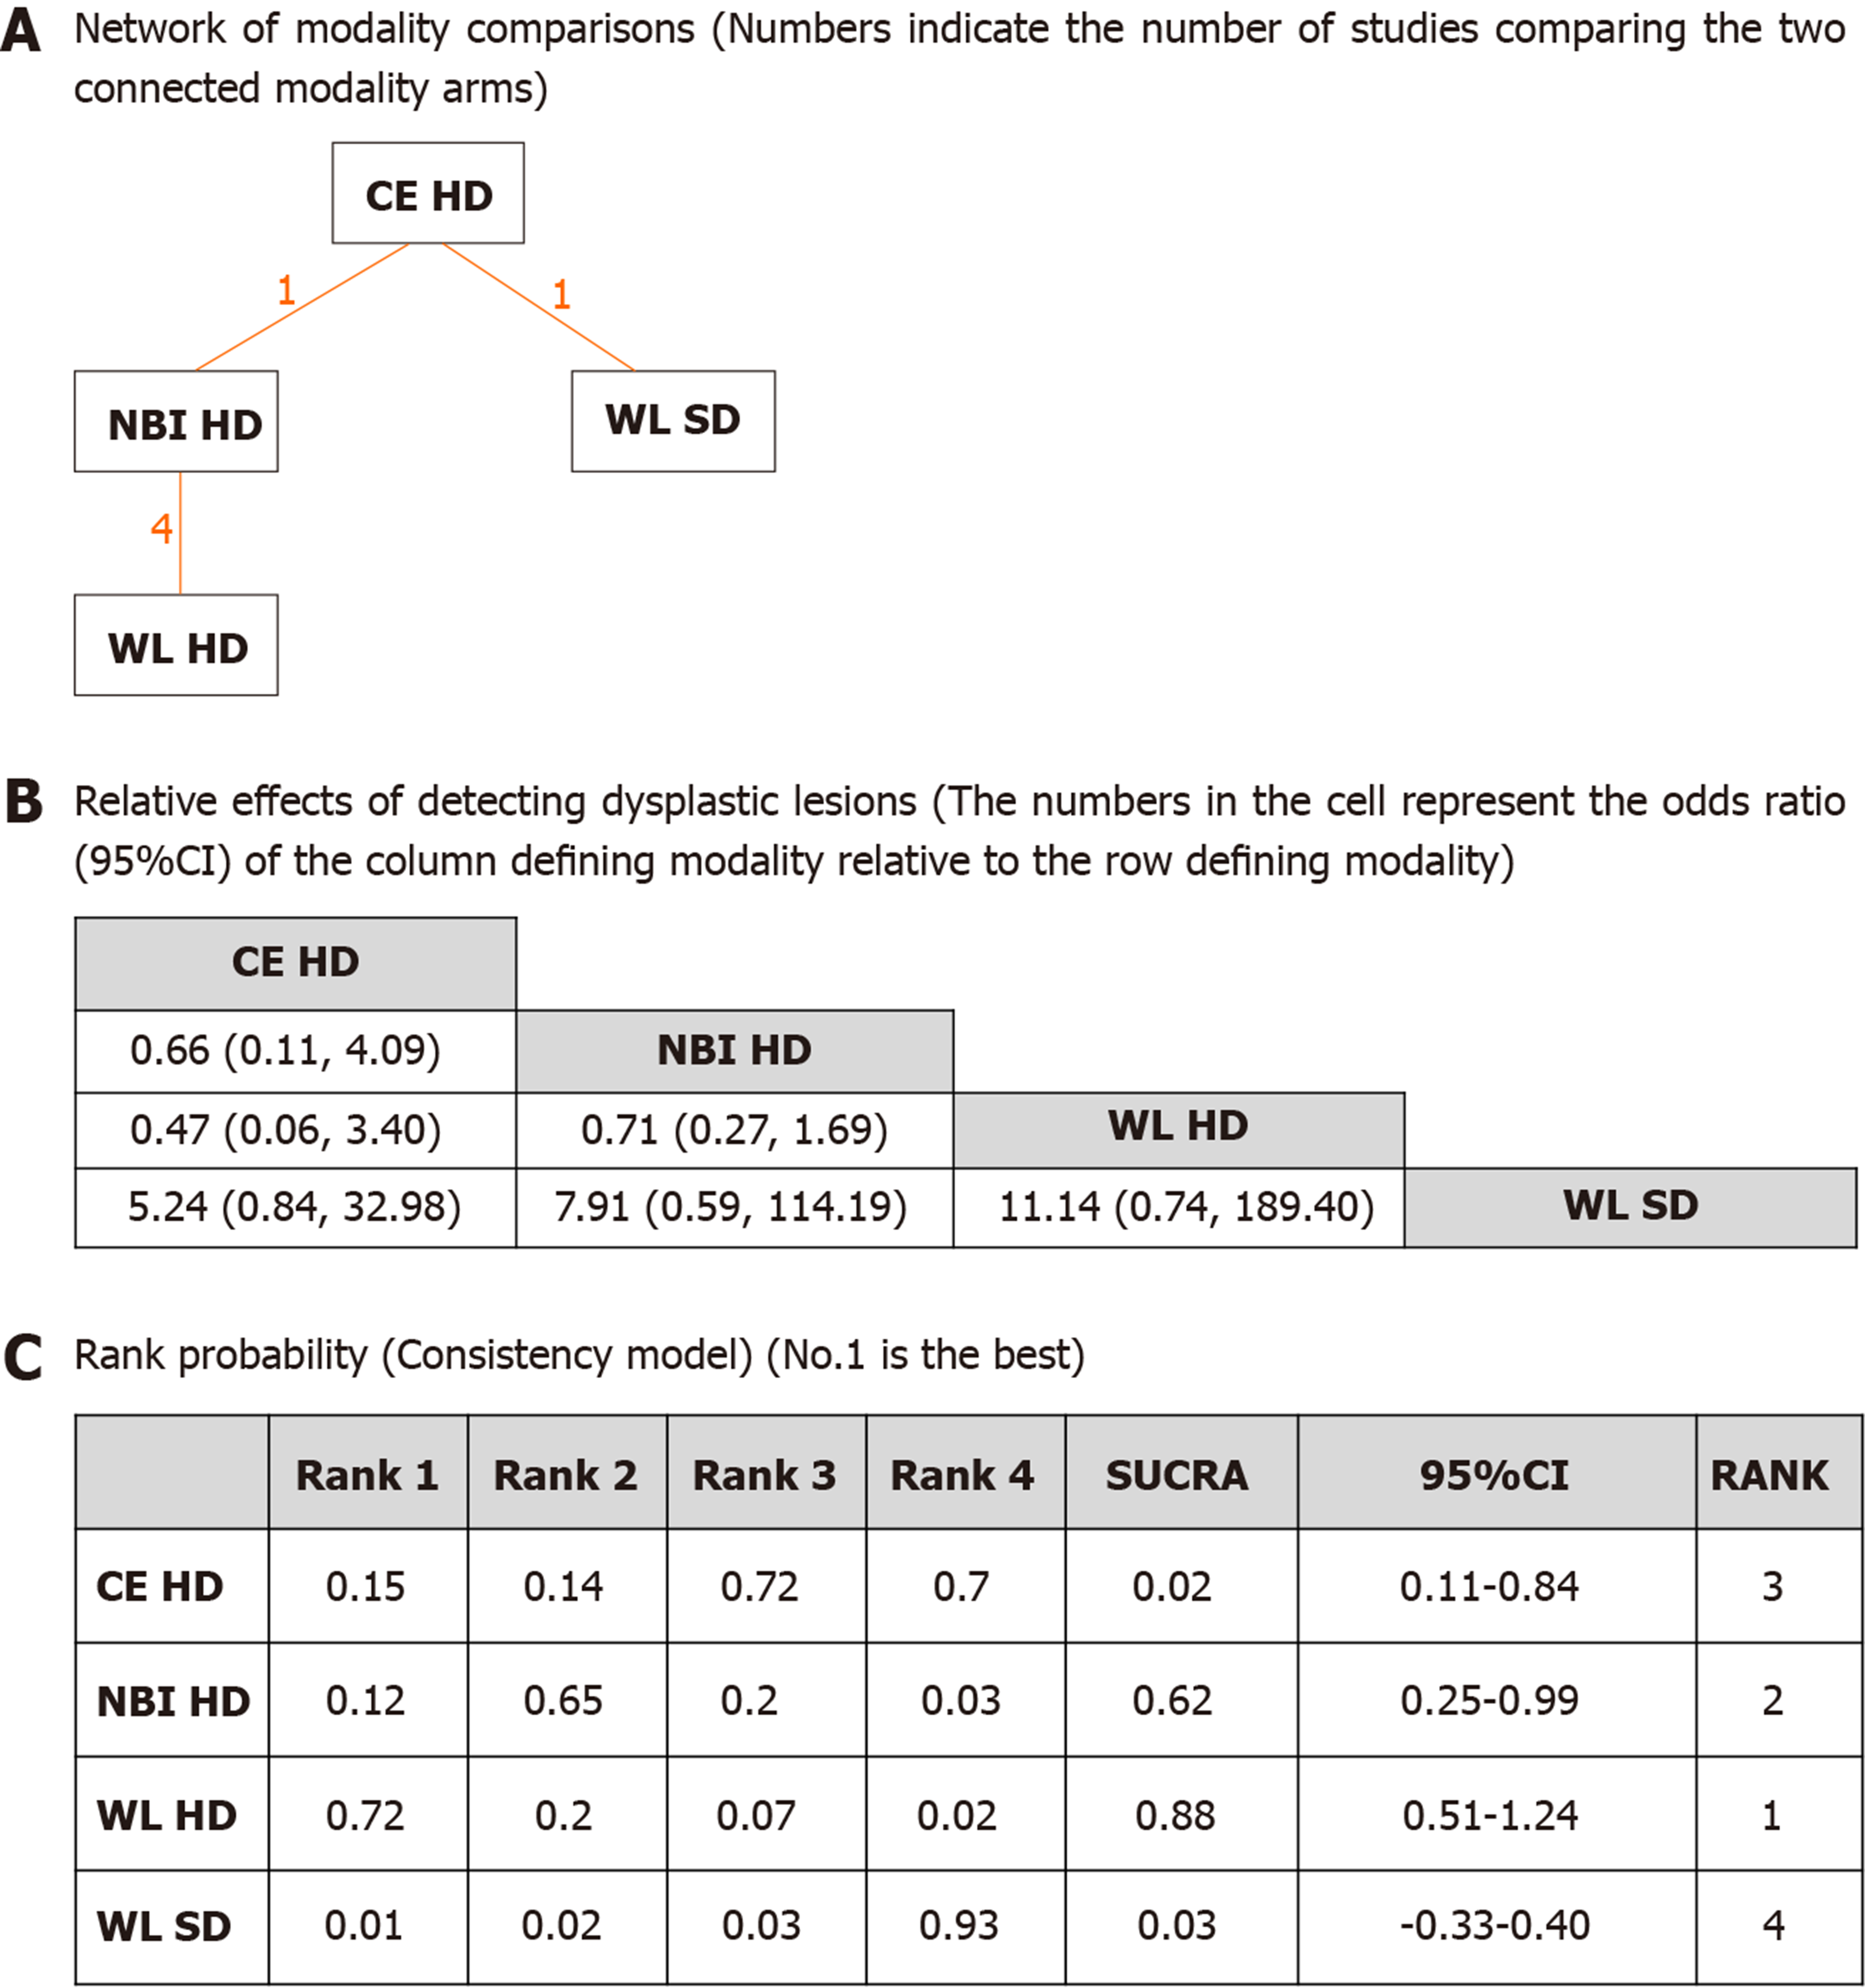
Figure 4 Network meta-analysis of different endoscopic modalities for detected numbers of dysplasia per patient.
A: Network of modality comparisons. Numbers indicate the number of studies comparing the two connected treatment arms; B: Relative effects of detecting dysplastic lesions. The numbers in the cell represent the odds ratio (95% Confidence Intervals) of the column defining modality relative to the row defining treatment; C: Rank probabilities (Consistency model) for each modality based on dysplasia outcome. Indicated is the possibility of each rank and the overall rank interpreted by surface under the cumulative ranking technique. NBI: Narrow band imaging; CE: Chromoendoscopy; WL: White light; HD: High definition; SD: Standard definition.
- Citation: Gondal B, Haider H, Komaki Y, Komaki F, Micic D, Rubin DT, Sakuraba A. Efficacy of various endoscopic modalities in detecting dysplasia in ulcerative colitis: A systematic review and network meta-analysis. World J Gastrointest Endosc 2020; 12(5): 159-171
- URL: https://www.wjgnet.com/1948-5190/full/v12/i5/159.htm
- DOI: https://dx.doi.org/10.4253/wjge.v12.i5.159


