Copyright
©The Author(s) 2020.
World J Gastrointest Endosc. Oct 16, 2020; 12(10): 378-387
Published online Oct 16, 2020. doi: 10.4253/wjge.v12.i10.378
Published online Oct 16, 2020. doi: 10.4253/wjge.v12.i10.378
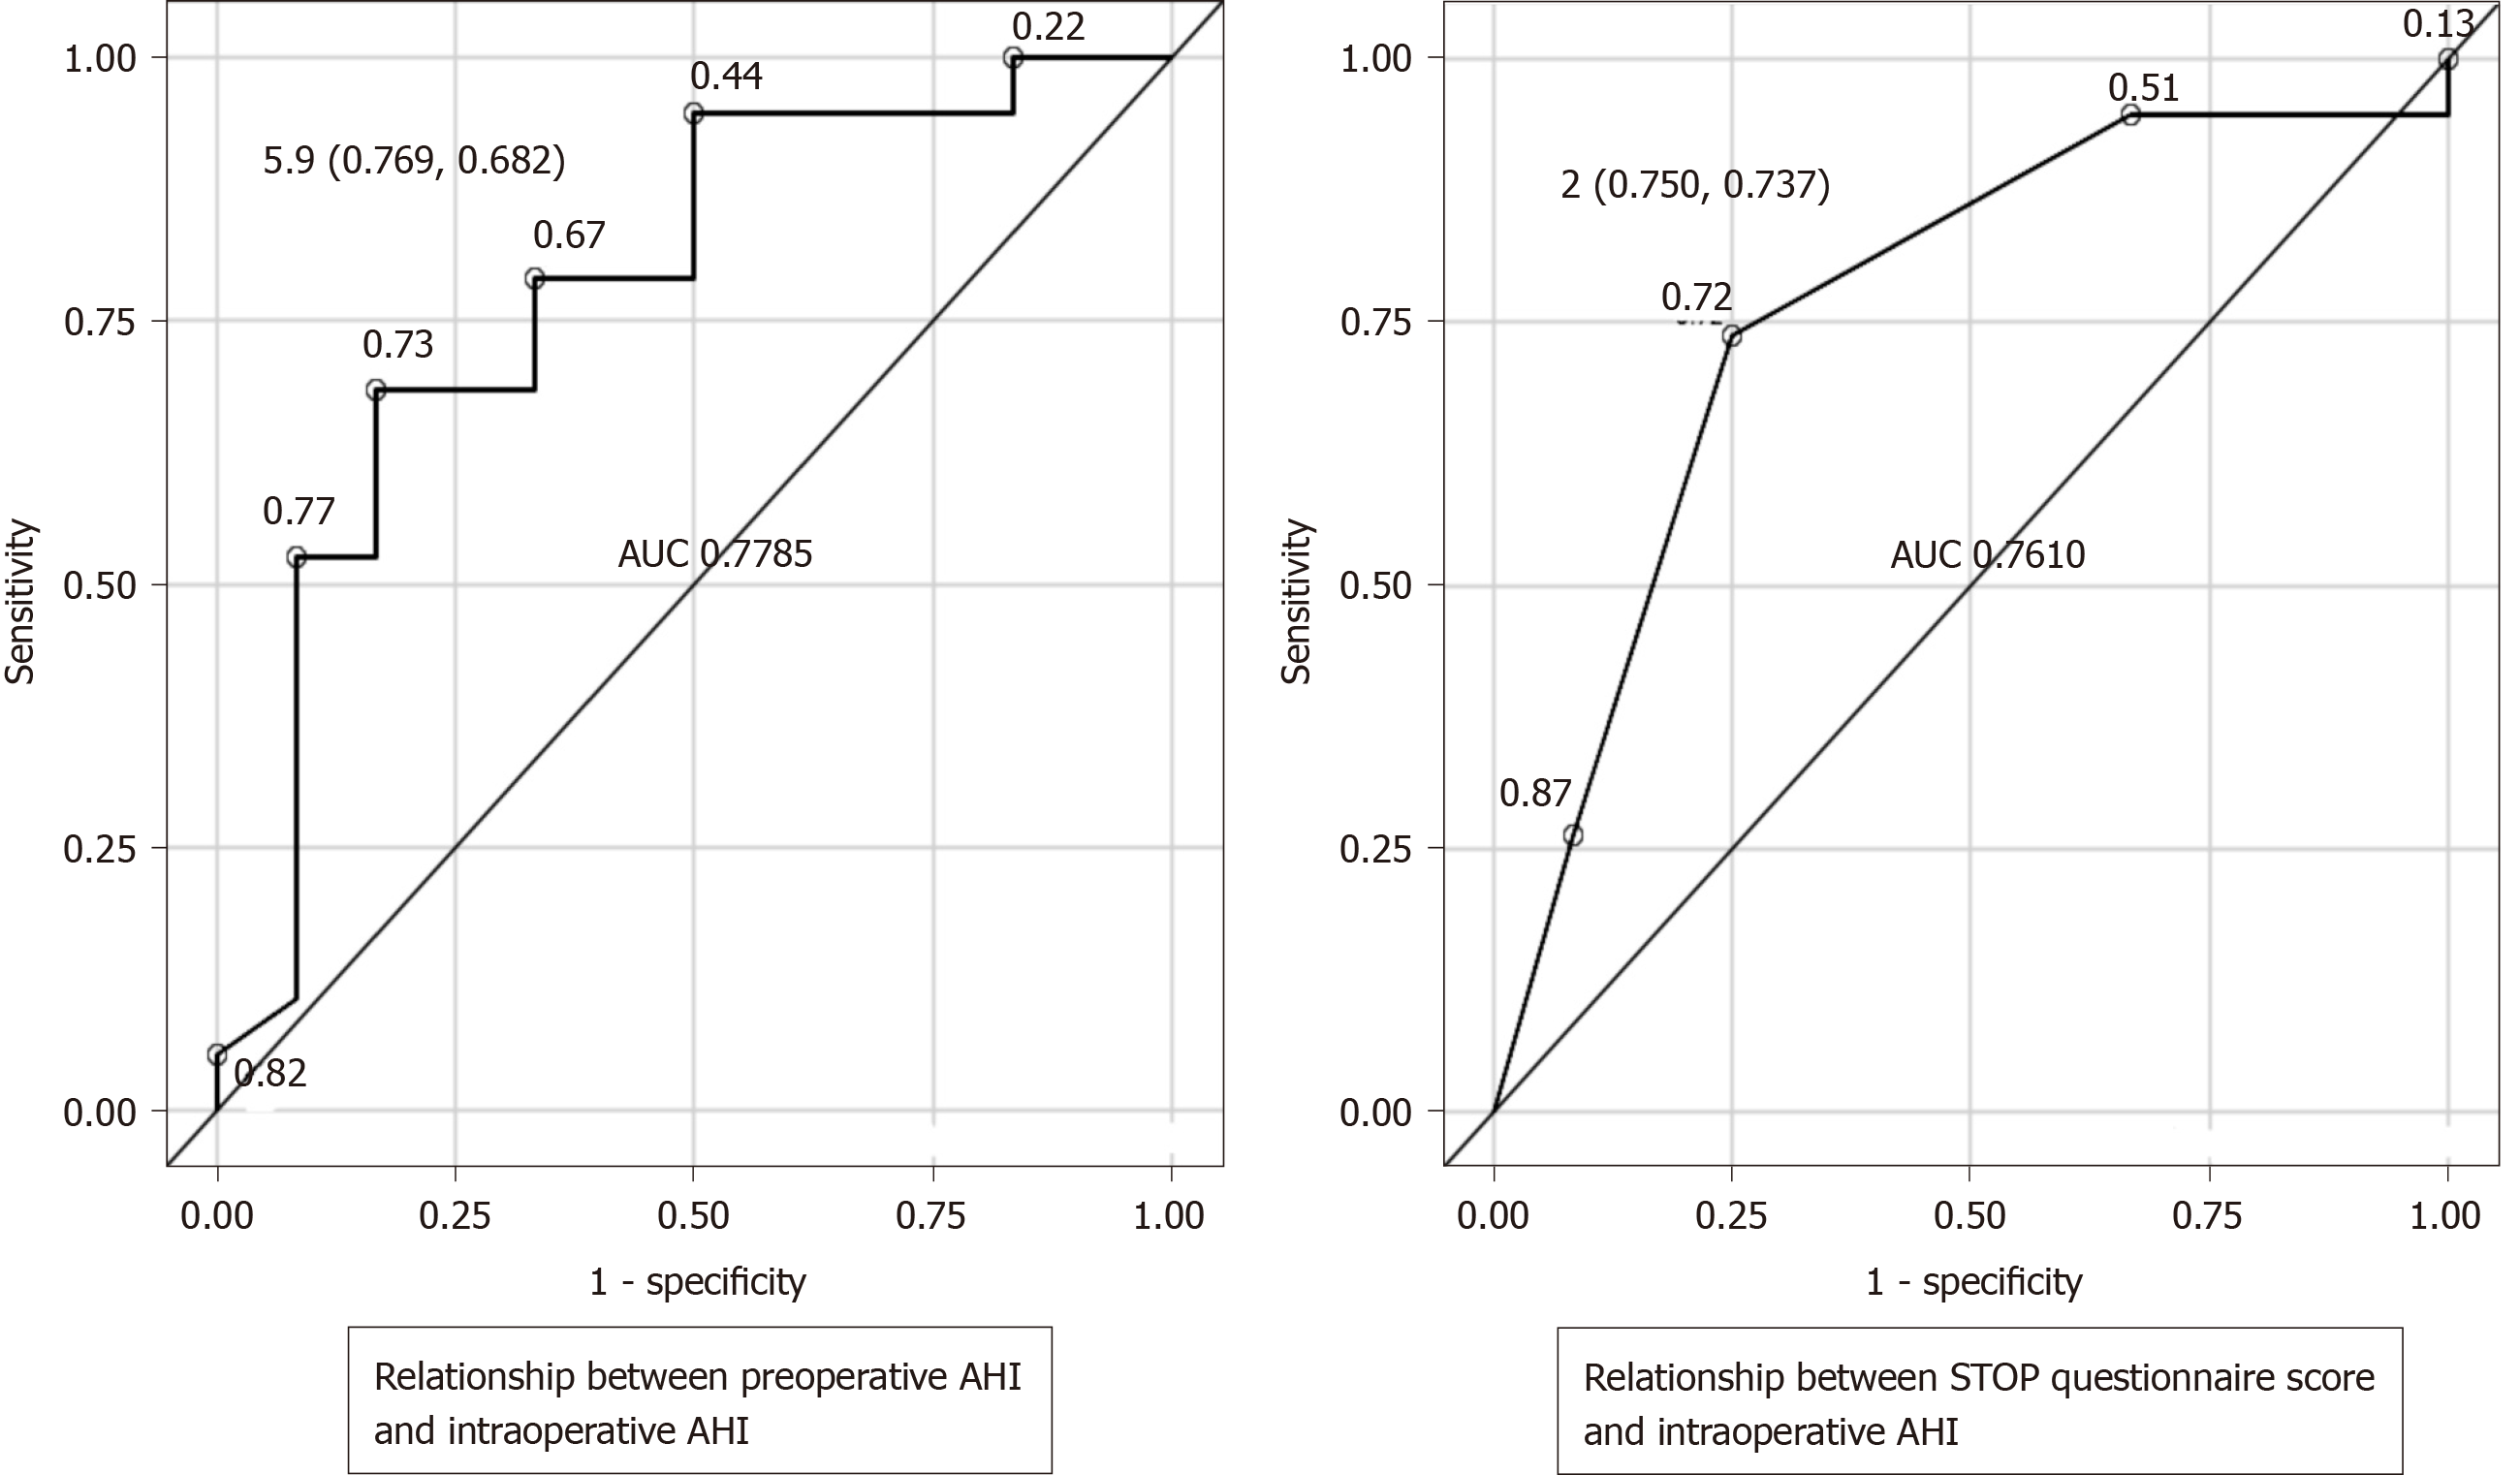
Figure 1 Receiver operating characteristic curves.
When the intraoperative apnea-hypopnea index (AHI) outcome was < 30 and ≥ 15 (sleep apnea syndrome: Moderate criteria), if a preoperative AHI of 5.9 is taken as the cutoff value, the sensitivity is 76.9% and the specificity is 68.2%. Similarly, for a STOP questionnaire score of 2 used as the cutoff value, the sensitivity was 75% and the specificity was 73.7%. Preoperative AHI showed an area under the curve of 0.778 and the STOP questionnaire score showed a nearly equivalent area under the curve of 0.761; the difference was not statistically significant (P = 0.8921). AUC: Area under the curve.
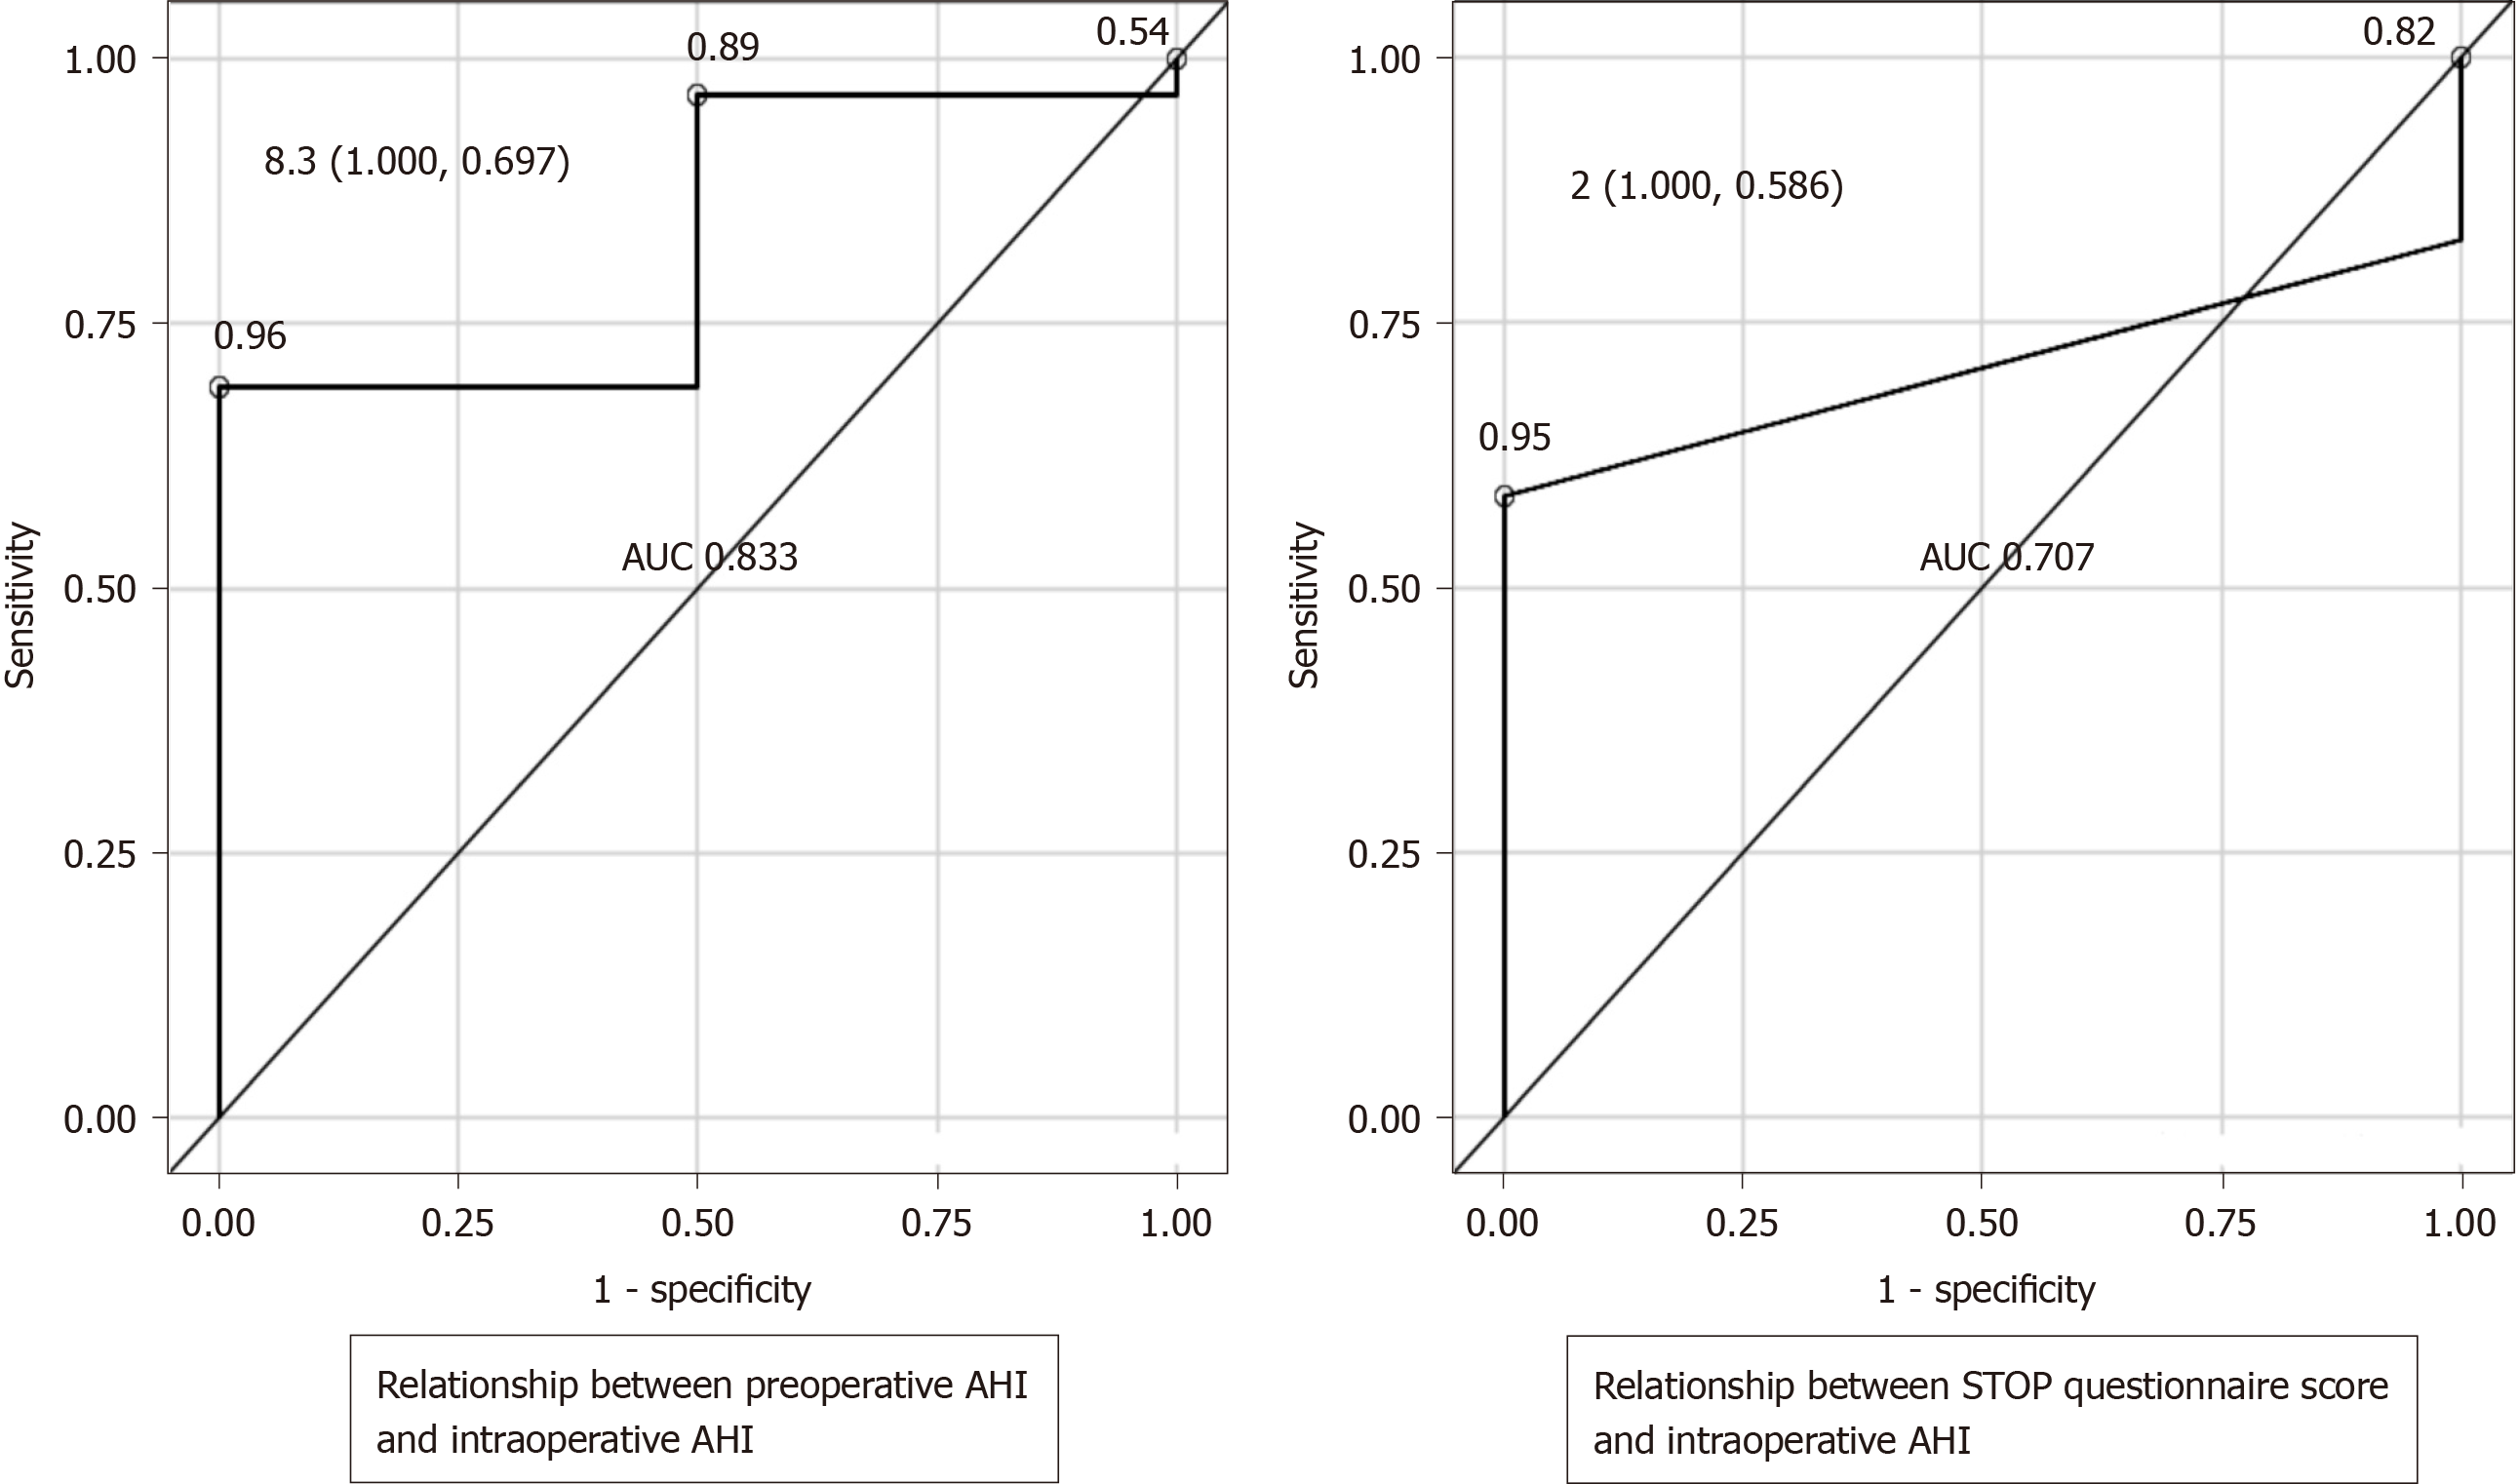
Figure 2 Receiver operating characteristic curves.
When the intraoperative apnea-hypopnea index (AHI) outcome was ≥ 30 (sleep apnea syndrome: Severe criteria) and if a preoperative AHI of 8.3 was taken as the cutoff value, the sensitivity was 100% and the specificity was 69.7%. Similarly, for a STOP questionnaire score of 2 used as the cutoff value, the sensitivity was 100% and the specificity was 58.6%. Preoperative AHI showed an area under the curve of 0.833 and the STOP questionnaire score showed an area under the curve of 0.707. Preoperative AHI showed higher estimates and the diagnostic ability was greater; however, the difference was not statistically significant (P = 0.4450). AUC: Area under the curve.
- Citation: Aikawa M, Uesato M, Urahama R, Hayano K, Kunii R, Kawasaki Y, Isono S, Matsubara H. Predictor of respiratory disturbances during gastric endoscopic submucosal dissection under deep sedation. World J Gastrointest Endosc 2020; 12(10): 378-387
- URL: https://www.wjgnet.com/1948-5190/full/v12/i10/378.htm
- DOI: https://dx.doi.org/10.4253/wjge.v12.i10.378


