Copyright
©The Author(s) 2023.
World J Hepatol. Sep 27, 2023; 15(9): 1060-1083
Published online Sep 27, 2023. doi: 10.4254/wjh.v15.i9.1060
Published online Sep 27, 2023. doi: 10.4254/wjh.v15.i9.1060
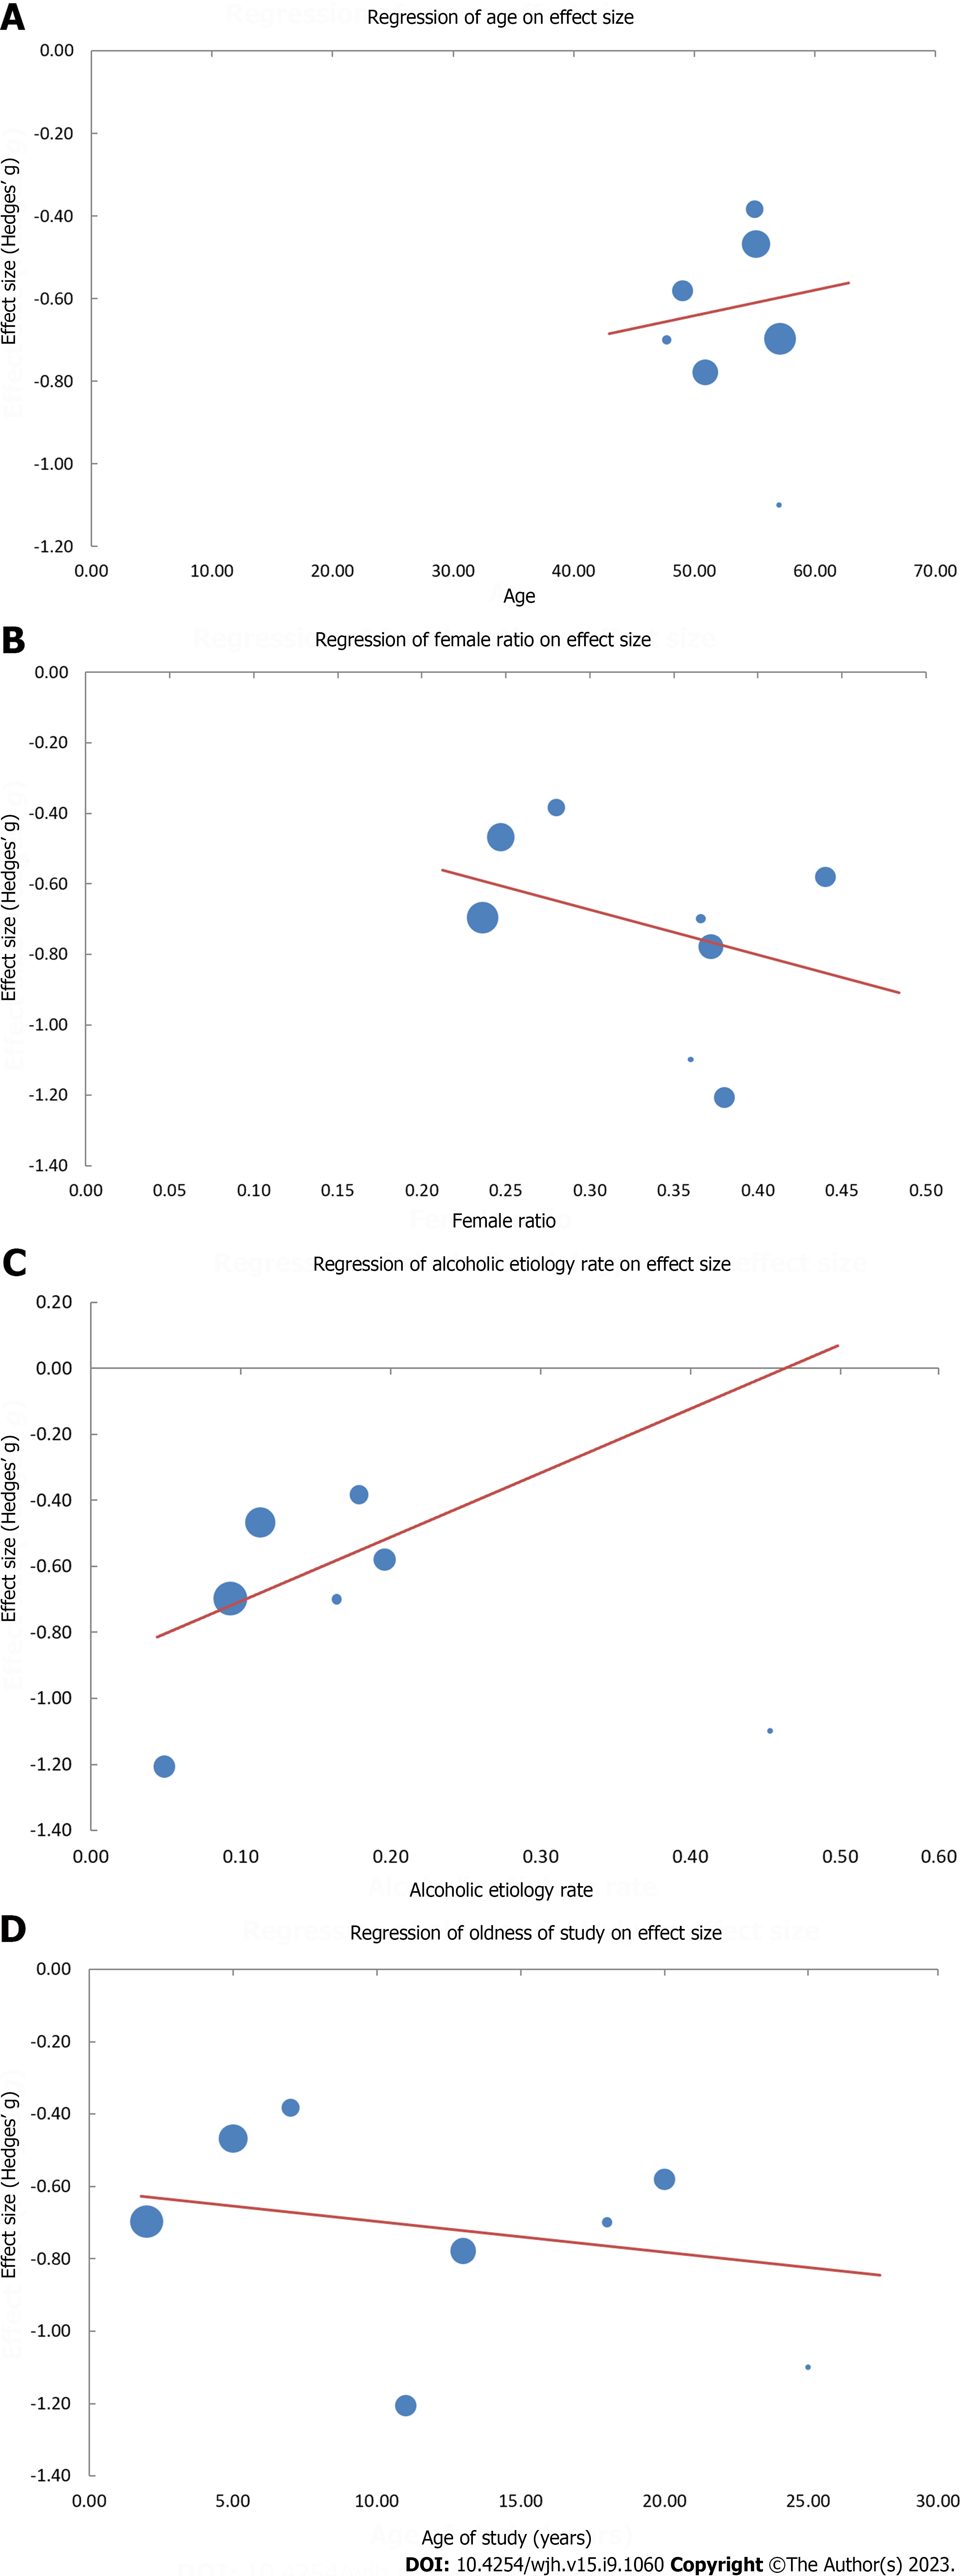
Figure 8 Plot points and regression lines on effect size, namely Hedges’ g, reflecting correlations of pre-transplantation vs post-transplantation corrected QT.
A: Age [Hg = -0.95 + 0.01 (yr); P = 0.417]; B: Female ratio [Hg = -0.29 - 1.28 (female ratio); P < 0.001]; C: Alcoholic etiology rate [Hg = -0.90 - 1.95 (alcoholic etiology rate); P < 0.001]; D: Age of study [Hg = -0.61 - 0.01 (age of study); P = 0.019]. Hg refers to Hedges’g.
- Citation: Papadopoulos VP, Mimidis K. Corrected QT interval in cirrhosis: A systematic review and meta-analysis. World J Hepatol 2023; 15(9): 1060-1083
- URL: https://www.wjgnet.com/1948-5182/full/v15/i9/1060.htm
- DOI: https://dx.doi.org/10.4254/wjh.v15.i9.1060


