Published online Feb 27, 2021. doi: 10.4254/wjh.v13.i2.187
Peer-review started: August 26, 2020
First decision: October 21, 2020
Revised: November 4, 2020
Accepted: December 30, 2020
Article in press: December 30, 2020
Published online: February 27, 2021
Processing time: 182 Days and 5.2 Hours
Liver fibrosis can result in end-stage liver failure and death.
To examine human liver fibrogenesis and anti-fibrotic therapies, we evaluated the three dimensional ex vivo liver slice (LS) model.
Fibrotic liver samples (F0 to F4 fibrosis stage according to the METAVIR score) were collected from patients after liver resection. Human liver slices (HLS) were cultivated for up to 21 days. Hepatitis C virus (HCV) infection, alcohol (ethanol stimulation) and steatosis (palmitate stimulation) were examined in fibrotic (F2 to F4) liver slices infected (or not) with HCV. F0-F1 HLS were used as controls. At day 0, either ursodeoxycholic acid (choleretic and hepatoprotective properties) and/or α-tocopherol (antioxidant properties) were added to standard of care on HLS and fibrotic liver slices, infected (or not) with HCV. Expression of the biomarkers of fibrosis and the triglyceride production were checked by quantitative reverse transcription polymerase chain reaction and/or enzyme-linked immunosorbent assay.
The cultures were viable in vitro for 21 days allowing to study fibrosis inducers and to estimate the effect of anti-fibrotic drugs. Expression of the biomarkers of fibrosis and the progression to steatosis (estimated by triglycerides production) was increased with the addition of HCV and /or ethanol or palmitate. From day 15 of the follow-up studies, a significant decrease of both transforming growth factor β-1 and Procol1A1 expression and triglycerides production was observed when a combined anti-fibrotic treatment was applied on HCV infected F2-F4 LS cultures.
These results show that the human three dimensional ex vivo model effectively reflects the in vivo processes in damaged human liver (viral, alcoholic, nonalcoholic steatohepatitis liver diseases) and provides the proof of concept that the LS examined model permits a rapid evaluation of new anti-fibrotic therapies when used alone or in combination.
Core Tip: In the developed world, about 45% of deaths are due to fibroproliferative diseases. Liver fibrosis is frequently associated with viral infection (Hepatitis C virus and Hepatitis B virus infection), chronic inflammation and excessive alcohol consumption. Despite the availability of effective antiviral drugs, morbidity, and mortality related to viral hepatitis are still increasing. Moreover, the number of non-viral liver diseases such as nonalcoholic steatohepatitis, and alcoholic liver disease is steadily growing. Our studies provide the proof of concept that the three-dimensional ex vivo model of human liver slice culture can be used for the molecular investigation of fibrosis as well as to perform follow-up studies of new anti-fibrotic drugs and therapies for a 21-days period.
- Citation: Kartasheva-Ebertz D, Gaston J, Lair-Mehiri L, Massault PP, Scatton O, Vaillant JC, Morozov VA, Pol S, Lagaye S. Adult human liver slice cultures: Modelling of liver fibrosis and evaluation of new anti-fibrotic drugs. World J Hepatol 2021; 13(2): 187-217
- URL: https://www.wjgnet.com/1948-5182/full/v13/i2/187.htm
- DOI: https://dx.doi.org/10.4254/wjh.v13.i2.187
Forty five percent of deaths in the developed countries may be attributed to fibroproliferative diseases[1]. Liver fibrosis is frequently associated with viral infection [Hepatitis C virus (HCV) and Hepatitis B virus (HBV)] infection, chronic inflammation, and excessive alcohol consumption. Despite effective antiviral treatment, morbidity and hepatitis-related mortalities are still increasing. Moreover, the number of non-viral liver diseases such as nonalcoholic steatohepatitis (NASH) and alcoholic liver disease (ALD) is steadily growing[2].
Progression to liver fibrosis is a multistep process, whose development time varies. Fibrosis is initiated by the activation of hepatic stellate cells triggered by several signaling pathways[3]. The activation of stellate cells induces cellular matrix production and collagen 1 expression This process is stimulated by transforming growth factor-β1 (TGF-β1), which is a crucial element involved in fibrogenesis[4]. The progression of liver fibrosis frequently results in cirrhosis (liver acini are substituted by regeneration nodules surrounded by fibrosis) and, further on, in the development of hepatocellular carcinoma. Liver fibrosis can persist even with effective treatments. In most cases, the necro-inflammation leading to fibrosis can be effectively treated by treatments with antiviral drugs that target HCV, by nucleoside analogs in patients with HBV, by immune suppression in autoimmune hepatitis, by ethanol weaning and other dietary approaches in ALD and NASH, and iron chelation for hemochromatosis. However, if patients are not treated in a timely manner, and fibrosis progresses to decompensated cirrhosis, the only remaining option is liver transplantation The main obstacles (or delays) to liver transplantation are an insufficient number or a shortage of suitable organs, long waiting lists and high cost of this procedure[5]. Thus, mortality remains high in patients on the waiting list and new anti-fibrotic agents and new clinical strategies to manage patients in the different stages of liver fibrosis are needed.
The liver slices (LS) cultures are appropriate models to study liver fibrosis, because they maintain the complex cellular interactions that occur in vivo, which cannot be obtained in co-cultures systems[6]. These cultures can be used to study molecular biological events either in the fibrotic liver tissue or in hepatocellular carcinoma tissue. Although the LS cultures from non-fibrotic and fibrotic rat livers have been used to investigate the early and late phases as well as the resolution of liver fibrosis[7,8], the experiments are limited to 3 days in the rat model[7-9], and to 15 days in the human non-fibrotic LS model[10]. In previous studies, we developed a three dimensional (3D) ex vivo model of HCV replication using human LS cultures that were followed for 10 days[11] to evaluate a new antiviral drug[12].
Here, for the first time, human fibrotic LS cultures (stages F2-F4) were successfully maintained and evaluated for 21 days. Using the ex vivo LS model for a 21-d period makes it possible to explore molecular fibrogenesis in more detail including the role of important factors such as HCV infection, ethanol (EtOH), or steatosis. Thus, this model can improve the understanding of the three of the main causes of liver injury in clinical practice[2]. In addition, it was demonstrated that LS cultures are efficient instruments to study anti-fibrotic drugs and their combination[13,14].
This study provides the proof of concept that the ex vivo model of human LS culture can be used for the molecular evaluation of fibrosis and to perform follow-up studies of new anti-fibrotic drugs and therapies for a 21-days period.
Adult human liver tissue samples were obtained from selected patients with different liver pathologies, as previously described[11,12]. Written informed consent was obtained from each patient included in the study and the study protocol conforms to the ethical guidelines of the 1975 Declaration of Helsinki as reflected in a priori approval by the institution's human research committee. Experimental procedures were carried out in accordance with French laws and Regulations and ethic committees from Pitié-Salpétrière Hospital, Cochin Hospital, and Pasteur Institute (France). The tissue samples from twenty patients were divided into three groups according to their METAVIR score[15]. Liver samples were either non-fibrotic F0-F1, obtained during surgery for colorectal cancer liver metastases or fibrotic ranging from F2 to F4 according to the METAVIR score (Table 1). Significant necrotic inflammation as defined by an activity grade (A) was not always available.
| METAVIR score | Patients (n) | Pathology | |
| F0-F1 | No fibrosis or mild fibrosis | 10 | HBV-, HCV-, HIV-seronegative patients who underwent liver resection surgery, mainly for liver metastasis, in the absence of underlying liver disease. A0-F1 |
| F0-F1 | No fibrosis or mild fibrosis | 1 | Prior history: Breast cancer with liver metastases, treated by surgery and radio-chemotherapy. Non-tumoral liver sample: Perisinusoidal and portal fibrosis without septa (F1). No steatosis |
| 2 | Prior history: HCV infection, resected hepato-cholangiocarcinoma. Non tumoral liver samples: A0F0 | ||
| F2-F3 | Moderate to severe fibrosis | 2 | Cholangiocarcinoma, non-tumor liver samples |
| 1 | Chronic hepatitis B infection, NASH, and two resected hepatocellular carcinoma nodules. Non-tumoral liver sample: Chronic hepatitis with extensive fibrosis A1F3 | ||
| F4 | Cirrhosis | 2 | HCC, non-tumor liver samples |
| 1 | HCC, treated HCV infection. Non-tumoral liver sample | ||
| 1 | HCC on untreated HCV infection. Non-tumoral liver sample |
We obtained between 32 to 48 liver slices for each donor sample. On the different days of the kinetic experiments, the results were obtained from the mean of three liver slices from each donor. The liver slices were infected with a same viral stock. The liver slice cultures were inoculated with viral supernatant diluted in fresh medium, at MOI = 0.1 (multiplicity of infection) and incubated overnight at 37 °C. In order to remove free virus, the slices were washed three times with phosphate-buffered saline (PBS) and fresh complete culture medium was added, after which cultures were followed in the absence of additional changes to the media composition or replacement with fresh culture medium. The preparation and culture of the liver slices, HCV RNA transfection, virus production, HCV RNA extraction were performed as previously described[11,12].
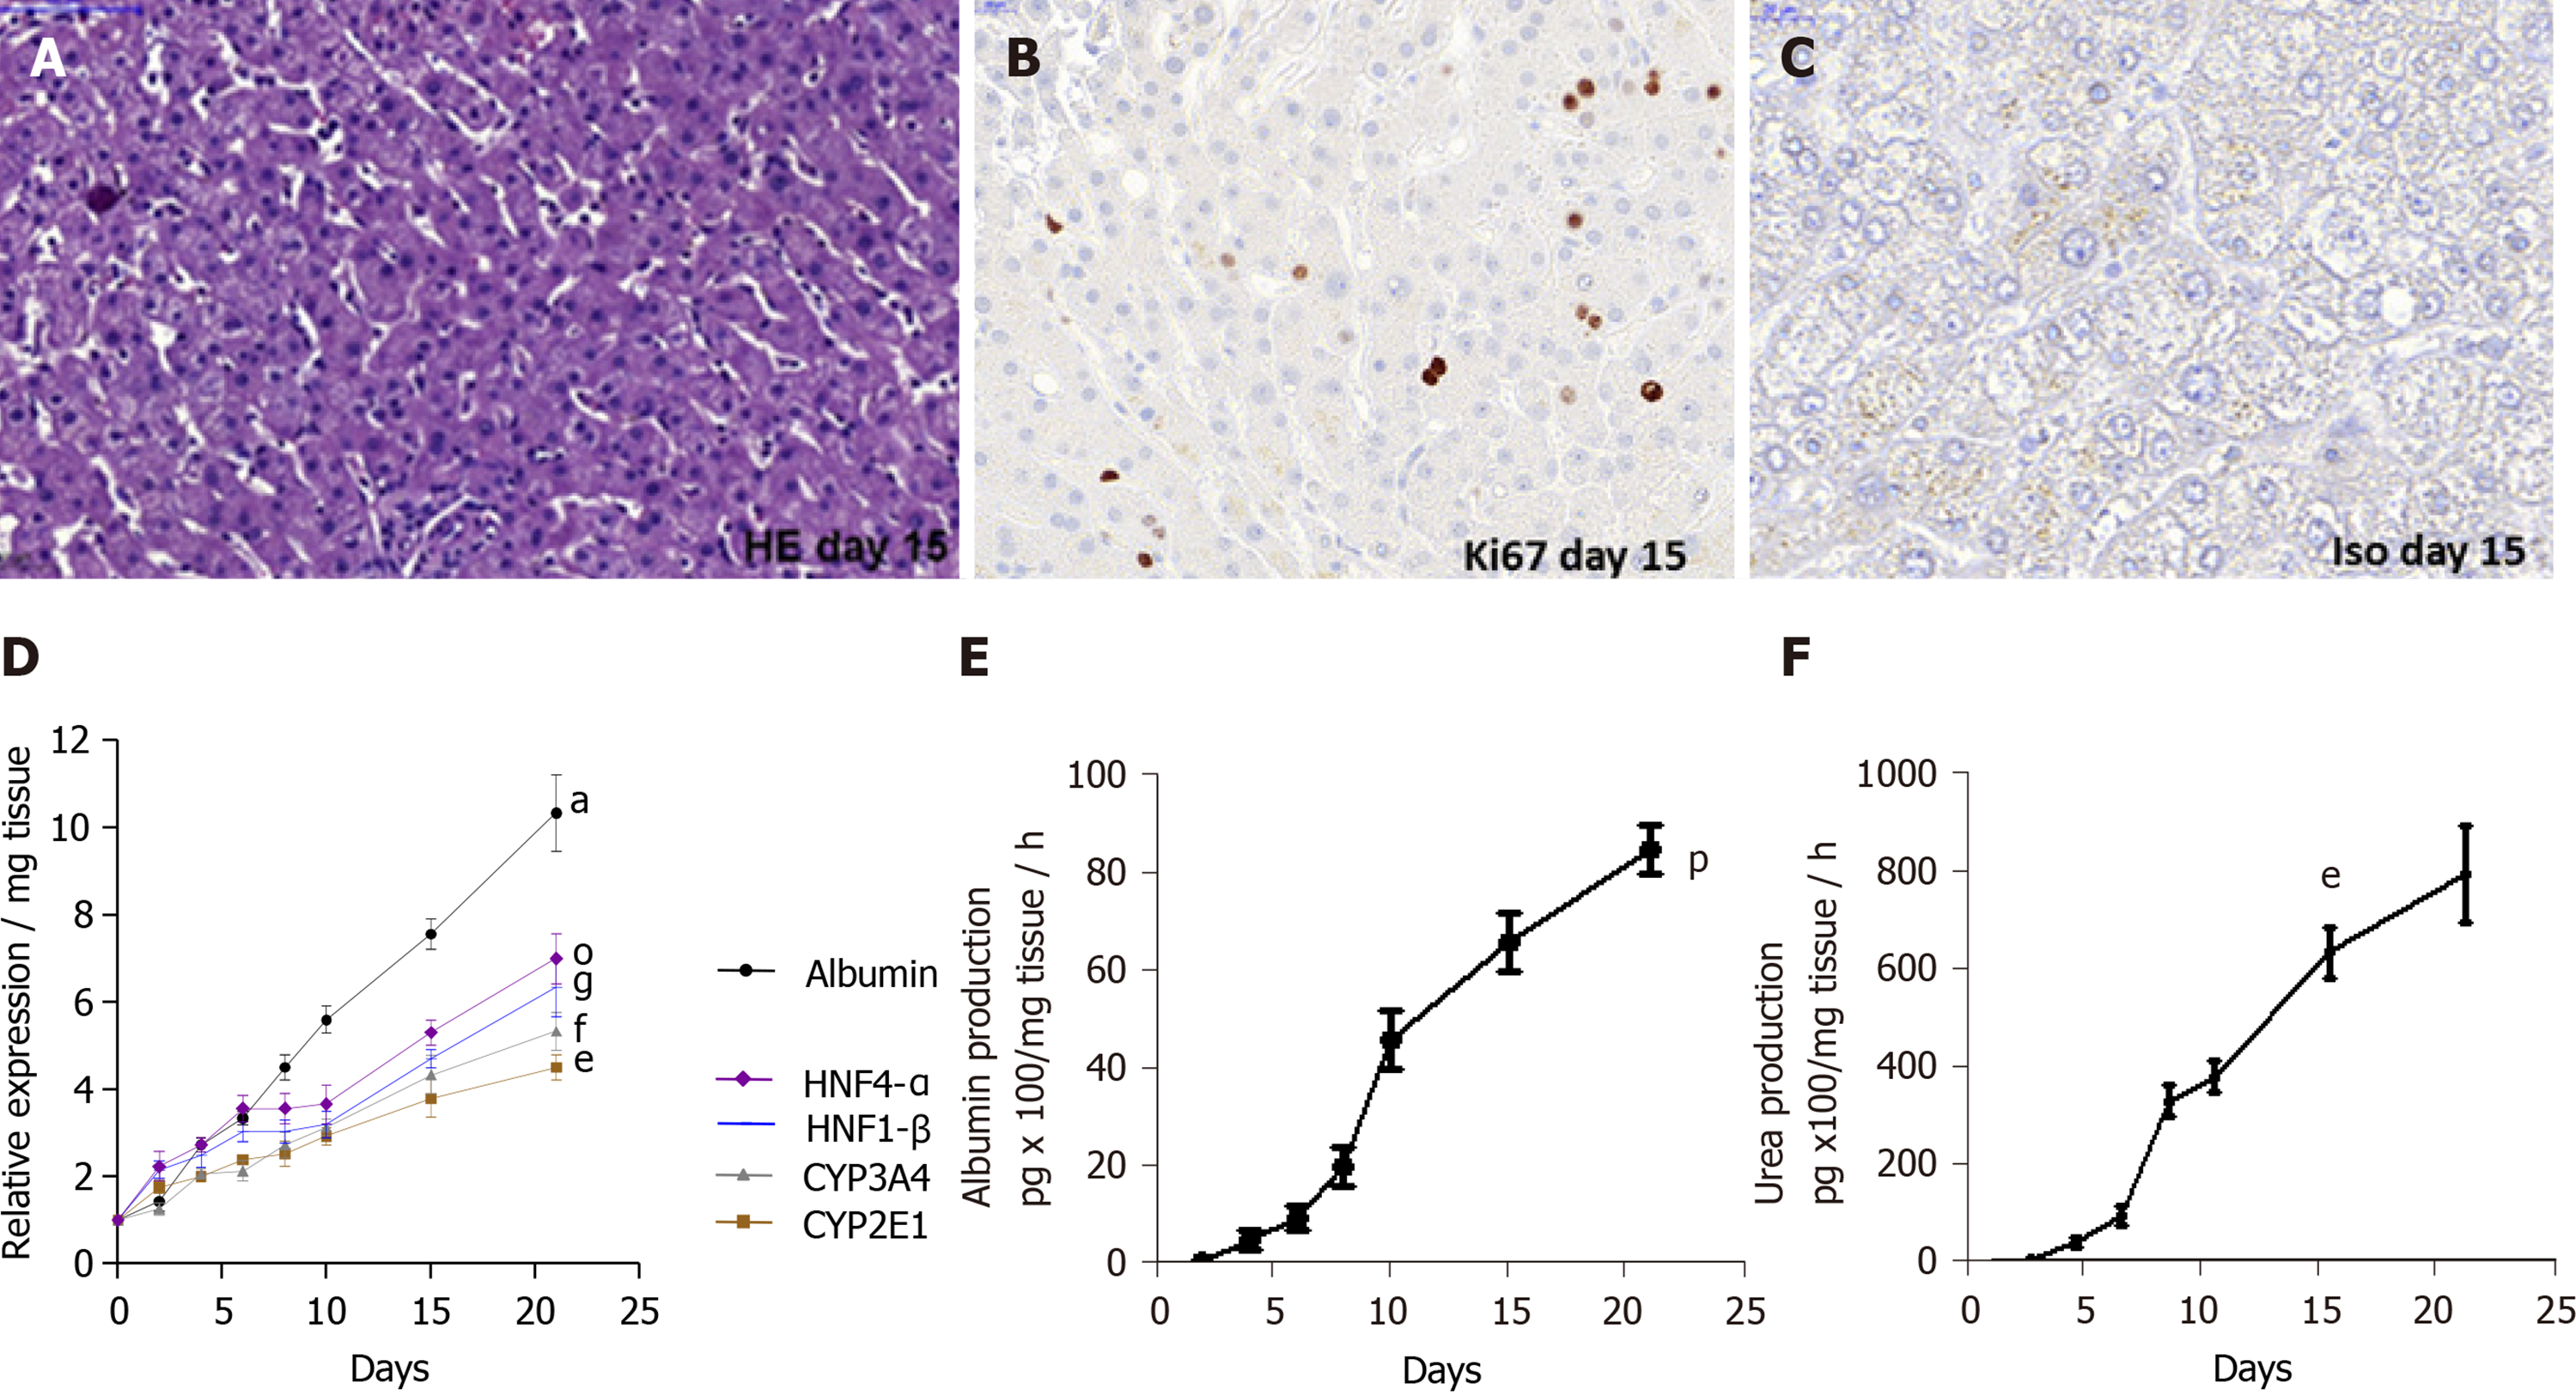
Special attention was paid to the condition of clinical liver samples. It is evident that the condition of the liver sections that we obtained was different. Thus, they were carefully selected for in vitro studies. In fact, cell viability was estimated by determining the percentage of viable cells upon microscopic examination 10X, using live/dead fixable dead cell stain kit (Molecular Probes, Invitrogen, ThermoFisher, France) and, as the percentage of ATP production determined by enzyme-linked immunosorbent assay (ELISA) assays, while observing the increasing albumin and urea secretion levels throughout the experiments, which indicates that the physiological and biochemical parameters of the liver slices are normal. On day 15, the immunostaining for Ki67, a cellular marker for proliferation confirmed the cell viability. Only slices with viability greater than 80% were used and allowed to obtain all the presented results. The architecture of human LS cultures was accessed by hematoxylin-eosin (HE) staining performed as following: Cryosections were washed with distilled water for 5-10 min and then stained for 8 min with hematoxylin, followed by a washing step with warm water at 30 °C for 10 min. After a short washing step with distilled water, the slices were counter-stained for 6 min with eosin. Washing was followed by dehydration steps in 2 min intervals in 50%, 60%, 70%, 80% and 90% of ethanol.
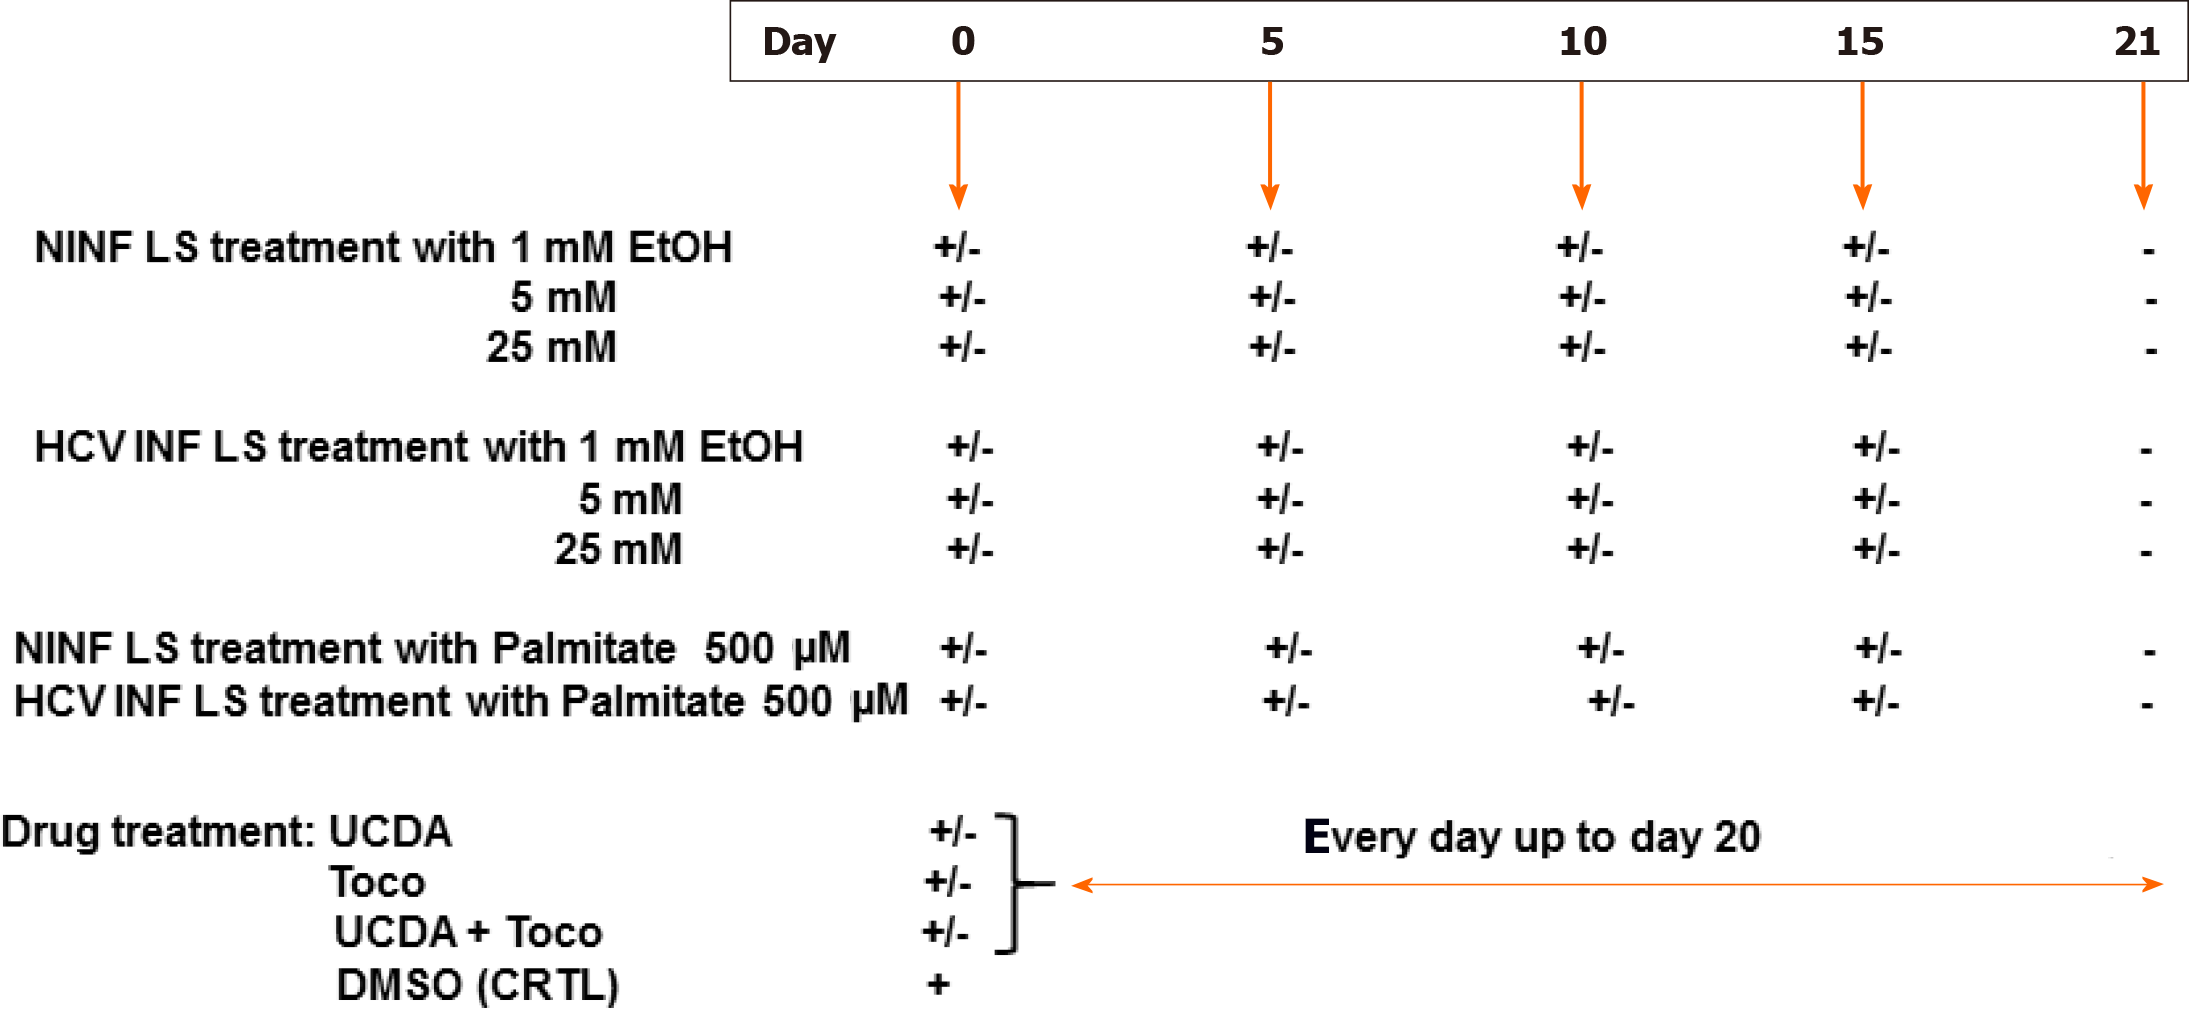
The experimental set up was as follows (Figure 1). Non-infected liver slices obtained either from human non-fibrotic (F0-F1) or fibrotic (F2-F3, F4) liver resection and cut in 350 µm-thick slices (approximately 2.7 × 10⁶ cells per slice), were cultivated for up to 21 days either with or without HCV, ethanol (EtOH) (1 mmol/L, 5 mmol/L, 25 mmol/L) or palmitate (500 µmol/L). Liver slices were infected with hepatitis C virus infection from cell culture (HCVcc) supernatant [Con1/C3 (genotype1b)][16] (MOI = 0.1) (INF LS) in presence or not either of EtOH (1 mmol/L, 5 mmol/L, 25 mmol/L) or palmitate (500 µmol/L). The different concentrations of EtOH were added on days 0, 5, 10, 15 during the kinetic studies. Palmitate (500 µmol/L) was added or not to non-infected and infected liver slices on days 0, 5, 10 and 15 of the kinetic studies. As previously described, infectivity (ffu/mL) was measured on days 1, 5, 10, and 21 post-treatment depending on the experiment[11,12]. All experiments were performed in triplicate. All data were presented in relation to the percentage of viable liver slices in culture. Once the model was validated for the presence of “molecular fibrogenesis” defined as a significant increase in fibrosis biomarkers [TGF-β1, Hsp47, α-SMA, Procol1A1, matrix metalloproteinases 2 (MMP-2), MMP-9, and vascular endothelial growth factor (VEGF)], we evaluated the anti-fibrotic properties of two drugs, ursodeoxycholic acid (UCDA) (Sigma-Aldrich, Merck, Germany) and α-Tocopherol (Toco) (Sigma-Aldrich, Merck, Germany). UCDA (240 ng/liver slice) and / or α-Toco (170 ng/liver slice) were added to the culture media from day 0 and every day up to day 20 of the culture. The estimation of the triglyceride content was essential during the different kinetic experiments, since its accumulation in the cytoplasm of hepatocytes indicates cell metabolism disturbances, typical of non-alcoholic fatty liver disease[17].
The liver slices were washed three times in PBS at 4 °C. RNA was extracted from three combined slices using Trizol reagent as described in the protocol (Invitrogen, Cergy Pontoise, France). A strand-specific real-time reverse transcription-quantitative polymerase chain reaction (RT-qPCR) technique to quantify the intracellular levels of positive and negative-strand HCV RNA was performed during the experiments with the quantification of 28S rRNA used as an internal standard to quantify HCV in total liver RNA as previously described[11], (detection threshold: 25 copies/reaction). Briefly, reverse transcription was performed using an oligo primer and Moloney murine leukemia virus reverse transcriptase (Promega, Charbonnières, France) according to the manufacturer’s instructions. Real-time polymerase chain reactions were performed using Light CylclerR (Roche Applied Science, Grenoble, France) and FastStart DNA Master SYBR Green I kit (Roche Applied Science, Grenoble, France) according to the manufacturer’s instructions.
The relative expression of each liver-specific transcript (albumin, HNF-1β, HNF-4α transcription factors, cytochrome P450 enzymes, CYP2E1 and CYP3A4) was quantified by qRT-PCR and normalized to 18S RNA transcripts[11,12]. The relative expression level of the transcripts was then determined in relation to the 18S RNA by the (Ct) method[13]. The PCR conditions were as follows: Denaturation for 10 min at 95 °C, followed by 45 cycles of denaturation at 95 °C for 5 s, annealing at 60 °C for 20 s, and elongation at 72 °C for 30 s. The specificity of the PCR products was checked by a melting curve analysis after amplification. Primer sequences are listed in Table 2.
| Gene | Forward primer sequence | Reverse primer sequence |
| CYP2E1 | AGCACAAACTCTGAGATATGG | ATAGTCACTGTACTTGAACT |
| CYP3A4 | GCCTGGTGCTCCTCTATCTA | ACAGGCTGTTGACCATCATAAAAG |
| HNF-1β | ACGTCAGAAAGCAACGAGAGATC | CCCAGGCCCATGGCT |
| HNF-4α | CCTGGAATTTGAGAATGTGCAG | AGGTTGGTGCCTTCTGATGG |
| Albumin | ATGAGATGCCTGCTGACTTG | GCACGACAGAGTAATCAGGA |
| 18S RNA | CAGAGCGAAAGCATTTGCCAAG | CGGCATCGTTTATGGTCGGAAC |
| TGF-β1 | CCTGGAAAGGGCTCAACAC | CAGTTCTTCTCTGTGGAGCTGA |
| HSP 47 | GCCACCGTGGTGCCGCA | GCCAGGGCCGCCTCCAGGAG |
| β-SMA | AGGGGGTGATGGGTGGGAA | ATGATGCCATGTTCTATCGG |
| Procol1A1 | CAATCACCTGCGTACAGAACGCC | CGGCAGGGCTCGGGTTTC |
| MMP-2 | CTT CGCCCC AGG CAC TGG TG | CCTCGCTCCCATGGG GTT CGGT |
| MMP-9 | GGT CCCCCCACT GCT GGC CCTTCTACGGCC | GTCCTCAGG GCACTG GAG GAT GTC ATA GCT |
| VEGF | TACCTCCACCATGCCAAGTG | ATGATTCTGCCCTCCTCCTTC |
| GAPDH | ACCAGGGCTGCTTTTAACTCT | GGTGCCATGGAATTTGCC |
The expression of fibrosis markers in either non-infected liver slices (used as controls, CRTL) or in HCV-infected (INF) liver slices with or without the presence of EtOH or palmitate were evaluated by RT-qPCR with the SYBR PrimeScript RT-qPCR Kit (TaKaRa Bio Inc., Japan) and performed with the housekeeping gene, GAPDH as an internal control. Real-Time qPCR reaction for fibrosis markers including TGF-β1, heat shock protein 47 (Hsp47), alpha smooth muscle actin (β-SMA), procollagen1 A1 (Procol1A1), and VEGF was performed as follows: Denaturation for 10 min at 95 °C followed by 45 cycles of denaturation at 95 °C for 15 s, annealing at 60 °C for 1 min, and elongation at 72 °C for 30 s. Concerning the MMP-2, MMP-9 gene expression, the Real-Time qPCR reaction was performed as follows: Denaturation for 10 min at 95 °C followed by 45 cycles of denaturation at 95 °C for 15 s, annealing at 60 °C and 68 °C respectively, for 1 min, and elongation at 72 °C for 30 s. Ct (threshold cycle) values were corrected for the Ct values of the housekeeping gene GAPDH. Primer sequences are listed in Table 2.
Albumin enzyme-linked immunosorbent assay: Human liver albumin concentrations were determined by a competitive ELISA as previously described[18,19]. Purified human albumin and peroxidase-conjugated anti-human albumin were obtained from MP Biomedicals Europe (Illkirch, France). To ensure the specificity of the ELISA, human antibodies were incubated for 2 h at 37 °C with 3% BSA in 0.5% Tween-20 in PBS before the sample addition in order to block any cross reaction.
Urea assays: Urea concentrations were determined by colorimetric assay (640-1, Sigma-Aldrich) according to the manufacturer’s recommendations and analyzed with BioPhotometer 6131 (Eppendorf, Hamburg, Germany).
Western blotting was performed as previously described[11,12], and the antibodies used are described as following. Mouse monoclonal antibodies (mAbs) to HCV core protein (C7-50; dilution 1/10000, Affinity BioReagents, Golden, CO, United States), HCV nonstructural protein 3 (clone1847, dilution: 1/2000, Viro-Stat, Portland, ME, United States) were used to analyze HCV expression, mouse monoclonal antibodies (mAbs) TGF-β1 (ab 190503, dilution: 1/2000, Abcam, United Kingdom), HSP-47 (M16.10A1, dilution: 1/1000, Enzo life sciences, France), Collagen I alpha 1 (NB600-450, dilution: 1/2000, Novus Biologicals, CO, United States), MMP-9 (ab119906, dilution: 1/2000, Abcam, United Kingdom), VEGF (ab69479, dilution: 1/2000, Abcam, United Kingdom), β-actin (A5316, dilution: 1/5000 Sigma-Aldrich, Merck, Germany), and rabbit polyclonal antibodies (rAbs) to MMP-2 (ab92536, dilution: 1/1000, Abcam, United Kingdom), alpha-smooth muscle actin [alpha-SMA (ab 5694, dilution: 1/2000, Abcam, United Kingdom)] allowing fibrosis analysis, were used as primary antibodies. Horseradish peroxidase-conjugated anti-mouse IgG and horseradish peroxidase-conjugated anti-rabbit IgG (Amersham, GeHealthCare Life Sciences, United Kingdom) secondary antibodies, taken 1:50000, were used as secondary antibodies. The reactions were developed using enhanced chemiluminescence detection reagents (ECL Advance kit, Amersham, GeHealthCare Life Sciences, United Kingdom), followed by exposure to X-OMAT film (Amersham, GeHealthCare Life Sciences, United Kingdom).
Liver sections (7 µm) were stained with Goldner’s trichrome (Electron Microscopy Sciences, United States) or picrosirius red (Abcam, United Kingdom), performed standard protocols for collagen/connective tissue labelling using two slices per human liver sample and two different human liver samples per group. The images were taken with the EVOS XL Core Imaging System (Invitrogen, Thermo Fisher Scientific, France). The average integrated optical density (OD) of collagen deposition was calculated using the image quantification standard software, ImageJ2[20,21] or inform V2.1 (Perkin Elmer, MA, United States) used routinely in the histology (HISTIM) facilities (Cochin Institute, Paris, France). Immunostaining for TGF-β1 (mAbs, ab92486, Abcam, United Kingdom), MMP-9 (mAbs, ab119906, Abcam, United Kingdom), Ki67 (rAbs, ab15580, Abcam, United Kingdom), and alpha-SMA (rAbs, ab5694, Abcam, United Kingdom) was performed after paraffin removal in xylene, rehydratation in EtOH and then distilled water following the manufacturer’s instructions. Unmasking of the antigenic sites was performed at 120 °C in 10 mmol/L citrate buffer, pH 6.0. A solution of 3% H2O2 was used to eliminate endogenous peroxidases. The sections were washed 3 times for 5 min. in TBS-Triton 0.1% solution. After incubation in a blocking solution (TBS-Triton 0.1%-3% dry milk) for 1 h at room temperature, they were incubated with the primary antibodies. All primary antibodies were diluted at 1/50 in the blocking solution. After incubation for 2 h at room temperature, the sections were washed 3 times and incubated with secondary antibodies. The nuclei were stained with DAPI. All sections were counterstained with hematoxylin for tissue quality control. Control sections incubated with non-immune serum were used as negative controls.
TGF-β1 and triglyceride quantification were performed according to the manufacturer’s instructions (TGF-β1 Quantikine ELISA, RD Systems, United States; Triglyceride assays Kit–Quantification, ab65336, Abcam, United Kingdom). For TGF-β1, cellular lysates and culture supernatants were first treated with acid to lower the pH to 2.0, which denatures the latency-associated peptide and allows the detection of active TGF-β1. The supernatant was then brought back to neutral pH before the ELISA assays.
To check viability, the percentages of ATP was assessed at each point of the kinetics studies during the liver slices culture and determined by ELISA assays (CellTiter-Glo® 2.0 Assay, Promega, France)[19]. The viability of liver slices and the potential cytotoxicity[20] (cytoTox 96R Non-Radioactive Cytotoxicity Assay, Promega, France) induced by Ethanol, or Palmitate, or drugs treatments was estimated as described previously[11,12], in accordance with the manufacturers’ protocols.
Human LS were infected or not with the HCVcc Con1/C3 supernatant as previously described[11,12]. On day 0 of the culture, treatment either with (240 ng/Liver slice) UCDA or (170 ng/Liver slice) Toco or both (the recommended standard of care) or 0.5% of dimethyl sulfoxide (Sigma Aldrich, Merck, Germany) as a control, were added to HCV-infected or non-infected LS culture medium every day to day 20. TGF-β1 and Procol1A1 RNA expression were measured at different time points of the kinetic studies. All experiments were performed in triplicate.
Liver specimens from 20 individuals were examined. During the kinetic studies, the quantification of gene expression was determined in relation to the percentage of liver slice viability. The results were obtained from the mean of the three liver slices, on the different days of the kinetic studies. Statistical tests were performed using GraphPad Prism 8.0 software (GraphPad Software, La Jolla, CA, United States). Values are expressed as means ± standard errors of the mean. The data were compared using either the unpaired two-tailed Student’s t-test or the two-way ANOVA test with multiple comparisons for a given day as compared to the standard LS. A P value of 0.05 or less was considered significant.
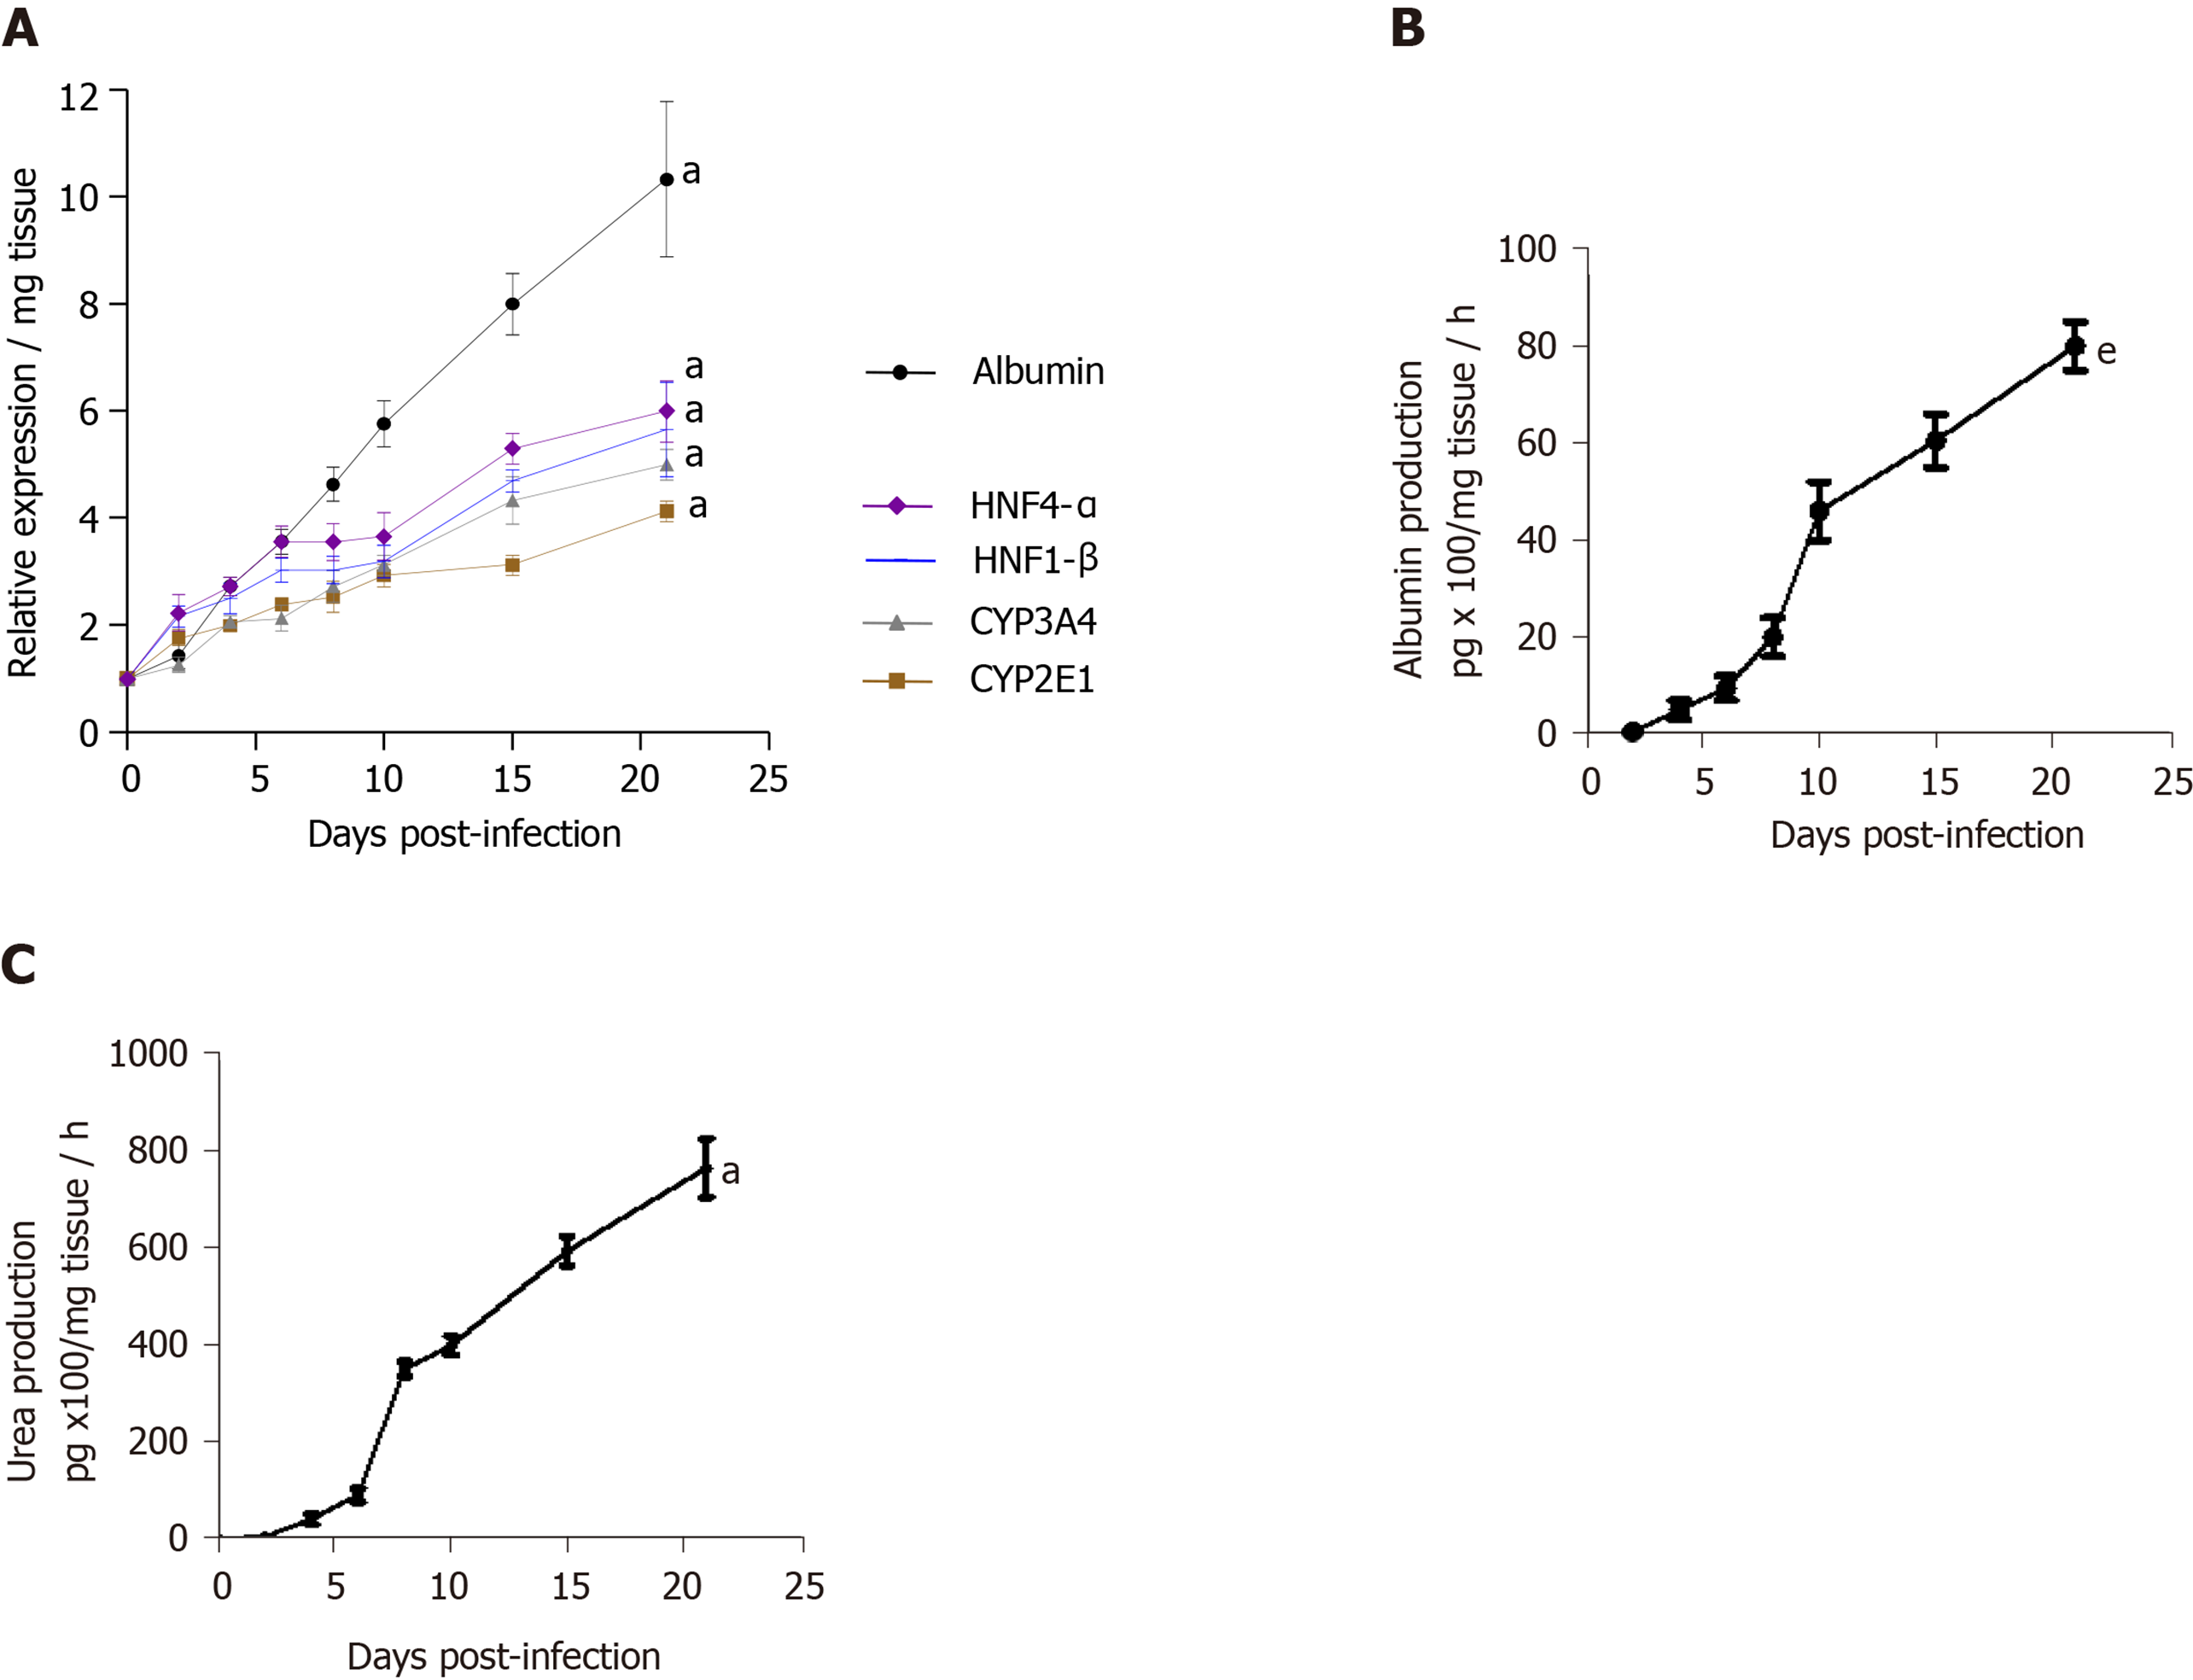
The viability of human LS cultures during prolonged studies was and is a crucial factor. Liver slices viability (percentage of ATP production) and tissue morphology were assessed daily, until day 21. The architecture of the liver slices was normal (Figure 2A) and human liver slices (HLS) expressed the Ki67 protein, a proliferation marker (Figure 2B). Human LS cultures maintained their differentiation status throughout the entire study period, as previously described (Figure 2A-C)[10,12]. Indeed, LS status was confirmed by analysing various parameters and biomarkers, in particular, albumin content, hepatocyte nuclear factors HNF-1β, HNF-4α, CYP2E1, and CYP3A4 (Figure 2D)[10-12,22-24]. A comparison of the expression of hepatocyte-specific genes in F0-F1 non-infected liver slices and Huh-7.5.1 cells showed increased expression in F0-F1 non-infected liver slices on day 21 compared to that in Huh-7.5.1 cells, either at an exponential growth phase or at the confluence (data not shown). CYP3A4 expression was undetected in Huh-7.5.1 cells whatever the growth stage[25]. Albumin and urea secretion increased throughout, indicating that liver slices had retained normal physiological and biochemical parameters (Figure 2E-F)[11,12]. As previously reported[11], the cell viability and expression of hepatocyte-specific genes were also evaluated post- HCVcc[11]. Results were similar to those in uninfected liver slices, indicating that there was no evident cytopathic effect (Figure 3A-C).
The viability of non-fibrotic (F0-F1) and fibrotic (F2-F4) LS cultures and resistance to EtOH and palmitate treatments were tested during the 21 d follow-up studies by evaluating of the rate of ATP production in the liver slices (Figure 4A, C-E and G)[22], and by quantification of LDH release from liver slices (Figure 4B-F)[23]. On day 21, the F0-F1 and F2-F4 non-infected liver slices had a viability rate of 75% and 50%, respectively (Figure 4A). Following treatment with 25 mmol/L of EtOH, ATP synthesis in F0-F1 infected liver slices was reduced by 55% on day 21 (Figure 4D), and tissue viability decreased by nearly 25% compared to untreated F0-F1 non-infected/infected liver slice cultures (Figure 4C and D). However, the addition of EtOH (25 mmol/L) did not change LDH release in F0-F1 and F4 non-infected LS cultures (Figure 4F). Treatment with palmitate (500 µmol/L) did not reduce significantly the viability rate of F0-F1 non-infected and infected LS cultures, compared to untreated and non-infected LS cultures (55% and 65%, respectively) (Figure 4G). There was no significant difference in LDH release from F0-F1, F2-F3, and F4 non-infected and infected LS cultures after treatment with the combination of UCDA and alfa-Toco (Figure 4H and I). Results of ATP production in F0-F1, F2-F3, and F4 non-infected and infected LS cultures after treatment with the combination of UCDA and alfa-Toco were significantly positive (Figure 4J-K) with increased ATP production in Fibrotic treated liver slices. These results, showing no significant changes in viability (with increasing levels of albumin, urea secretion as well as ATP production throughout the experiments) or morphology (Ki67 marker expression), confirm that the non-fibrotic (F0-F1) and fibrotic (F2-F4) LS cultures can survive for 21 days, and that the 3D LS cultures tolerated the different treatments (Figure 4H-K). Thus, LS cultures from selected donors can be used in extended research.
Activation or down-regulation of certain biomarkers reflects the process of the transition of the non-fibrotic liver to the fibrotic liver designated as the molecular fibrogenesis. We measured the expression of seven fibrosis biomarkers (TGF-β1, Hsp47, α-SMA, Procol1A1, MMP-2, MMP-9, and VEGF)[1,26] by RT-qPCR to analyse both non-fibrotic (F0-F1) and fibrotic (F2-F3, F4) stages of the liver in human LS cultures.
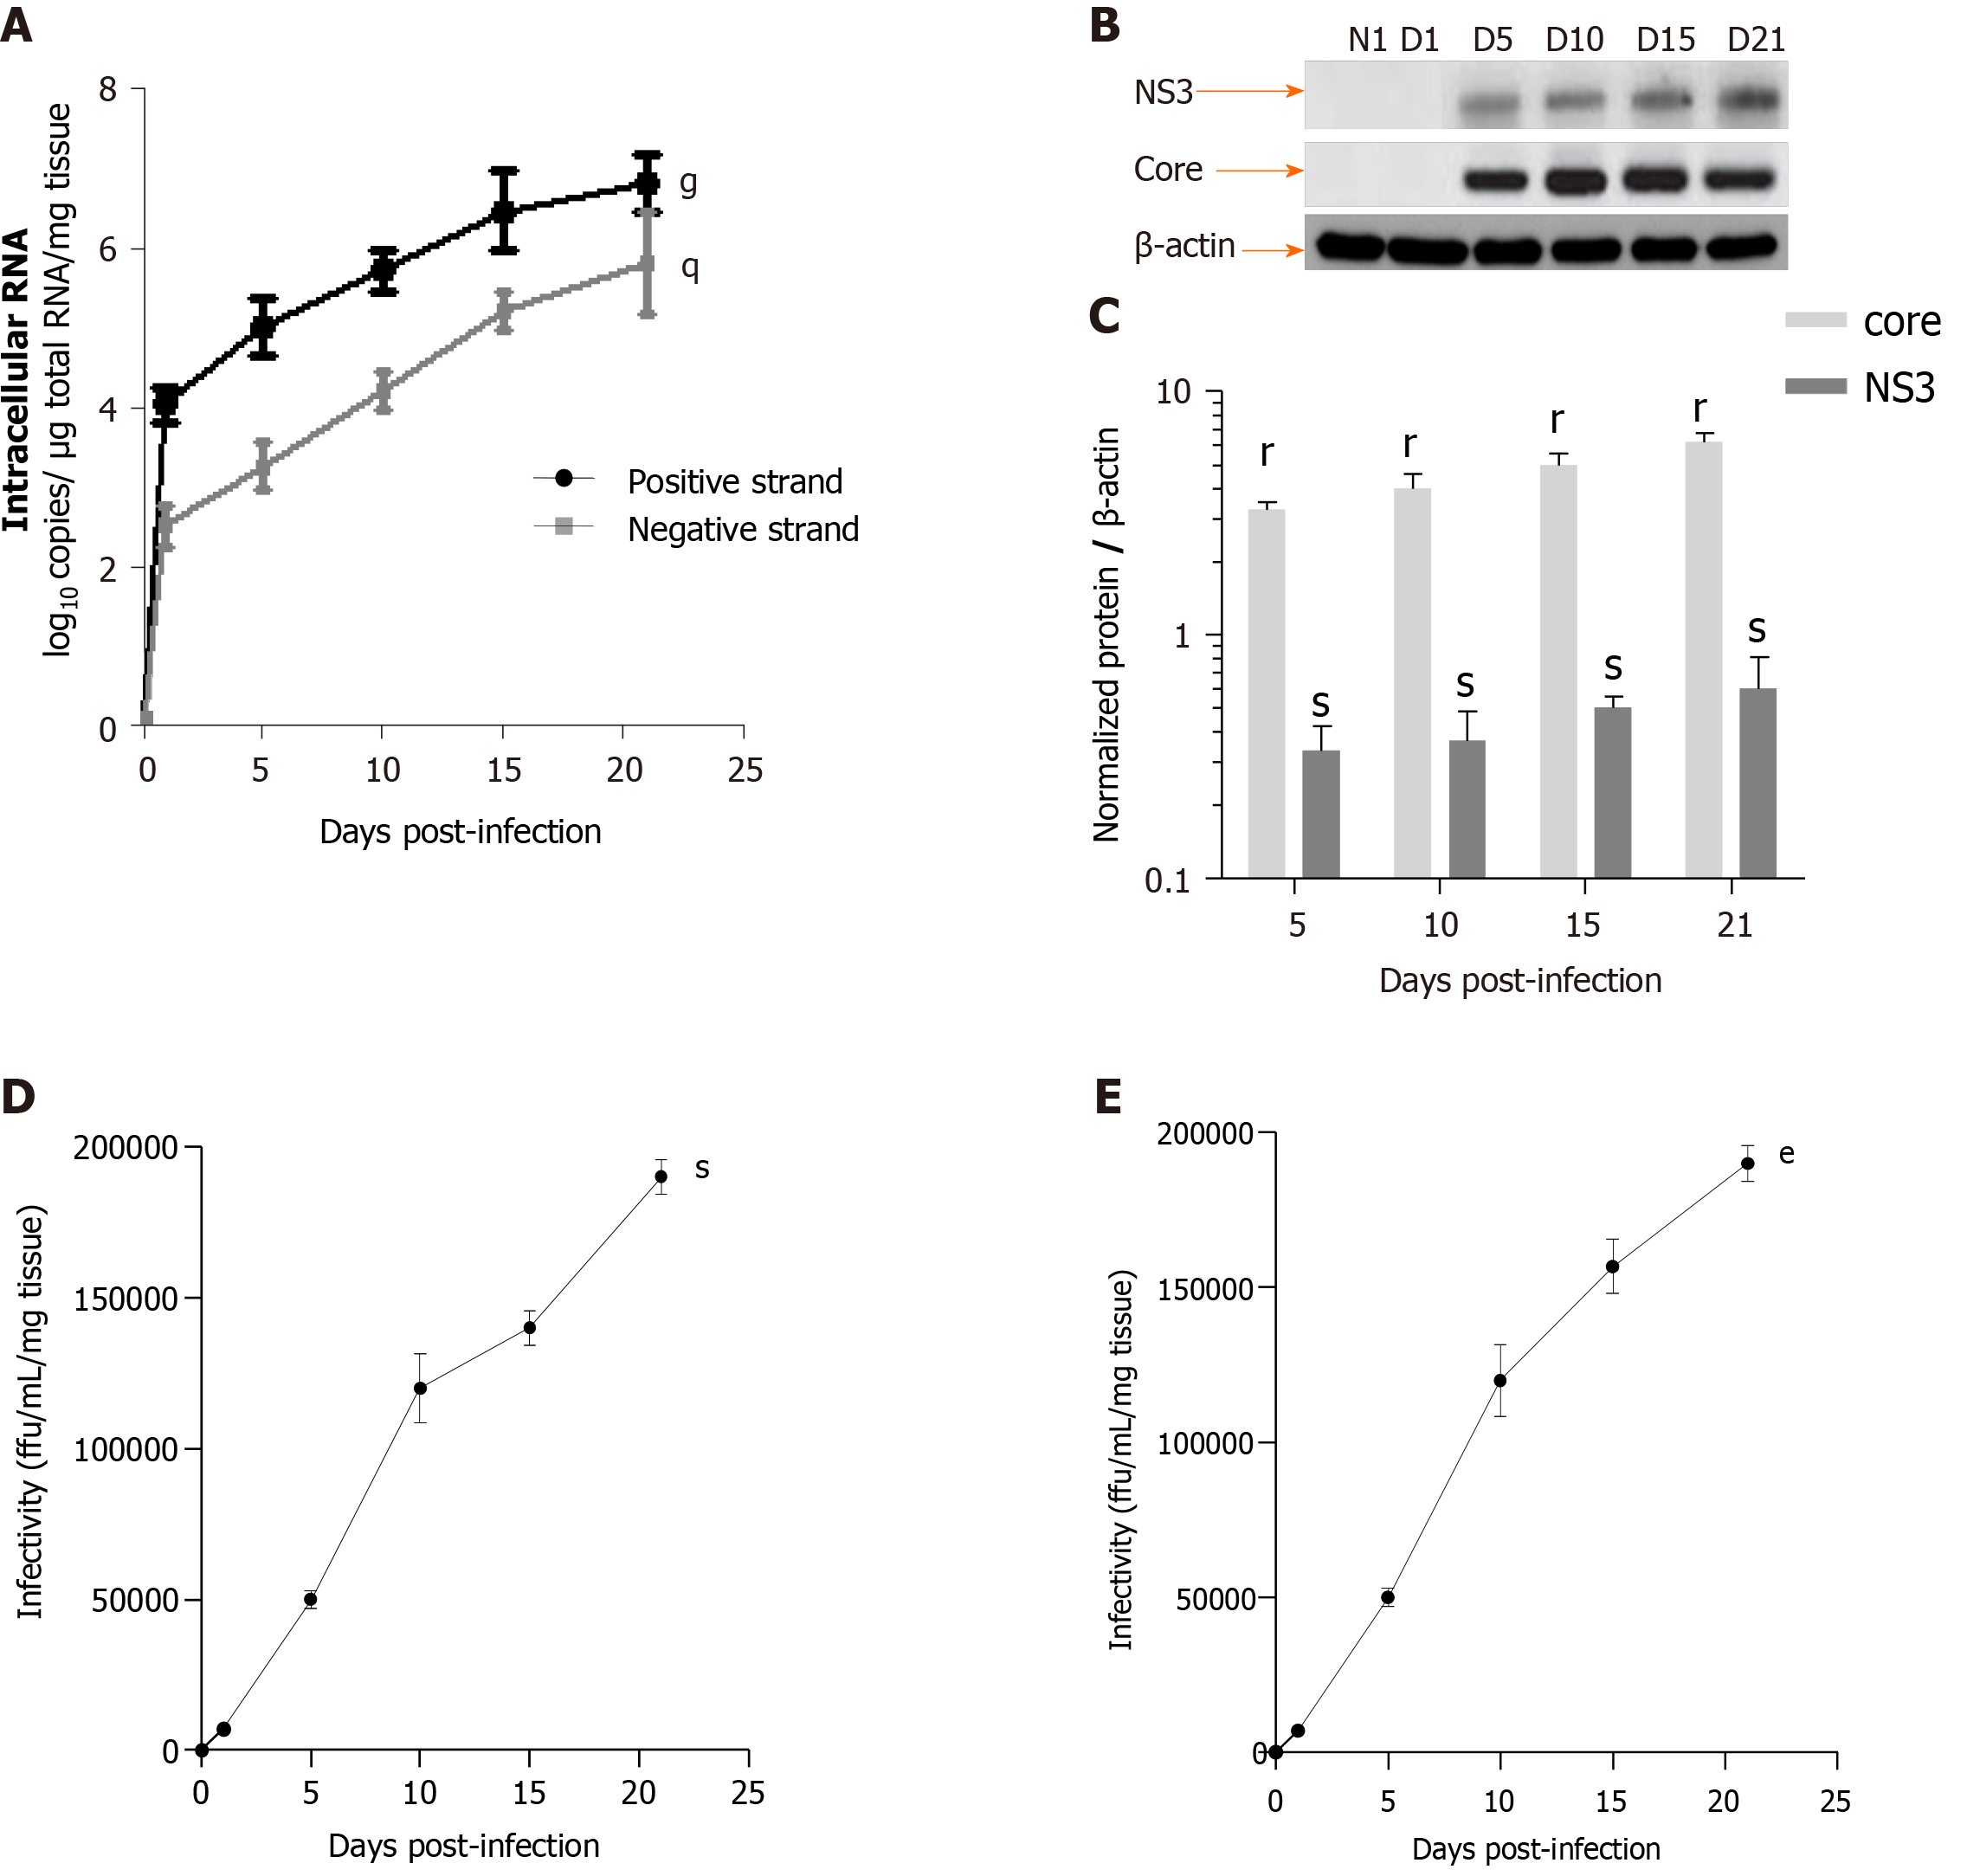
HCV efficiently replication in LS cultures: A model of the viral liver disease: Robust replication of HCVcc and production of infectious viral particles were detected up to day 21 in human F0-F1 LS (Figure 5). Intracellular replication of the viral genome was assessed by a strand-specific RT-qPCR, as previously described[11]. The HCV RNA negative strand, proof of HCV genome replication, could be detected as early day 1 post-infection, and the intracellular levels of both negative and positive strands increased significantly during LS culture. These results confirmed active viral replication in LS cultures (Figure 5A). The HCV expression level was significantly increased in the LS culture on day 5 post-infection (Figure 5A). HCV protein expression was confirmed by Western blotting. Detection of core and nonstructural protein 3 proteins confirmed effective intracellular processing of the viral protein precursor[11] (Figure 5B and C).
The virus titer was estimated in LS culture supernatants using a classic titration assay on Huh-7.5.1 cells to determine whether progeny virions released from the infected LS could replicate[11]. Infectivity increased during the culture and reached a peak of up to 1.7 × 10⁵ ffu/mL respectively, by day 21 post-infection (Figure 5D). To further confirm that the new progeny virus produced by the human LS called the primary-culture-derived virus was indeed infectious, naive human LS were infected de novo with primary-culture-derived virus Con1/C3 at MOI = 0.1. A de novo productive infection of LS was obtained with higher infectivity titers on day 21, genotype1b (180000 ffu/mL) (Figure 5E). Thus, HCV RNA replication, the expression of viral proteins, and the production of highly infectious particles were demonstrated.
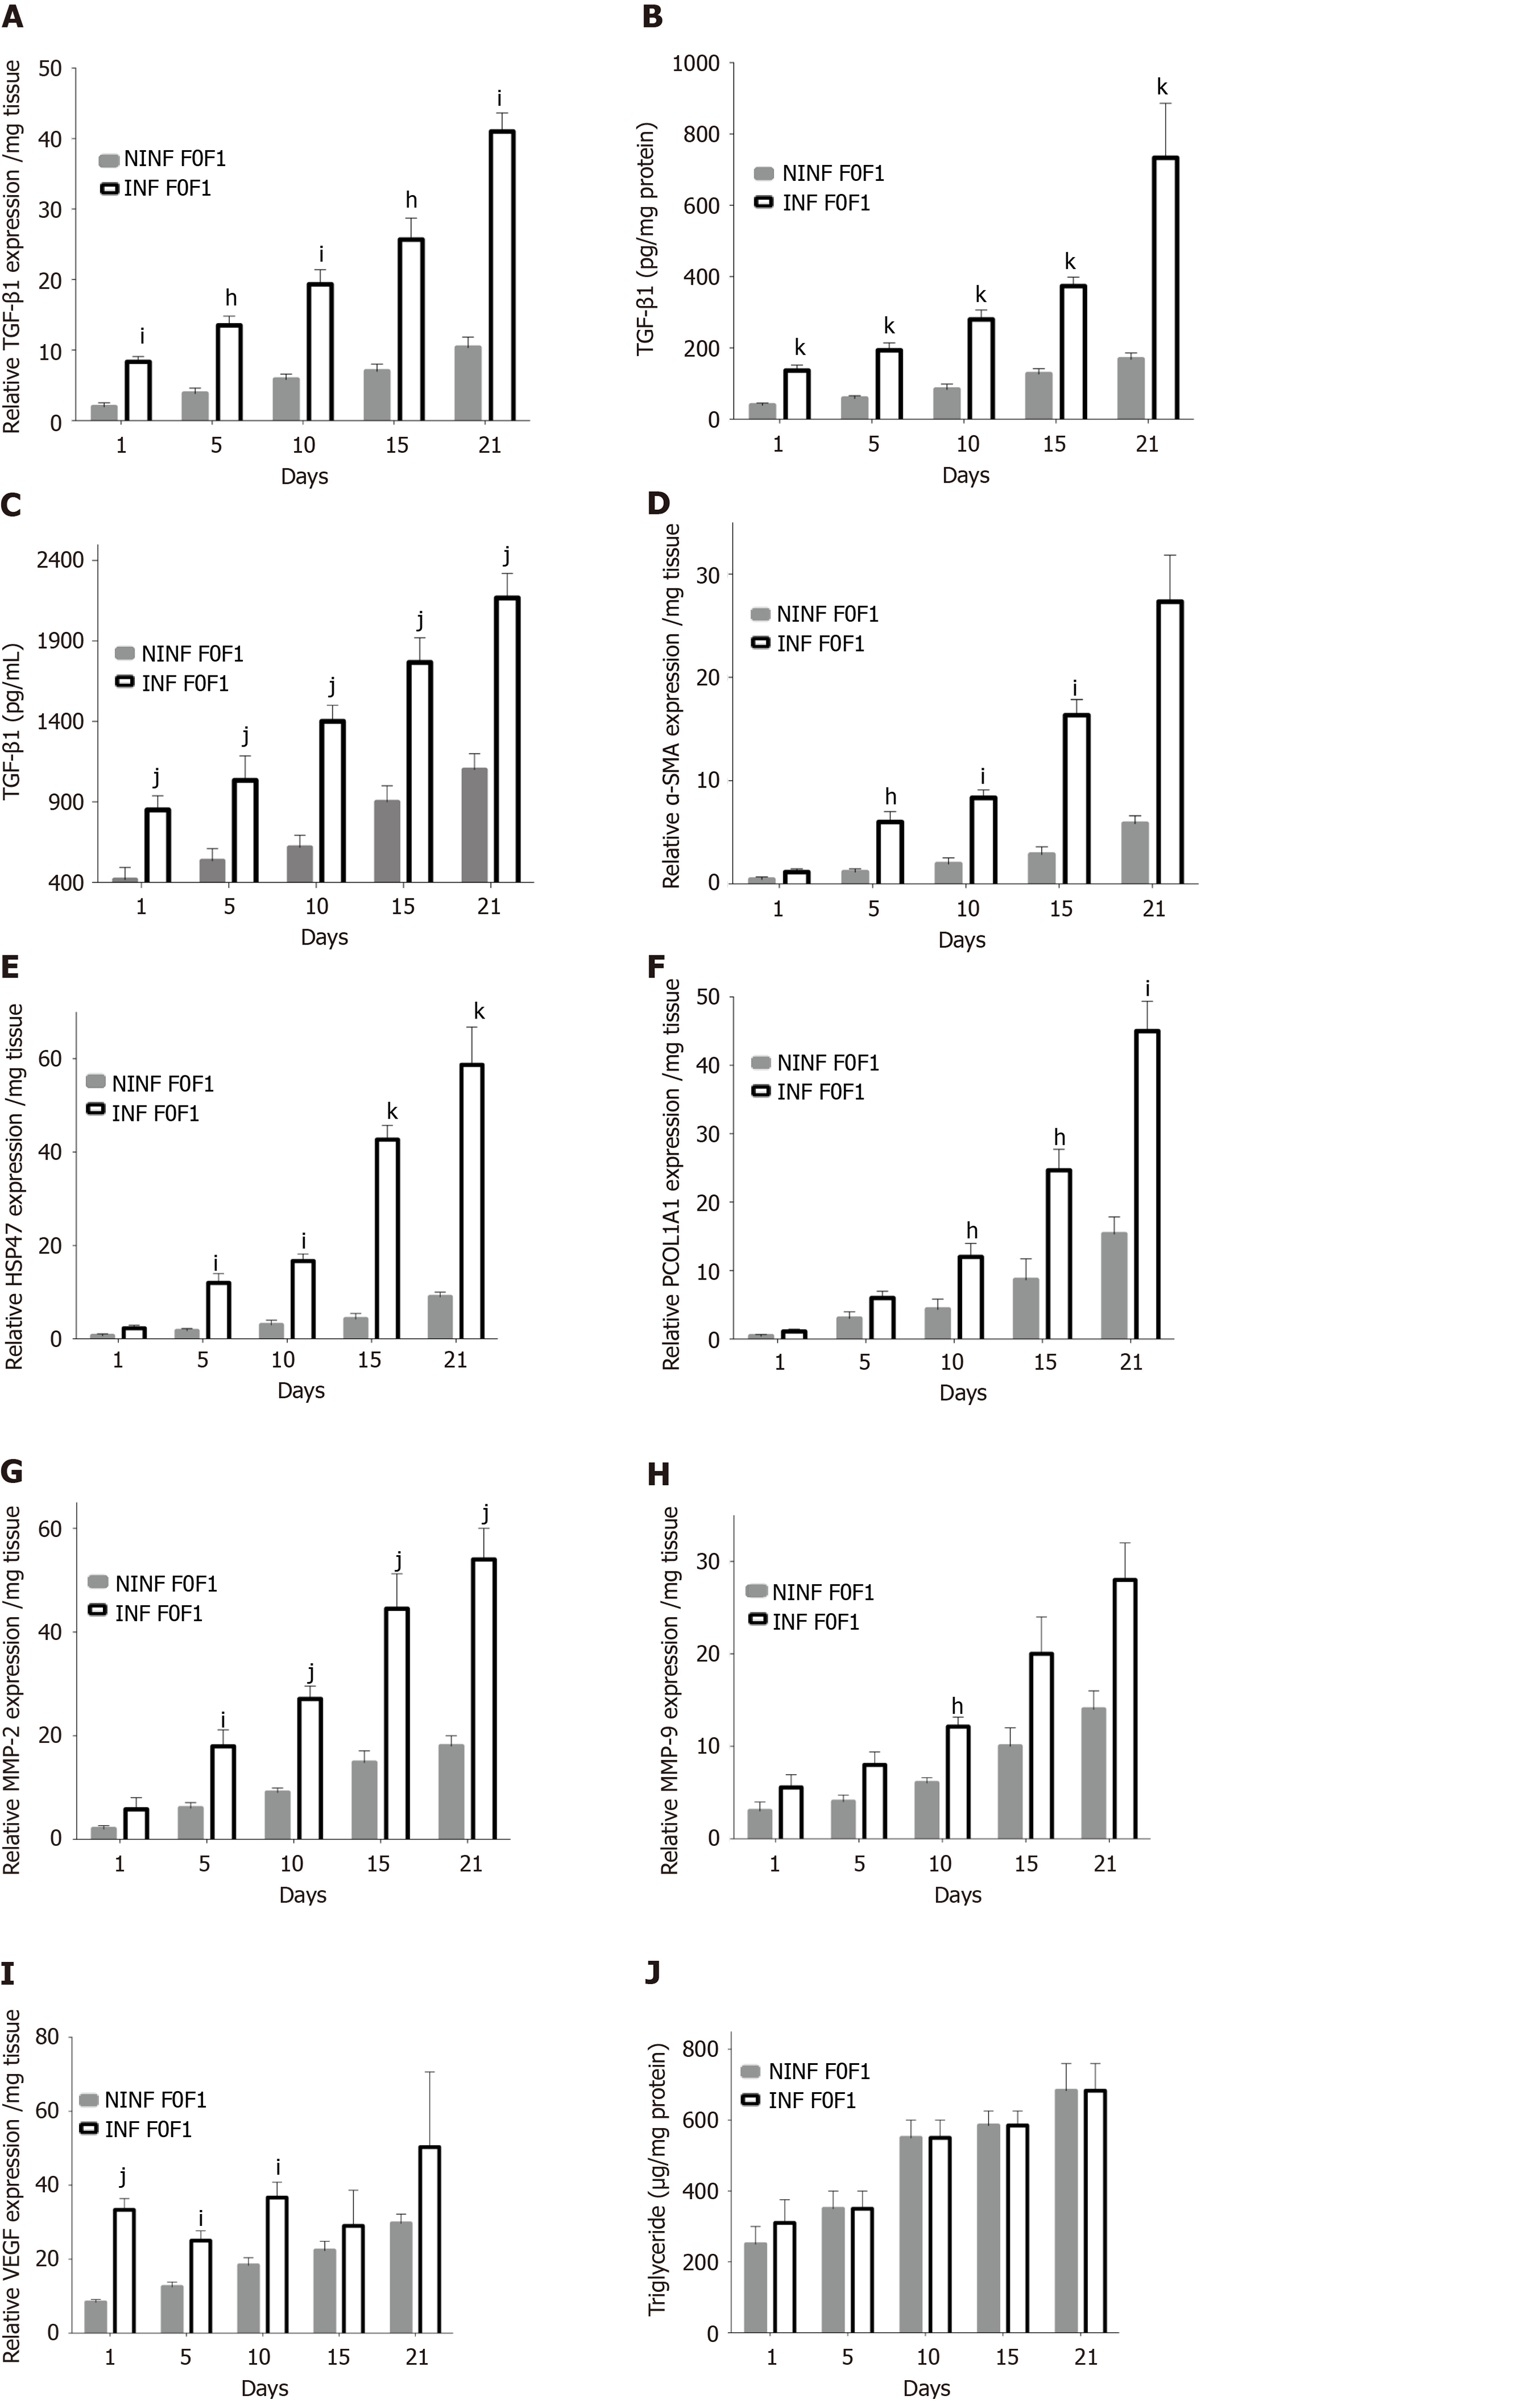
HCVcc infection of non-fibrotic (F0-F1) LS activated the expression of the main pro-fibrogenic markers. During follow-up studies, in non-fibrotic (F0-F1) LS cultures (Figure 6), RNA, and protein expression of TGF-β1 (Figure 6A-C), α-SMA, Hsp47, Procol1A1, (Figure 6D-F) had increased significantly in non-infected and infected LS on day 21. A marked 2.6 to 3.6 fold increase of α-SMA, Hsp47, Procol1A1 RNA expression was observed in non-fibrotic (F0-F1) HCV infected LS cultures, compared to non-infected LS cultures on day 21. MMP-2 RNA expression was also significantly increased after HCV infection in non-fibrotic F0F1 LS, (Figure 6G). On the contrary, there was no significant difference in MMP-9 RNA expression between F0-F1 non-infected and infected liver slices (Figure 6H). VEGF RNA expression increased irregularly up to day 21 and seemed to be influenced by HCV infection until day 5 compared to non-infected LS (Figure 6I). The triglyceride production increased in both F0-F1 non-infected and infected LS cultures (Figure 6J) with no significant difference between them.
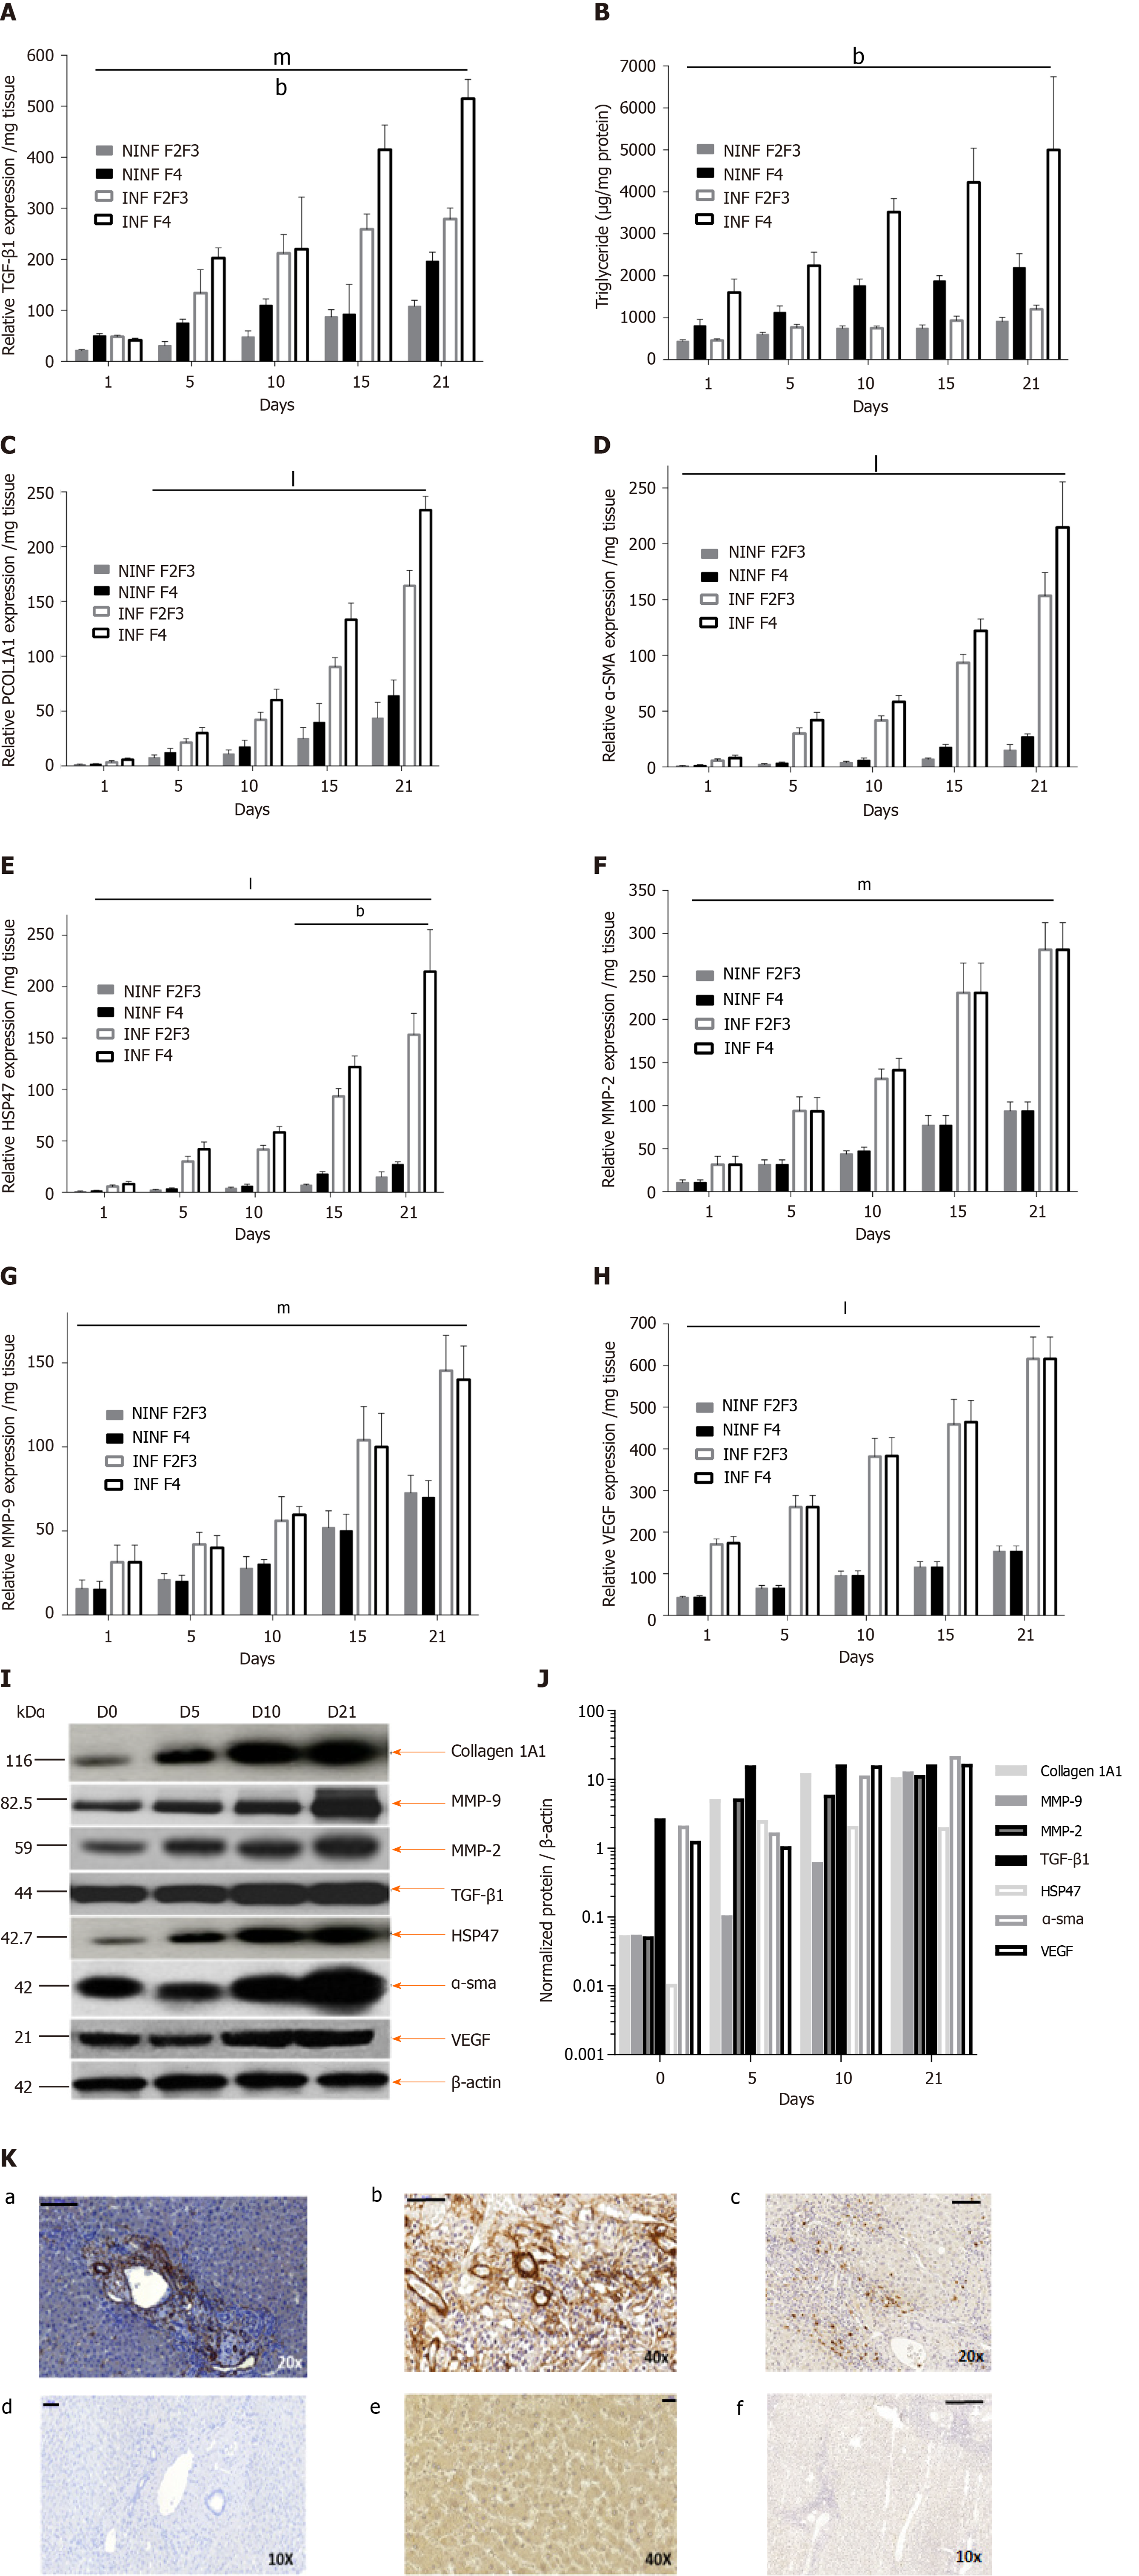
Expression of fibrosis biomarkers was higher in fibrotic LS culture (stages F2-F3 and F4), than in non-fibrotic LS cultures, with a significant 4 to 8 fold increase compared to controls (day 1) (Figure 7). This mainly concerned TGF-β1 (Figure 7A), Procol1A1 (Figure 7C), α-SMA (Figure 7D), Hsp47 (Figure 7E) as well as an increased triglyceride production in fibrotic LS (approximately 3.2 fold) (Figure 7B). After day 10, RNA expression increased with the progression of fibrosis. MMP-2 RNA expression (Figure 7F), as well as MMP-9 and VEGF expression (Figure 7G and H), did not differ between fibrosis stages F2-F3 and F4. It is interesting to note that HCV infection significantly increased TGF-β1, Hsp47, α-SMA, Procl1A1, MMP-2, MMP-9, VEGF expression as well as triglyceride production in fibrotic (F2-F3, F4) infected LS cultures. A significant 2 to 4 fold increase in fibrosis biomarkers was observed on day 21 in F2-F3 and F4 HCV infected LS compared to F2-F3, F4 non-infected LS. Thus, the TGF-β1 (Figure 6A-C), α-SMA, Hsp47, Procol1A1, MMP-2, MMP-9, VEGF expression increased in non-infected and infected LS cultures with a greater increase in infected LS cultures than in controls. On day 21, a significant 2 to 13 fold increase in fibrosis biomarkers was observed in F2-F3, F4 infected LS cultures compared to F2-F3, F4 non-infected LS cultures. Triglyceride production increased in both non-infected and infected LS cultures, independent from the stage of fibrosis. After 21 d of the culture, the amount of triglyceride in the supernatant of F2-F3 and F4 LS cultures increased by 1.36 and 2.7 folds, respectively (Figure 7B). Increased expression of the TGF-β1, α-SMA, Procol1A1, MMP-2, MMP-9, and VEGF in F2-F3 LS cultures throughout the 21-d of follow-up was confirmed by Western blotting (Figure 7I and J). On day 10, immunohistochemistry showed that TGF-β1, α-SMA and MMP-9 expression (Figure 7K) was increased by about 20% in F2-F3 LS compared to day 0.
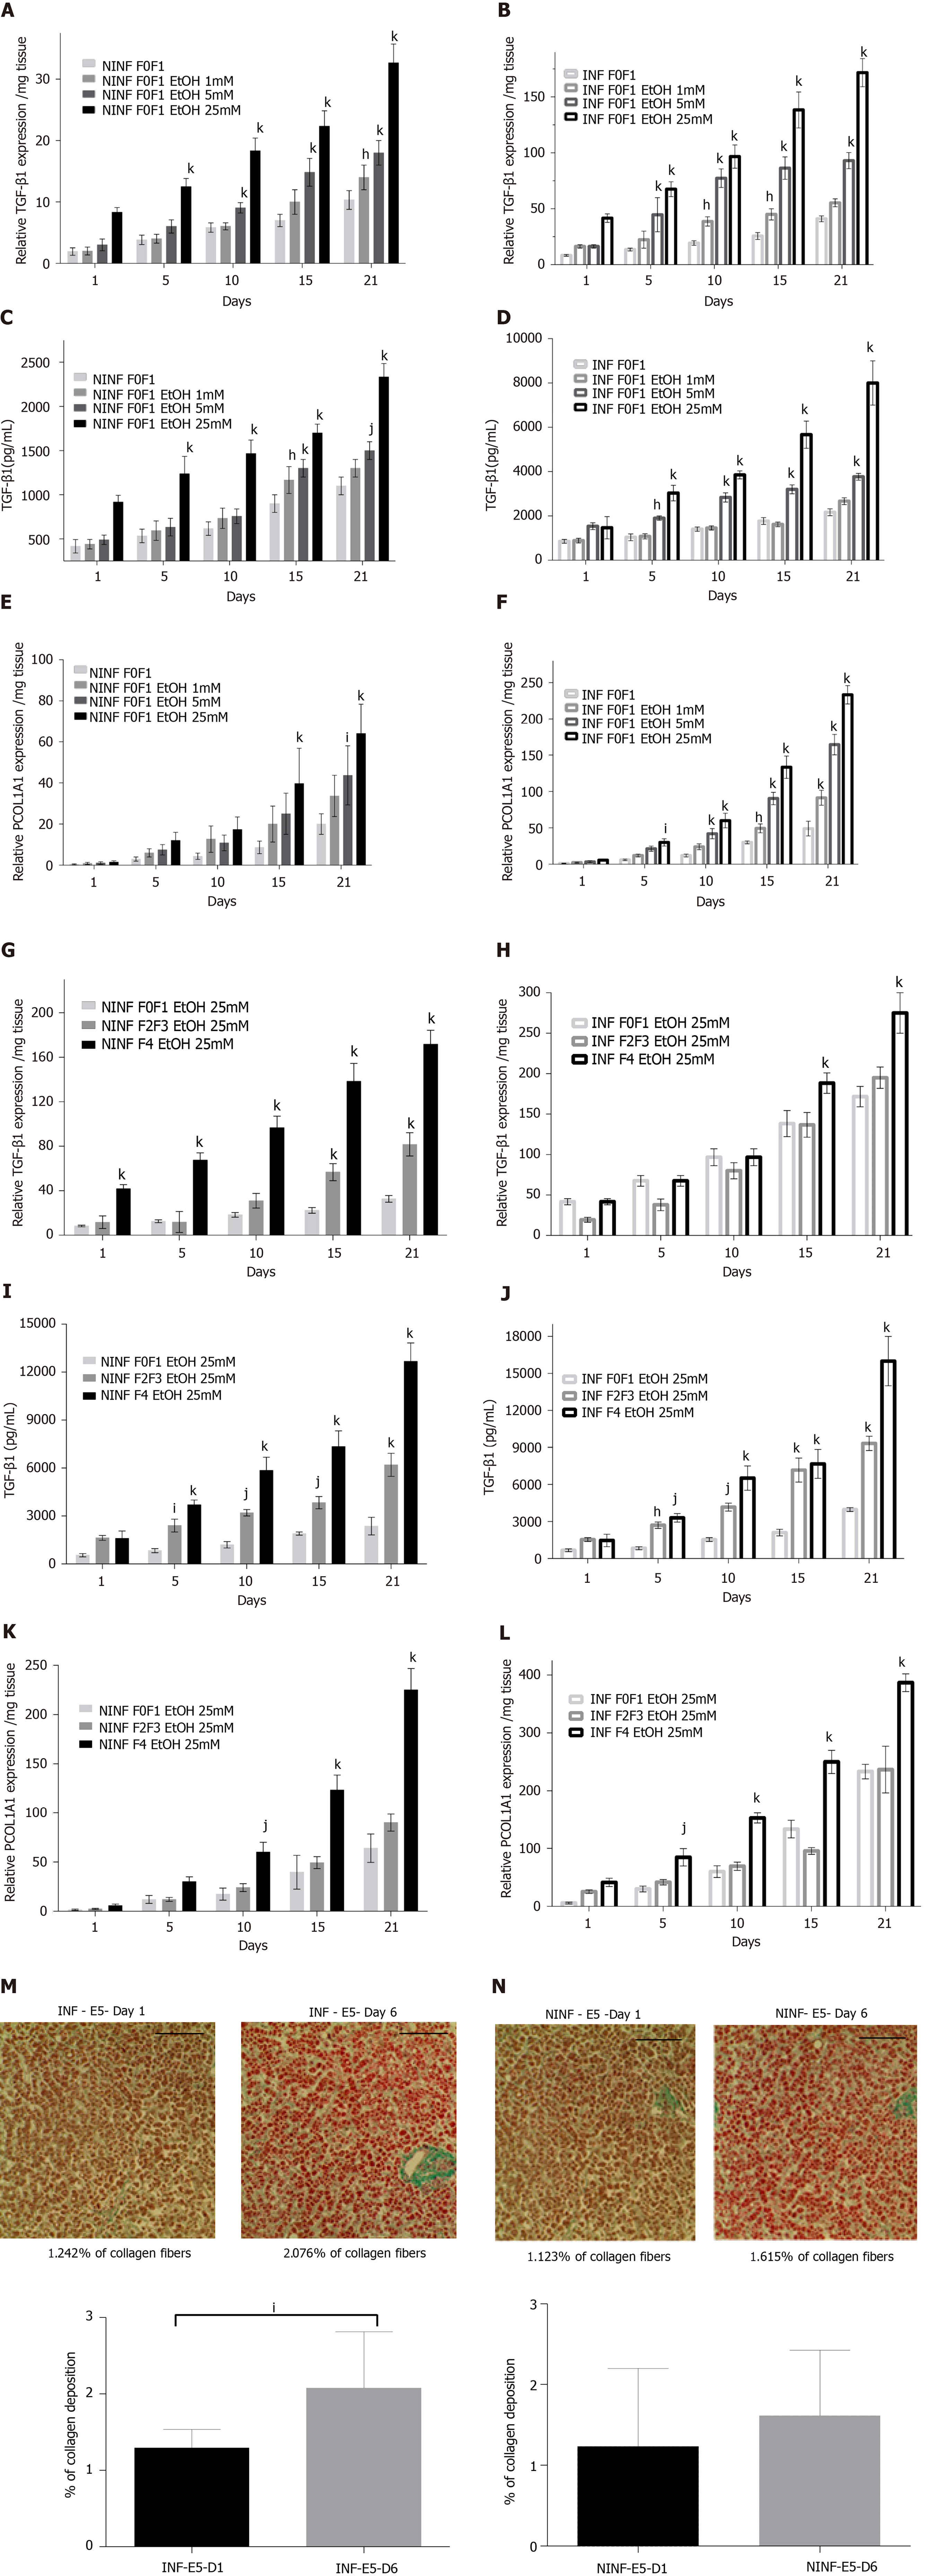
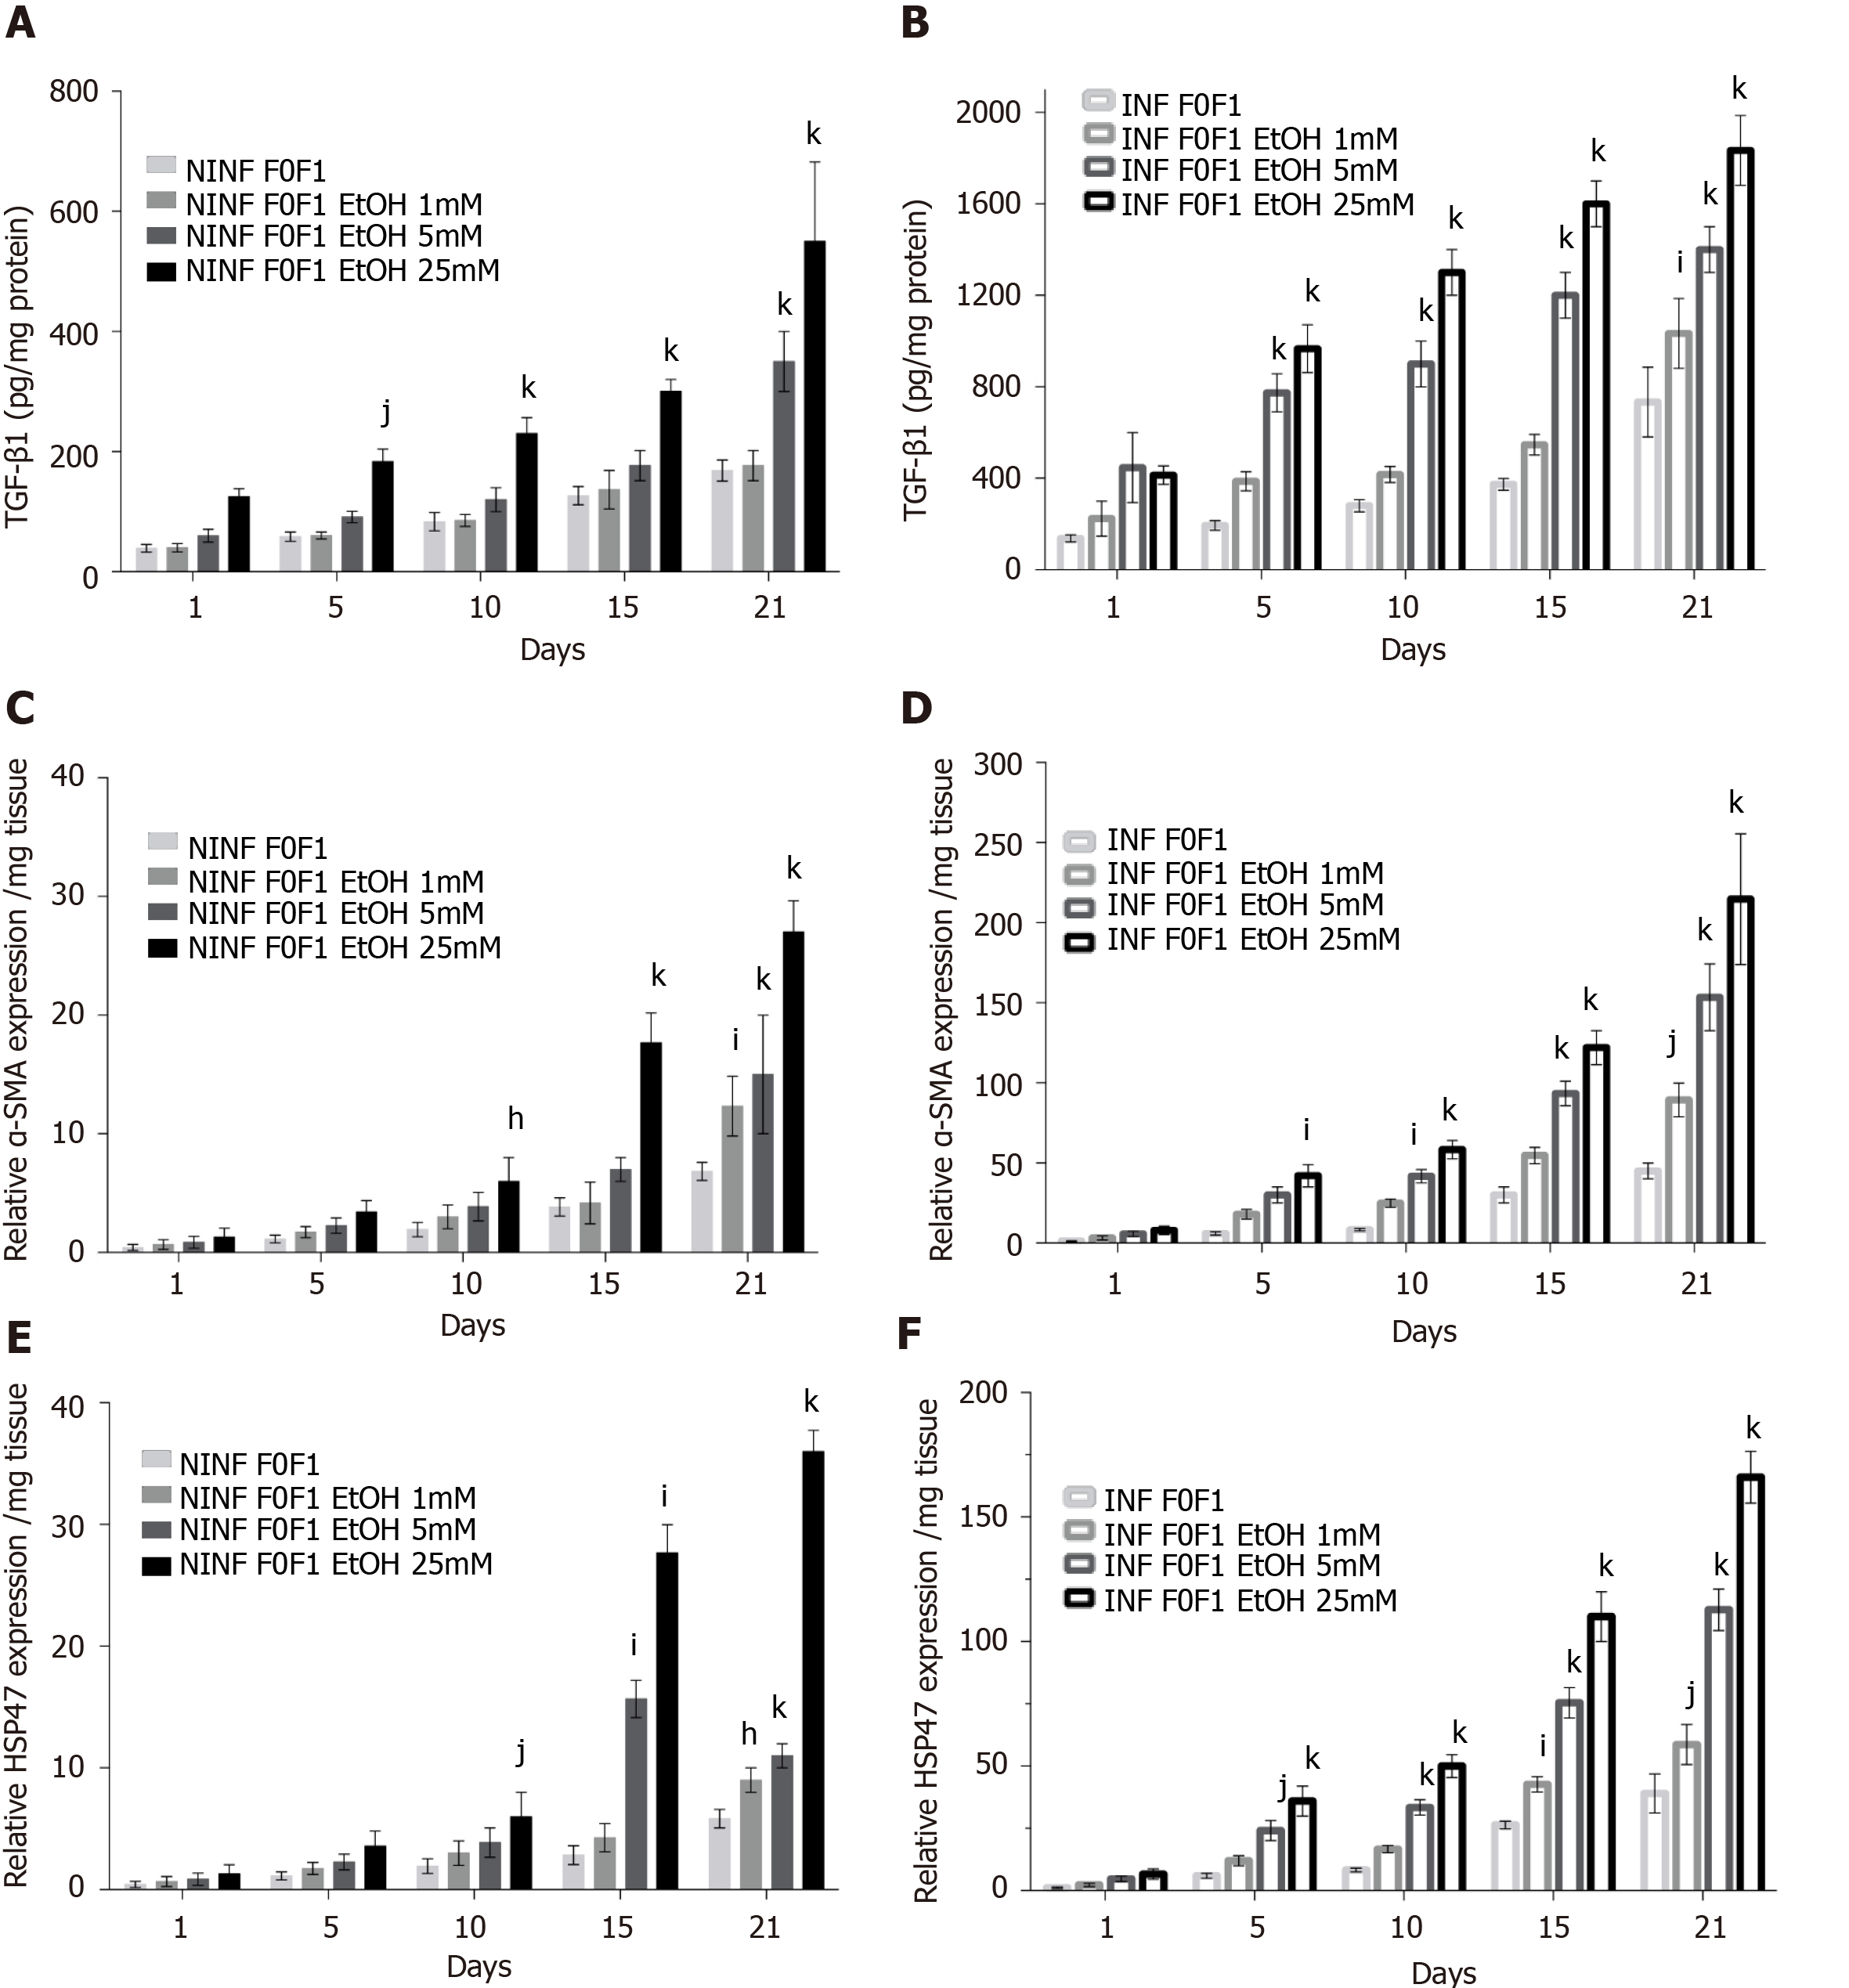
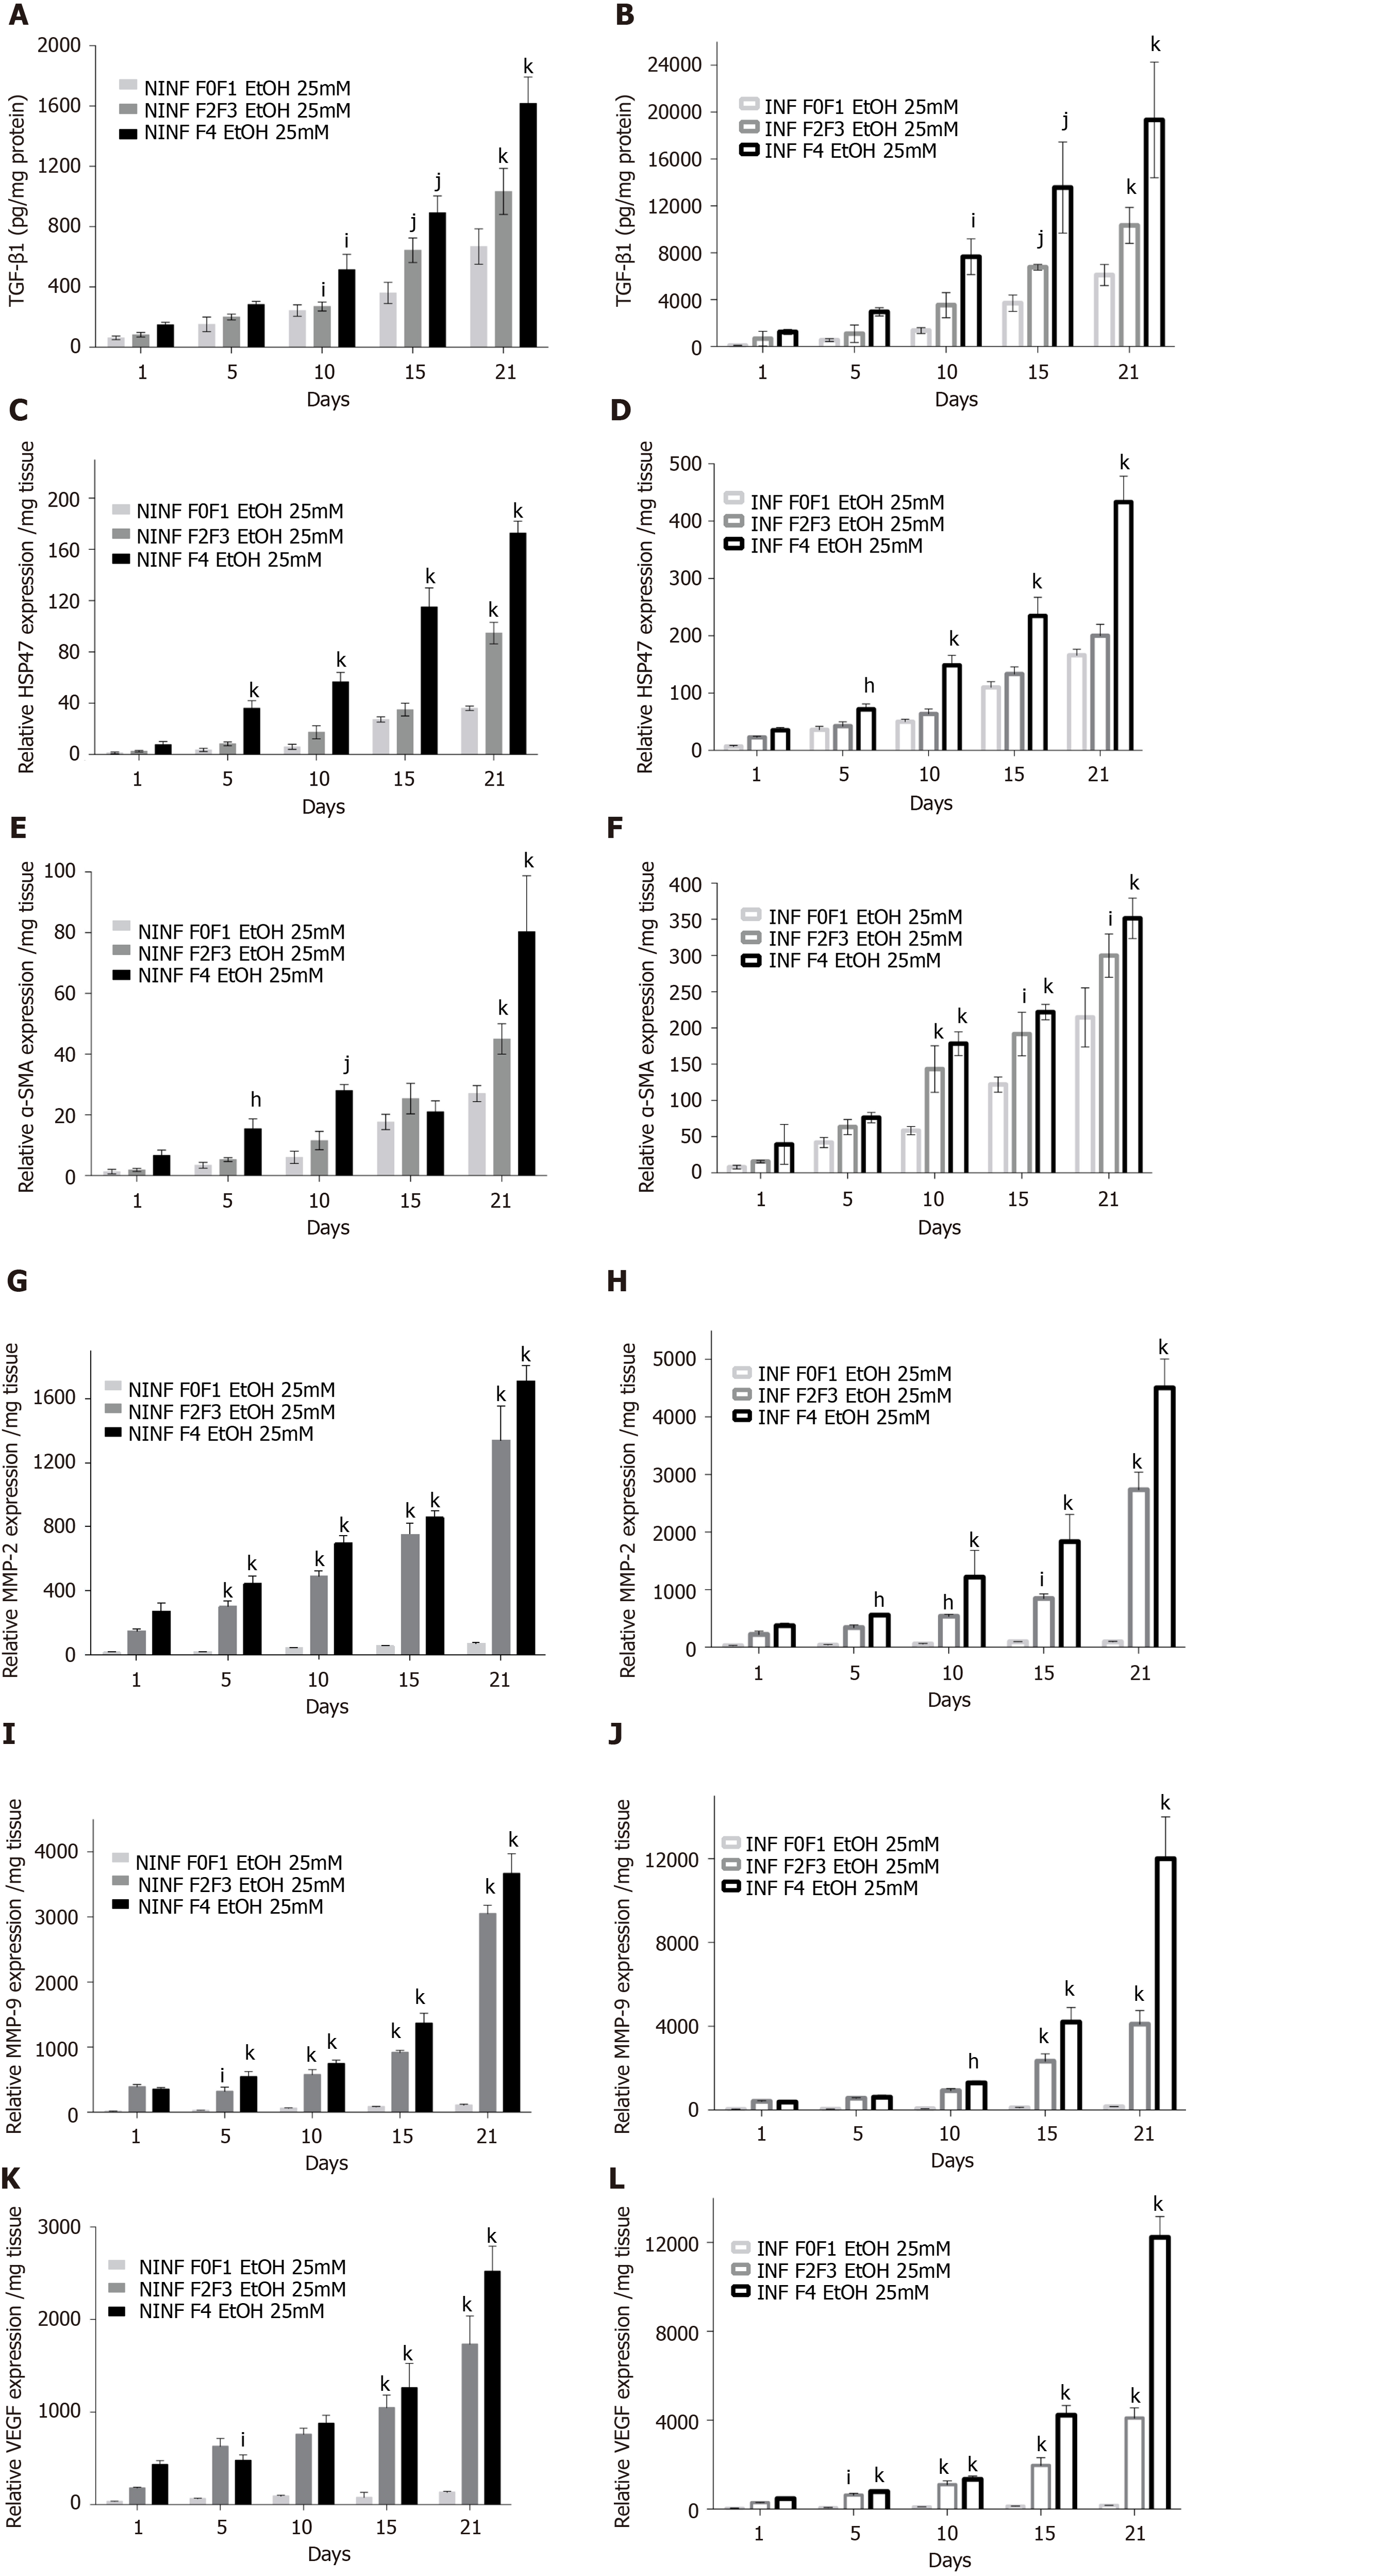
Exposition of LS cultures to ethanol: A model of the alcoholic liver disease: The effect of EtOH exposure on LS cultures was estimated using non-fibrotic (F0-F1) HCV infected or non-infected LS cultures (Figure 8A-F and Figure 9) and fibrotic (F2-F4) HCV infected or non-infected LS cultures (Figure 8G-L) and Figure 10A-L). One mmol/L, 5 mmol/L or 25 mmol/L of EtOH was added to F0-F1 HCV infected, or non-infected LS cultures (Figure 8A-F). Only the highest concentration of EtOH was studied in fibrotic (F2-F3 and F4) non-infected or HCV-infected LS cultures, (Figure 8G-L and Figure 10A-L) respectively. During the follow-up studies (Figure 8A-F), EtOH enhanced the RNA expression of fibrosis markers in a dose-dependent manner in F0-F1 LS cultures. Increased expression of TGF-β1, Procol1A1 RNA was further detected in F0-F1 infected LS (Figure 8B, D and F, Figure 9B, Figure 10B), compared to non-infected LS (Figure 8A, C and E, Figure 9A, Figure 10A). Similar results were found in fibrotic F2-F4 LS (Figure 8G-L, Figure 10A-L). Interestingly, there was no significant increase in Procol1A1 or α-SMA RNA expression in F0-F1 non-infected LS except on day 21 when 25 mmol/L of EtOH was added to the culture (Figure 8E and Figure 9C, respectively). However, a significant dose-dependent increase of the Procol1A1 and α-SMA RNA expression occurred whatever the dose of EtOH added to F0-F1 infected LS cultures (Figure 8F, Figure 9D). There was a dose-dependent increase in the RNA expression of the other fibrosis markers such as α-SMA (Figure 9C and D; Figure 10E and F), and HSP47 (Figure 9E and F, Figure 10C and D) with the addition of EtOH in F0-F1 to F4 infected LS which was less marked in F0-F1 to F4 non-infected LS. Analysis of F0-F1 to F4 HCV non-infected or infected LS showed a significant dose-dependent increase in MMP-2, MMP-9, and VEGF expressions in response to EtOH (Figure 10G-L). Masson’s trichrome staining showed a significant increase in collagen fibers (%) between day 1 (1.242% of collagen) and day 6 (2.076% of collagen) in F0-F1 HCV infected LS treated with 5 mmol/L of EtOH (Figure 8M) but not in F0-F1 non-infected LS with the same treatment (Figure 8N). Picro Sirius red staining confirmed the significant increase in collagen fibers (%) between day 1 (0.55% of collagen) and day 6 (1.53% of collagen) in F0-F1 HCV infected LS treated with 5 mmol/L of EtOH compared to non-treated LS (data not shown).
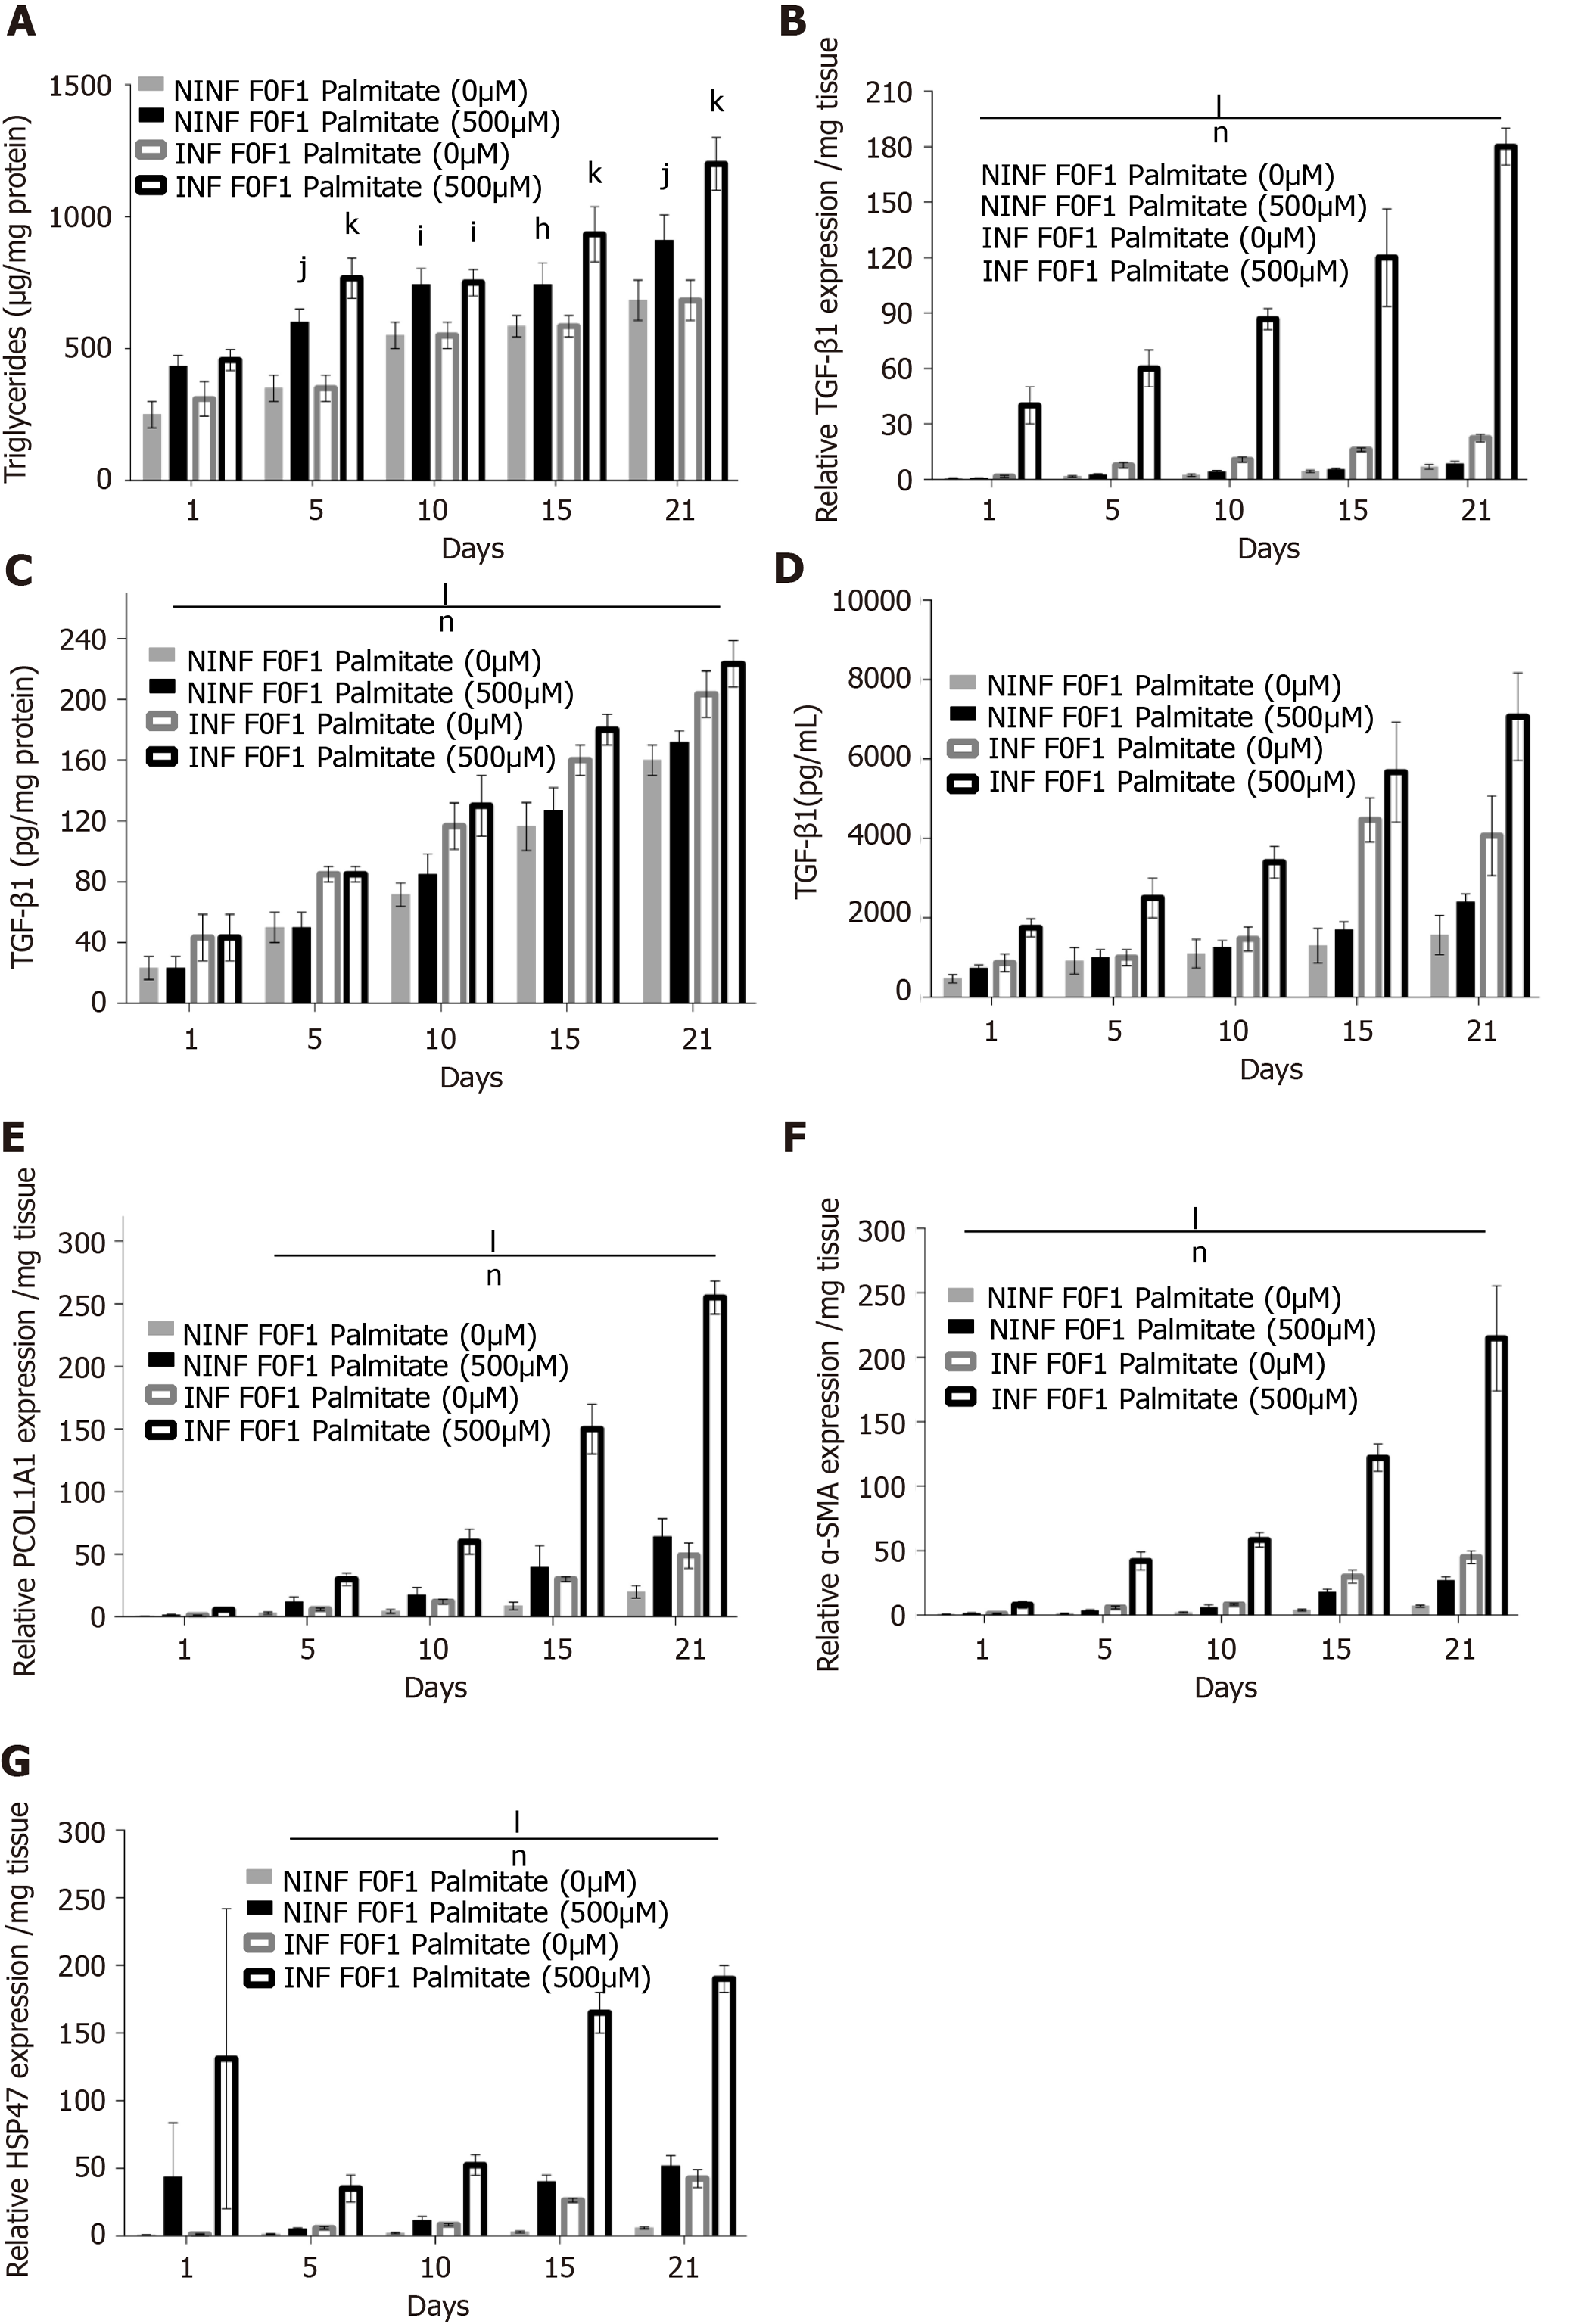
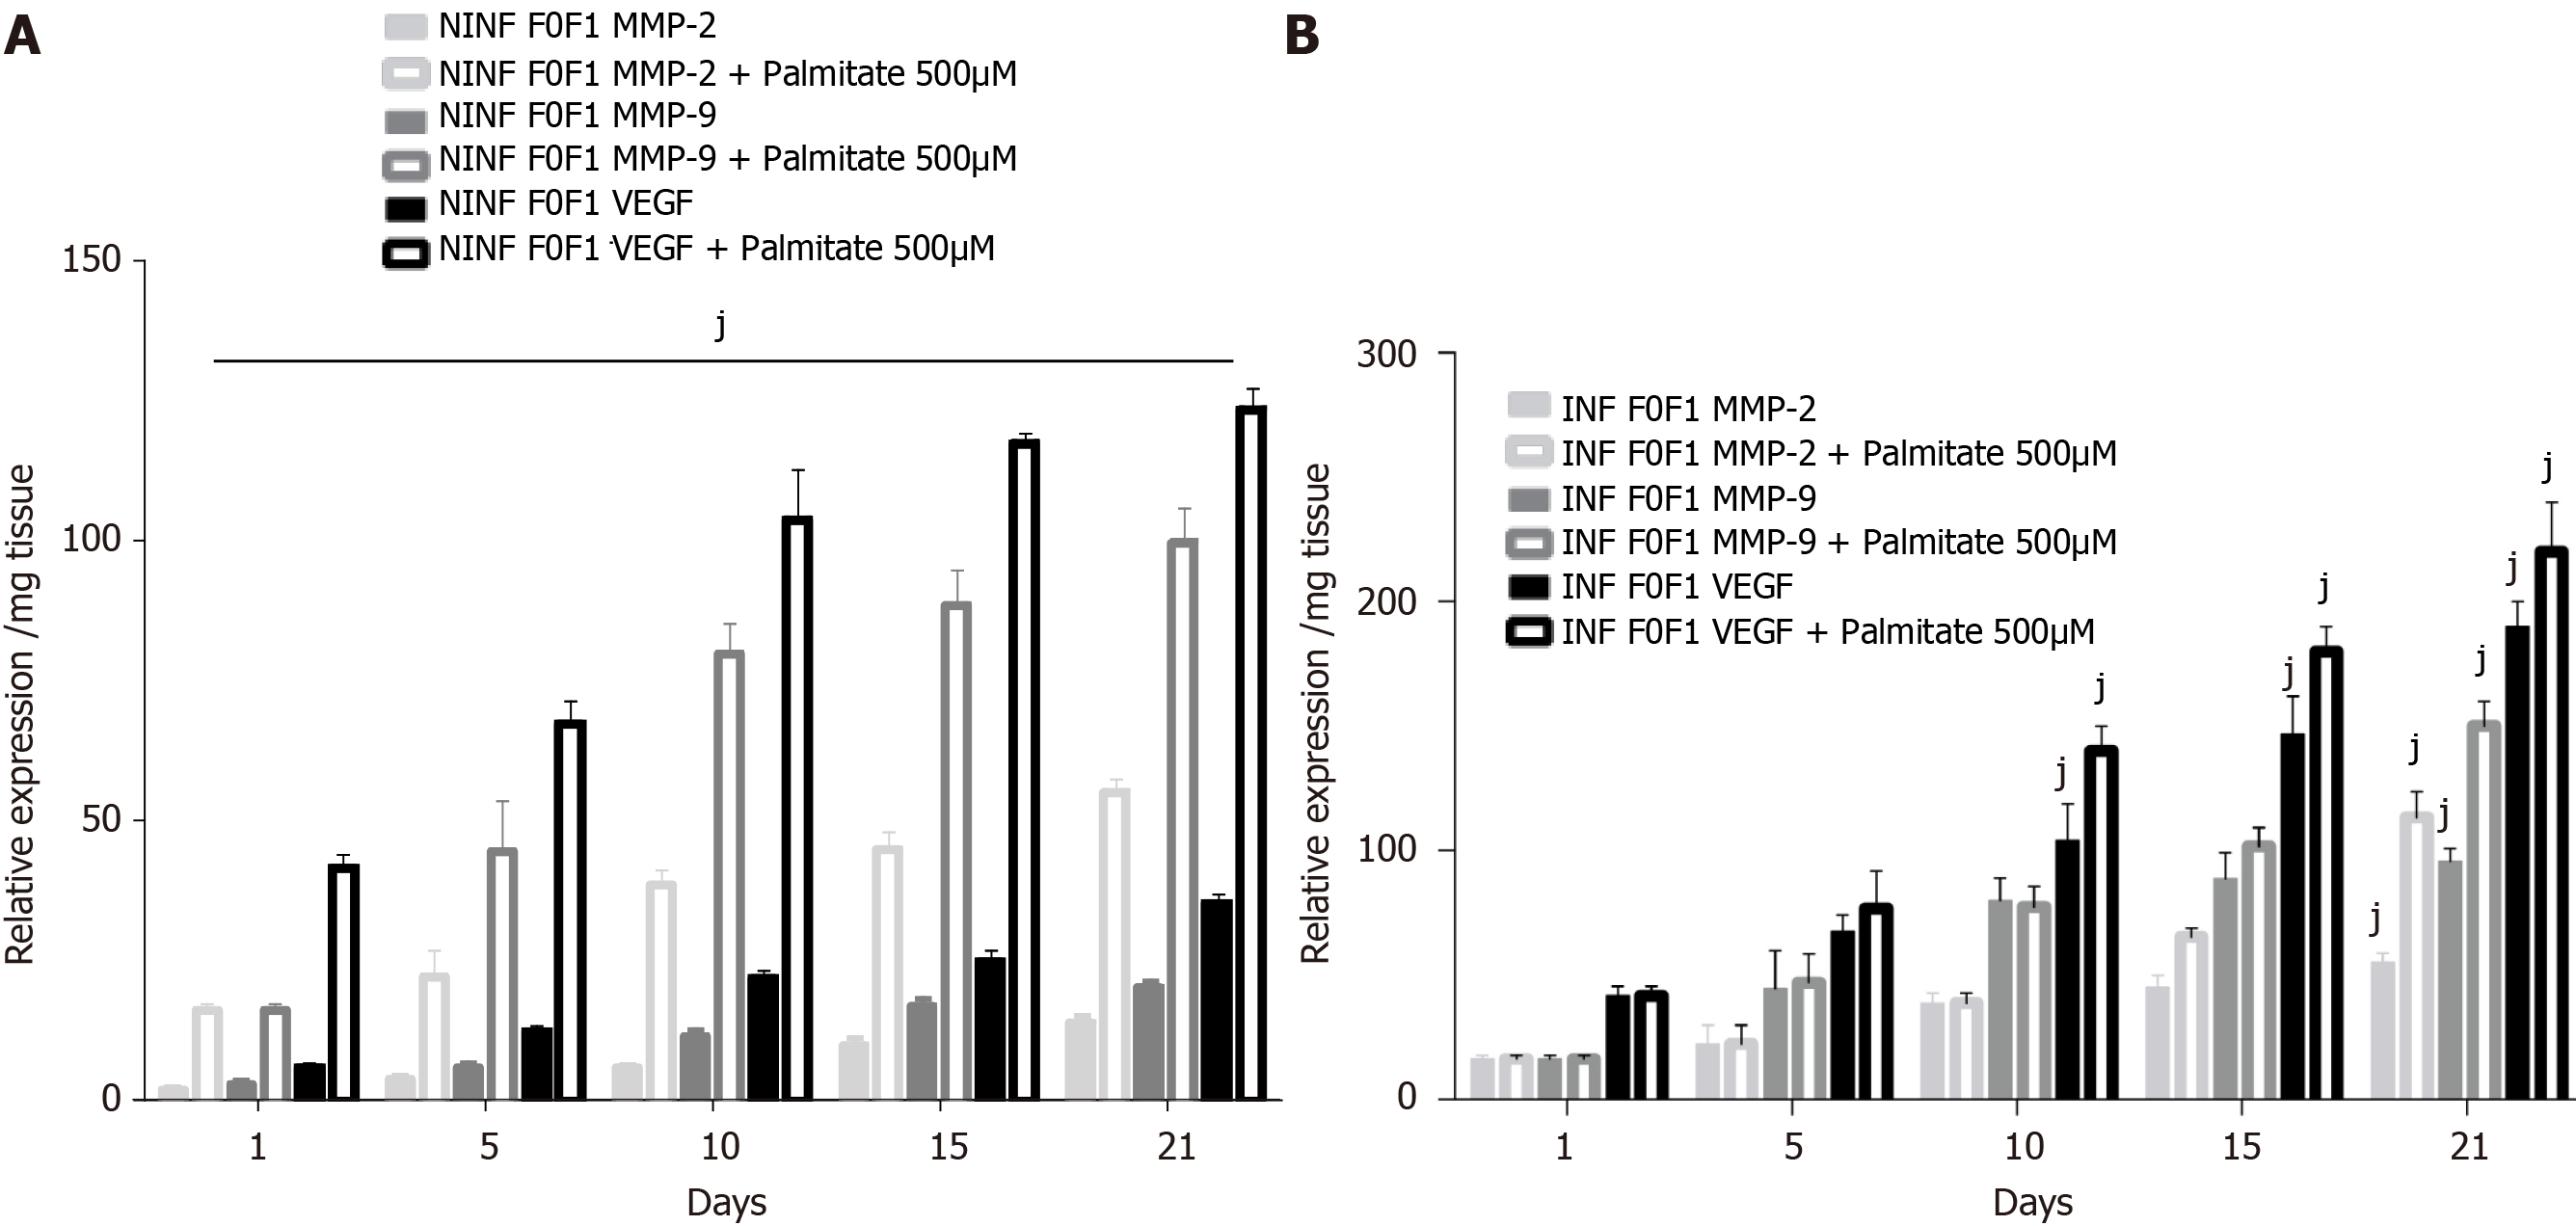
Exposition of LS cultures to palmitate: a model of NASH. To imitate NASH, non-fibrotic (F0-F1) LS cultures infected (or not infected) with HCV were exposed to 500 µmol/L of palmitate (Figure 11). More marked triglyceride synthesis was noted in F0-F1 palmitate treated HCV-infected LS cultures, than in F0-F1 untreated non-infected LS cultures (Figure 11A). The F0-F1 infected LS cultures treated with palmitate demonstrated more marked expression of the fibrotic markers such as TGF-β1 (Figure 11B), intracellular expression of TGF-β1 (Figure 11C), and secretion of the extracellular TGF-β1 (Figure 11D). A similar increase was observed with Procol1A1, α-SMA, and HSP47 (Figure 11E-G) on day 21. The expression of markers (RNA) involved in liver fibrolysis, (MMP-2, -9), and VEGF increased significantly in both F0-F1 non-infected LS cultures treated or not with palmitate (Figure 12A). But, the treatment of F0-F1 non-infected LS cultures with palmitate showed a greater significant increase of the expression of MMP-2, -9, and VEGF compared to those of F0-F1 untreated non-infected LS cultures. The treatment of the F0-F1 infected LS cultures with palmitate, increased significantly VEGF, MMP-2, and MMP-9 from day 10, 15, and day 21 respectively (Figure 12B). Fibrotic marker expression increased both in F0-F1 LS cultures HCV infected or non-infected treated with palmitate but with a greater increase in F0-F1 HCV infected LS treated with palmitate.
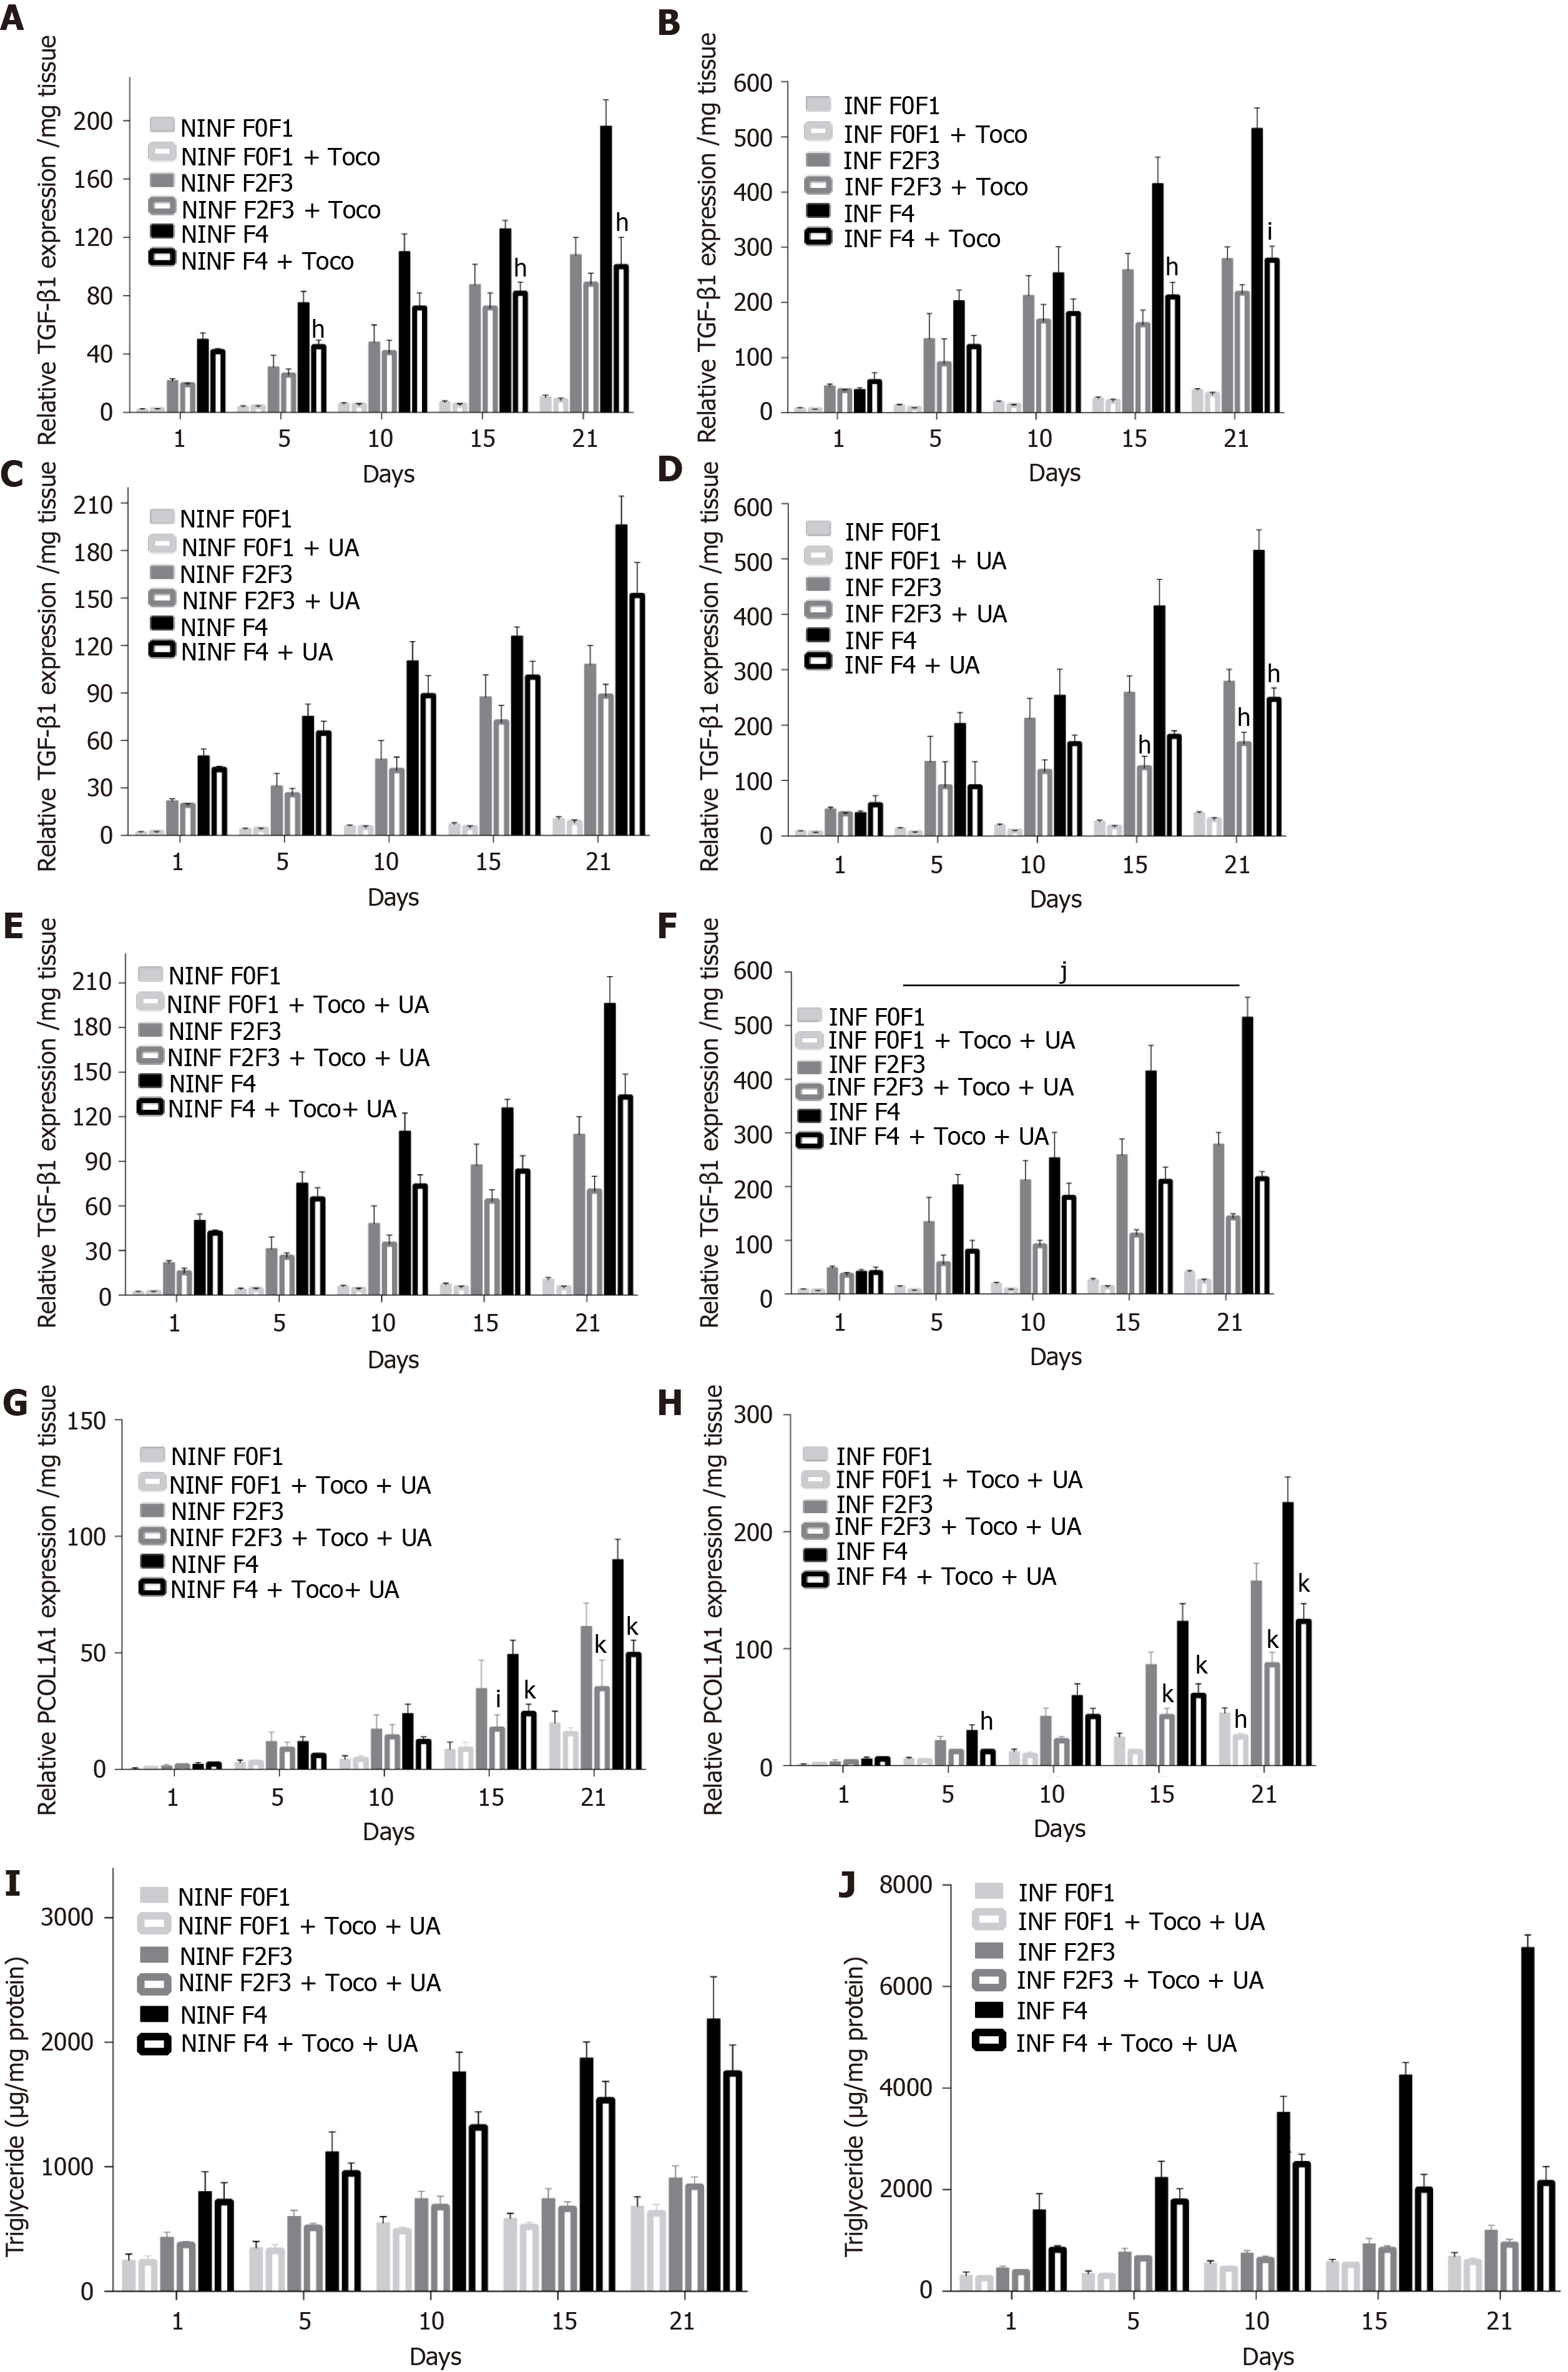
To validate the LS culture as a model for drug screening, the “hepatoprotective” (UCDA) and “anti-fibrotic (Toco) drugs were tested on non-fibrotic (F0-F1), or fibrotic (F2-F3, F4) LS cultures, infected or non-infected with HCV. UCDA and Toco were dosed according to the standard of care in humans (Figure 13). On day 0, LS cultures were infected with HCVcc Con1/C3 (MOI = 0.1) and treated either with daily doses of UCDA and /or with Toco for up to day 21.
During the 21-days long follow-up studies of F0-F1, F2-F3, and F4, LS cultures, a significant, 25% to 50%, reduction in TGF-β1 RNA expression was only identified in F4 LS cultures treated with Toco, from day 5 and day 10 of the culture in non-infected and HCV infected LS cultures, respectively (Figure 13A and B). Treatment with UCDA did not induce a significant reduction in TGF-β1 RNA expression in any non-infected F0-F4 LS cultures (Figure 13C). Interestingly, from day 15, at least a two-fold reduction in TGF-β1 RNA expression, at least, F2-F3, and F4 infected LS cultures was observed (Figure 13D). There was no change in TGF-β1 RNA expression in non-infected LS treated with both UCDA and Toco, whatever the stage of disease (Figure 13E). TGF-β1 RNA expression in F2-F3 and F4 infected LS cultures on days 5 and 15 was reduced by nearly two fold. On day 21, TGF-β1 RNA expression in F4 LS cultures were reduced 2.5 fold (Figure 13F). During the 21-days follow-up studies of infected and non-infected F0-F1, F2-F3, and F4 LS cultures treated with both UCDA and Toco, procollagen1A1 expression was significantly reduced in non-infected and infected F0F1- F4 LS cultures compared to untreated cultures from day 15 (Figure 13G and H). In particular, the significant reduction of procollagen1A1 RNA expression (around two-fold) in treated F2-F3 infected LS cultures was observed from day 10 and from day 15 for treated F4 infected LS cultures. Triglyceride production in HCV non-infected and infected LS from F0-F1, F2-F3 and F4 LS cultures was significantly reduced by the combination treatment from day 10 in F4 HCV non-infected LS cultures (Figure 13I) and from day 1 in F4 HCV infected LS cultures (Figure 13J).
For the first time, different stages of human liver fibrogenesis were investigated ex vivo and for a relatively long period. Indeed, liver tissue slices remained viable for at least 21 days, as shown by the secretion of albumin and urea, the percentage of ATP production and LDH release observed during the kinetic experiment. However, the secretion of albumin and urea was lower than that in micropatterned hepatocyte co-cultures models[27]. Both fibrotic (stages F2-F4) and non-fibrotic (stages F0-F1) liver samples remained viable ex vivo for this period. Twenty one-day follow-up studies of LS cultures significantly improved the investigation of fibrogenesis in general, and fibrotic biomarkers, in particular. We obtained RT-qPCR analyses of the biomarkers (TGF-β1, procol1A1, MMP-2, MMP-9, α-SMA, HSP47, and VEGF) involved in molecular fibrogenesis, and estimation of anti-fibrotic drugs potency, in both non-fibrotic (F0-F1) and fibrotic livers samples (F2-F3, F4). Additional evaluation of fibrotic biomarkers performed by ELISA, histology, and by Western blotting supported RT-qPCR data. With this ex vivo model, sustaining hepatocyte-specific gene expression for 21 days, we induced molecular fibrogenesis using HCV, EtOH, or palmitate, thus mimicking human viral, alcoholic, and NASH liver diseases.
The most important property of this LS model is cell viability for a relatively long period of time. The expression of diverse biomarkers of fibrosis was analyzed in the presence of HCV, EtOH or palmitate using non-fibrotic F0-F1 LS cultures. The markers of fibrogenesis and triglyceride production were found to be increased in both non-infected and infected LS cultures. The addition of either EtOH or palmitate significantly increased the expression of fibrotic biomarkers. Moreover, this increase was found to be greater in HCV infected than in non-infected LS with increased triglyceride production higher in infected LS. HCV infection seemed to enhance fibrosis marker expression in the presence of ethanol or palmitate.
It is important to mention, that TGF-β1 expression, the principal marker of fibrogenesis, was higher in non-fibrotic (F0-F1) LS cultures cultivated in the presence of HCV and /or EtOH, or palmitate treatment. This effect was greater in fibrotic (F2-F4) LS cultures. Moreover, when fibrotic LS cultures were exposed to EtOH, a significant increase of α-SMA, HSP47, procol1A1 expression as well as the other markers involved in liver fibrolysis such as (MMP-2, -9) and VEGF was identified in both non-infected and infected liver slices.
The increased expression of fibrogenesis biomarkers was throughout the twenty-one days follow-up studies. RT-qPCR showed that the effect was more marked in LS cultures obtained from livers with advanced stages of fibrosis. This was confirmed for the following biomarkers: TGF-β1, α-SMA, HSP47, Procol1A1, MMP-2, -9, and VEGF. These results were further confirmed by Western blot analyses for TGF-β1, α-SMA, Col1A1, HSP47, MMP-2, -9, and VEGF. Thus, analyses of LS cultures revealed, that the progression of fibrosis is associated with an increase in the expression of certain biomarkers, in particular, α-SMA expression, and resembles a snowball effect, as shown by histochemistry results with a significant increase of collagen production in F0-F1 EtOH treated HCV infected LS on day 6 compared to day 1. As might be expected, a more marked fibrogenesis reaction was observed in fibrotic (F2-F3, F4) LS cultures, than that in non-fibrotic (F0-F1) LS cultures.
Thus, the LS model well responded to fibrotic inducers and, then, released a set of biomarkers that are usually detected during clinical studies in patients with fibrosis. In particular, this included TGF-β, α-SMA, Procollagen1A1, MMP-2, MMP-9, VEGF, the markers of liver fibrogenesis, whatever the origin of fibrosis. This study also showed the synergistic effect of liver comorbidities (virus, alcohol, and fat) on fibrogenesis and its consequences[28,29]. Finally, the efficacy of hepatoprotective[28] or anti-fibrotic drugs[29] was suggested in the LS cultures model. Recently, Wu et al[10] demonstrated that Human liver slices collected from resected livers could be maintained in ex vivo culture over a two-week period.
Several anti-fibrotic drugs are now in development[27-29], following validation in animal models[30], in particular, target inhibitors for the treatment of NASH-related fibrosis. This includes NGM282, an FGF19 analog that reduces steatosis, biliary acids injury, and lipotoxicity via 2 receptors, the MGL-3196, a THR-β1 agonist that decreases LDL-cholesterol, triglyceride and fatty liver, thus lipotoxicity[30,31]. Randomized controlled trials are known to take time and the results may be disappointing despite the encouraging results of the recent REGENERATE trial, in obeticholic acid[32-36]. For example, Cenicriviroc, a dual CCR2/CCR5 antagonist with positive results in mice, did not result in any significant reduction in NASH-related fibrosis after 2 years of studies[37], and Selonsertib, an ASK1 inhibitor with putative anti-fibrotic properties, was recently withdrawn in the Stellar-3 and Stellar-4 Randomized controlled trials (Gilead, Press release, April 2019).
Although randomized clinical trials are the best way to prove the drug efficacy of a drug, there are several important limitations to this approach including the need for serial liver biopsies, suboptimal dosage schedules, or placebo double-blinded controls with a single drug. All of this can require about three years. With existing LS models, anti-fibrotic drug testing can be performed for 2-3 weeks (wk). Testing is possible for single drugs, drug combinations with similar or different agents, dose effects, stability in the liver, etc…
In the present study, we used our 3D LS ex vivo models to investigate the anti-fibrotic properties of two drugs, being tested in clinical trials. Ursodeoxycholic acid is indicated in the treatment of primary biliary cirrhosis and dissolve radiolucent gallstones in patients with a functioning gallbladder. Alpha-Tocopherol (Toco, vitamin E) is tested currently in patients with high cholesterol and NASH. A meta-analysis in a sub-group analysis of random clinical trials has shown that alpha-tocopherol has an anti-fibrotic effect compared to UCDA[36,38]. These drugs were tested alone and in a combination with the LS model. The combined treatment is not tested during the first phase of the clinical trials. The half-life of UCDA is 3.5 to 5.8 days and that of Toco is 44.5 hours. Patients must be treated daily with UCDA for 2 to 3 months and for 96 wk with Toco to obtain some clinical effects. In the LS model, Toco treatment only reduced the TGF-β1 expression in non-infected and infected LS with stage F4 after day 10. After day 15, UCDA reduced TGF-β1 expression in stage F2 to F4 infected LS. It is interesting to note that with a combination of both drugs, TGF-β1 and Procol1A1 expression was reduced significantly in LS. The level of TGF-β1 decreased nearly 2 fold in F2-F3 infected LS on day 15 and 2.5 fold on day 21, in F4 infected LS cultures. A significant reduction in procol1A1 RNA expression was found with the combination treatment in F2-F3, and in F4 infected and non-infected LS cultures with a two-fold decrease on days 15 and 21. Obviously, to confirm the results, the other dosages and proportions of drugs (in combination) should be tested. In fact, this model showed a clear decrease in the main hepatic fibrogenesis biomarker TGF-β1, in the presence of a combination of anti-fibrotic drugs (UCDA and Toco) in F2-F4 infected LS cultures with a significant decrease in both triglyceride production and Procol1A1 expression. Procol1A1 expression was significantly reduced in F2-F3, and F4 infected or non-infected LS cultures during combined treatment (UCDA and Toco). Thus, these data provide a proof of concept that this proposed 3D ex vivo model effectively allows a rapid evaluation of new anti-fibrotic drugs.
In summary, the 3D ex vivo LS model provides hepatocyte-specific gene expression for 21 days, and effectively reproduces liver fibrogenesis related to HCV infection, EtOH, or lipids exposure, thus, mimicking human viral, alcoholic, and NASH liver diseases. Our study is the proof of concept that this relatively easy model can be used to study human liver fibrogenesis of different origins and evaluate the potency of new anti-fibrotic therapies that are currently under development. In particular, this system might estimate unpredictable side effects when testing certain drug combinations.
Liver fibrosis is frequently associated with viral infection [Hepatitis C virus (HCV) and Hepatitis B virus] infection, chronic inflammation, and excessive alcohol consumption. Despite effective antiviral treatment, morbidity and hepatitis-related mortalities are still increasing. Moreover, the number of non-viral liver diseases such as nonalcoholic steatohepatitis and alcoholic liver disease is steadily growing.
In previous studies, we developed a three dimensional (3D) ex vivo model of HCV replication using human liver slice cultures that were followed for 10 days to evaluate a new antiviral drug.
We aimed to establish a 3D ex vivo liver slice model viable in vitro for 21 days allowing us to examine human liver fibrogenesis by fibrosis inducers and anti-fibrotic therapies.
The adult human liver tissue samples from twenty patients were collected after liver resection, and divided into three groups according to their METAVIR score (F): Non-fibrotic F0-F1, obtained during surgery for colorectal cancer liver metastases or fibrotic ranging from F2 to F4. HCV infection, alcohol (ethanol stimulation), and steatosis (palmitate stimulation) were examined in non-fibrotic F0-F1 human liver slices (HLS) compared to fibrotic (F2 to F4) liver slices (FLS) infected (or not) with HCV [Con1/C3 (genotype1b)] (INF). HLS of 350 µm (2.7 × 10⁶ cells per slice) were cultivated for up to 21 days. At day 0, either ursodeoxycholic acid (only choleretic and hepatoprotective properties) and/or α-tocopherol (Toco, anti-oxidant properties which could reduce fibrosis progression) were added to standard of care concentrations on HLS and FLS. The following fibrosis markers expression were assayed in HLS, in FLS and in INF FLS, [tumor growth factor-beta (TGF-β1), Hsp47, Alpha smooth muscle actin, Procol1A1, Matrix metalloproteinases 2, 9 (MMP-2, 9), Vascular endothelial growth factor] and checked by real-time reverse transcription-quantitative polymerase chain reaction and the triglyceride production by enzyme-linked immunosorbent assay assays.
Here, for the first time, human LS cultures (stages F0-F4) were successfully maintained and evaluated for 21 days allowing to explore molecular fibrogenesis in more detail including the role of important factors such as HCV infection, ethanol (EtOH), or steatosis, three of the main causes of liver injury in clinical practice. In addition, it was demonstrated that LS cultures are efficient instruments to study anti-fibrotic drugs and their combination. We obtained real-time reverse transcription-quantitative polymerase chain reaction analyses of the biomarkers (TGF-β1, procol1A1, MMP-2, MMP-9, Alpha smooth muscle actin, HSP47, and Vascular Endothelial Growth Factor) involved in molecular fibrogenesis, and estimation of anti-fibrotic drugs potency, in both non-fibrotic (F0-F1) and fibrotic livers samples (F2-F3, F4). Expression of the fibrosis biomarkers and the progression to steatosis (estimated by triglyceride production) increased with the addition of HCV and /or EtOH or palmitate. We observed a significant decrease in both of the expression of TGF-β1, and procollagen1A1 as well as in the production of triglycerides observed in a combined anti-fibrotic treatment applied to the F2-F4 LS cultures infected with HCV.
The 3D ex vivo LS model provides hepatocyte-specific gene expression for 21 days, and effectively reproduces liver fibrogenesis related to HCV infection, EtOH, or lipids exposure, thus, mimicking human viral, alcoholic, and nonalcoholic steatohepatitis liver diseases. Our study is the proof of concept that this relatively easy model can be used to study human liver fibrogenesis of different origins and evaluate the potency of new anti-fibrotic therapies that are currently under development. In particular, this system might estimate unpredictable side effects when testing certain drug combinations.
Using the ex vivo model of human liver slice culture, the perspectives would be to evaluate the potency of new anti-fibrotic therapies alone or in combination and to study the immune components of liver disease.
The authors are deeply indebted to the patients for their essential contribution to the work. We would like to acknowledge the members of the Departments of Digestive Surgery (Groupe Hospitalier La Pitié Salpétrière and Groupe Hospitalier Cochin, Assistance Publique–Hôpitaux de Paris (AP-HP), Paris, France) and the Department of Hepatology (Groupe Hospitalier Cochin, AP-HP, Paris, France), Dr. Jérôme Guéchot (Hôpital Saint-Antoine, Pôle de Biologie Médicale et Pathologie, AP-HP, Paris, France), Dr. Phuong Nhi Bories (Groupe Hospitalier Cochin, Service de Biochimie, AP-HP, Paris, France), the staff of Genomic (GENOM’IC) and Histology (HISTIM) facilities (Cochin Institute, Paris, France) for valuable assistance. We are grateful to Dr. Matthew Albert for the critical reading of the manuscript. Dr. Daria M. Kartasheva-Ebertz received a Ph.D. fellowship from AP-HP, Paris, France.
Manuscript source: Invited manuscript
Specialty type: Gastroenterology and hepatology
Country/Territory of origin: France
Peer-review report’s scientific quality classification
Grade A (Excellent): 0
Grade B (Very good): 0
Grade C (Good): C
Grade D (Fair): 0
Grade E (Poor): 0
P-Reviewer: Balaban YH S-Editor: Zhang L L-Editor: A P-Editor: Wang LL
| 1. | Mehal WZ, Iredale J, Friedman SL. Scraping fibrosis: expressway to the core of fibrosis. Nat Med. 2011;17:552-553. [RCA] [PubMed] [DOI] [Full Text] [Full Text (PDF)] [Cited by in Crossref: 172] [Cited by in RCA: 160] [Article Influence: 11.4] [Reference Citation Analysis (0)] |
| 2. | Blachier M, Leleu H, Peck-Radosavljevic M, Valla DC, Roudot-Thoraval F. The burden of liver disease in Europe: a review of available epidemiological data. J Hepatol. 2013;58:593-608. [RCA] [PubMed] [DOI] [Full Text] [Cited by in Crossref: 879] [Cited by in RCA: 909] [Article Influence: 75.8] [Reference Citation Analysis (0)] |
| 3. | Karsdal MA, Manon-Jensen T, Genovese F, Kristensen JH, Nielsen MJ, Sand JM, Hansen NU, Bay-Jensen AC, Bager CL, Krag A, Blanchard A, Krarup H, Leeming DJ, Schuppan D. Novel insights into the function and dynamics of extracellular matrix in liver fibrosis. Am J Physiol Gastrointest Liver Physiol. 2015;308:G807-G830. [RCA] [PubMed] [DOI] [Full Text] [Cited by in Crossref: 170] [Cited by in RCA: 209] [Article Influence: 20.9] [Reference Citation Analysis (0)] |
| 4. | Fabregat I, Moreno-Càceres J, Sánchez A, Dooley S, Dewidar B, Giannelli G, Ten Dijke P; IT-LIVER Consortium. TGF-β signalling and liver disease. FEBS J. 2016;283:2219-2232. [RCA] [PubMed] [DOI] [Full Text] [Cited by in Crossref: 319] [Cited by in RCA: 479] [Article Influence: 53.2] [Reference Citation Analysis (0)] |
| 5. | van Agthoven M, Metselaar HJ, Tilanus HW, de Man RA, IJzermans JN, Martin van Ineveld BM. A comparison of the costs and effects of liver transplantation for acute and for chronic liver failure. Transpl Int. 2001;14:87-94. [RCA] [PubMed] [DOI] [Full Text] [Cited by in Crossref: 26] [Cited by in RCA: 23] [Article Influence: 1.0] [Reference Citation Analysis (0)] |
| 6. | Fisher RL, Vickers AE. Preparation and culture of precision-cut organ slices from human and animal. Xenobiotica. 2013;43:8-14. [RCA] [PubMed] [DOI] [Full Text] [Cited by in Crossref: 25] [Cited by in RCA: 30] [Article Influence: 2.3] [Reference Citation Analysis (0)] |
| 7. | Westra IM, Oosterhuis D, Groothuis GM, Olinga P. The effect of antifibrotic drugs in rat precision-cut fibrotic liver slices. PLoS One. 2014;9:e95462. [RCA] [PubMed] [DOI] [Full Text] [Full Text (PDF)] [Cited by in Crossref: 36] [Cited by in RCA: 43] [Article Influence: 3.9] [Reference Citation Analysis (0)] |
| 8. | Olinga P, Schuppan D. Precision-cut liver slices: a tool to model the liver ex vivo. J Hepatol. 2013;58:1252-1253. [RCA] [PubMed] [DOI] [Full Text] [Cited by in Crossref: 75] [Cited by in RCA: 88] [Article Influence: 7.3] [Reference Citation Analysis (0)] |
| 9. | Parrish AR, Gandolfi AJ, Brendel K. Precision-cut tissue slices: applications in pharmacology and toxicology. Life Sci. 1995;57:1887-1901. [RCA] [PubMed] [DOI] [Full Text] [Cited by in Crossref: 182] [Cited by in RCA: 177] [Article Influence: 5.9] [Reference Citation Analysis (0)] |
| 10. | Wu X, Roberto JB, Knupp A, Kenerson HL, Truong CD, Yuen SY, Brempelis KJ, Tuefferd M, Chen A, Horton H, Yeung RS, Crispe IN. Precision-cut human liver slice cultures as an immunological platform. J Immunol Methods. 2018;455:71-79. [RCA] [PubMed] [DOI] [Full Text] [Cited by in Crossref: 50] [Cited by in RCA: 56] [Article Influence: 8.0] [Reference Citation Analysis (0)] |
| 11. | Lagaye S, Shen H, Saunier B, Nascimbeni M, Gaston J, Bourdoncle P, Hannoun L, Massault PP, Vallet-Pichard A, Mallet V, Pol S. Efficient replication of primary or culture hepatitis C virus isolates in human liver slices: a relevant ex vivo model of liver infection. Hepatology. 2012;56:861-872. [RCA] [PubMed] [DOI] [Full Text] [Cited by in Crossref: 36] [Cited by in RCA: 38] [Article Influence: 2.9] [Reference Citation Analysis (0)] |
| 12. | Lagaye S, Brun S, Gaston J, Shen H, Stranska R, Camus C, Dubray C, Rousseau G, Massault PP, Courcambeck J, Bassisi F, Halfon P, Pol S. Anti-hepatitis C virus potency of a new autophagy inhibitor using human liver slices model. World J Hepatol. 2016;8:902-914. [RCA] [PubMed] [DOI] [Full Text] [Full Text (PDF)] [Cited by in Crossref: 4] [Cited by in RCA: 4] [Article Influence: 0.4] [Reference Citation Analysis (1)] |
| 13. | Poupon R. Ursodeoxycholic acid and bile-acid mimetics as therapeutic agents for cholestatic liver diseases: an overview of their mechanisms of action. Clin Res Hepatol Gastroenterol. 2012;36 Suppl 1:S3-12. [RCA] [PubMed] [DOI] [Full Text] [Cited by in Crossref: 157] [Cited by in RCA: 167] [Article Influence: 12.8] [Reference Citation Analysis (0)] |
| 14. | Chiao TB, Lee AJ. Role of pentoxifylline and vitamin E in attenuation of radiation-induced fibrosis. Ann Pharmacother. 2005;39:516-522. [RCA] [PubMed] [DOI] [Full Text] [Cited by in Crossref: 64] [Cited by in RCA: 49] [Article Influence: 2.5] [Reference Citation Analysis (0)] |
| 15. | Bedossa P, Poynard T. An algorithm for the grading of activity in chronic hepatitis C. The METAVIR Cooperative Study Group. Hepatology. 1996;24:289-293. [RCA] [PubMed] [DOI] [Full Text] [Cited by in Crossref: 2860] [Cited by in RCA: 3082] [Article Influence: 106.3] [Reference Citation Analysis (0)] |
| 16. | Pietschmann T, Kaul A, Koutsoudakis G, Shavinskaya A, Kallis S, Steinmann E, Abid K, Negro F, Dreux M, Cosset FL, Bartenschlager R. Construction and characterization of infectious intragenotypic and intergenotypic hepatitis C virus chimeras. Proc Natl Acad Sci. 2006;103:7408-7413. [RCA] [PubMed] [DOI] [Full Text] [Cited by in Crossref: 602] [Cited by in RCA: 602] [Article Influence: 31.7] [Reference Citation Analysis (0)] |
| 17. | Kawano Y, Cohen DE. Mechanisms of hepatic triglyceride accumulation in non-alcoholic fatty liver disease. J Gastroenterol. 2013;48:434-441. [RCA] [PubMed] [DOI] [Full Text] [Full Text (PDF)] [Cited by in Crossref: 545] [Cited by in RCA: 700] [Article Influence: 58.3] [Reference Citation Analysis (0)] |
| 18. | von Hahn T, McKeating JA. In vitro veritas? J Hepatol. 2007;46:355-358. [RCA] [PubMed] [DOI] [Full Text] [Cited by in Crossref: 11] [Cited by in RCA: 10] [Article Influence: 0.6] [Reference Citation Analysis (0)] |
| 19. | Tzanakakis ES, Hansen LK, Hu WS. The role of actin filaments and microtubules in hepatocyte spheroid self-assembly. Cell Motil Cytoskeleton. 2001;48:175-189. [RCA] [PubMed] [DOI] [Full Text] [Cited by in RCA: 3] [Reference Citation Analysis (0)] |
| 20. | Peshwa MV, Wu FJ, Follstad, B. D, Cerra, F.B., and Hu, W.S. Kinetics of hepatocyte spheroid formation. Biotechnol Prog. 1994;10:460-466. [RCA] [DOI] [Full Text] [Cited by in Crossref: 53] [Cited by in RCA: 46] [Article Influence: 1.5] [Reference Citation Analysis (0)] |
| 21. | Rueden CT, Schindelin J, Hiner MC, DeZonia BE, Walter AE, Arena ET, Eliceiri KW. ImageJ2: ImageJ for the next generation of scientific image data. BMC Bioinformatics. 2017;18:529. [RCA] [PubMed] [DOI] [Full Text] [Full Text (PDF)] [Cited by in Crossref: 4158] [Cited by in RCA: 3339] [Article Influence: 417.4] [Reference Citation Analysis (1)] |
| 22. | Crouch SP, Kozlowski R, Slater KJ, Fletcher J. The use of ATP bioluminescence as a measure of cell proliferation and cytotoxicity. J Immunol Methods. 1993;160:81-88. [RCA] [PubMed] [DOI] [Full Text] [Cited by in Crossref: 647] [Cited by in RCA: 660] [Article Influence: 20.6] [Reference Citation Analysis (0)] |
| 23. | Braydich-Stolle L, Hussain S, Schlager JJ, Hofmann MC. In vitro cytotoxicity of nanoparticles in mammalian germline stem cells. Toxicol Sci. 2005;88:412-419. [RCA] [PubMed] [DOI] [Full Text] [Cited by in Crossref: 915] [Cited by in RCA: 725] [Article Influence: 36.3] [Reference Citation Analysis (0)] |
| 24. | Bergheim I, Bode C, Parlesak A. Distribution of cytochrome P450 2C, 2E1, 3A4, and 3A5 in human colon mucosa. BMC Clin Pharmacol. 2005;5:4. [RCA] [PubMed] [DOI] [Full Text] [Full Text (PDF)] [Cited by in Crossref: 39] [Cited by in RCA: 48] [Article Influence: 2.4] [Reference Citation Analysis (0)] |
| 25. | Podevin P, Carpentier A, Pène V, Aoudjehane L, Carrière M, Zaïdi S, Hernandez C, Calle V, Méritet JF, Scatton O, Dreux M, Cosset FL, Wakita T, Bartenschlager R, Demignot S, Conti F, Rosenberg AR, Calmus Y. Production of infectious hepatitis C virus in primary cultures of human adult hepatocytes. Gastroenterology. 2010;139:1355-1364. [RCA] [PubMed] [DOI] [Full Text] [Cited by in Crossref: 125] [Cited by in RCA: 127] [Article Influence: 8.5] [Reference Citation Analysis (0)] |
| 26. | Yamaguchi R, Yano H, Iemura A, Ogasawara S, Haramaki M, Kojiro M. Expression of vascular endothelial growth factor in human hepatocellular carcinoma. Hepatology. 1998;28:68-77. [RCA] [PubMed] [DOI] [Full Text] [Cited by in Crossref: 258] [Cited by in RCA: 270] [Article Influence: 10.0] [Reference Citation Analysis (0)] |
| 27. | Khetani SR, Bhatia SN. Microscale culture of human liver cells for drug development. Nat Biotechnol. 2008;26:120-126. [RCA] [PubMed] [DOI] [Full Text] [Cited by in Crossref: 949] [Cited by in RCA: 895] [Article Influence: 49.7] [Reference Citation Analysis (0)] |
| 28. | Schwarzinger M, Baillot S, Yazdanpanah Y, Rehm J, Mallet V. Contribution of alcohol use disorders on the burden of chronic hepatitis C in France, 2008-2013: A nationwide retrospective cohort study. J Hepatol. 2017;67:454-461. [RCA] [PubMed] [DOI] [Full Text] [Cited by in Crossref: 35] [Cited by in RCA: 42] [Article Influence: 5.3] [Reference Citation Analysis (0)] |
| 29. | Lee M, Kowdley KV. Alcohol's effect on other chronic liver diseases. Clin Liver Dis. 2012;16:827-837. [RCA] [PubMed] [DOI] [Full Text] [Cited by in Crossref: 17] [Cited by in RCA: 19] [Article Influence: 1.5] [Reference Citation Analysis (0)] |
| 30. | Lefebvre E, Moyle G, Reshef R, Richman LP, Thompson M, Hong F, Chou HL, Hashiguchi T, Plato C, Poulin D, Richards T, Yoneyama H, Jenkins H, Wolfgang G, Friedman SL. Antifibrotic Effects of the Dual CCR2/CCR5 Antagonist Cenicriviroc in Animal Models of Liver and Kidney Fibrosis. PLoS One. 2016;11:e0158156. [RCA] [PubMed] [DOI] [Full Text] [Full Text (PDF)] [Cited by in Crossref: 197] [Cited by in RCA: 260] [Article Influence: 28.9] [Reference Citation Analysis (0)] |
| 31. | Ratziu V, de Ledinghen V, Oberti F, Mathurin P, Wartelle-Bladou C, Renou C, Sogni P, Maynard M, Larrey D, Serfaty L, Bonnefont-Rousselot D, Bastard JP, Rivière M, Spénard J; FRESGUN. A randomized controlled trial of high-dose ursodesoxycholic acid for nonalcoholic steatohepatitis. J Hepatol. 2011;54:1011-1019. [RCA] [PubMed] [DOI] [Full Text] [Cited by in Crossref: 208] [Cited by in RCA: 236] [Article Influence: 16.9] [Reference Citation Analysis (0)] |
| 32. | Dufour JF, Oneta CM, Gonvers JJ, Bihl F, Cerny A, Cereda JM, Zala JF, Helbling B, Steuerwald M, Zimmermann A; Swiss Association for the Study of the Liver. Randomized placebo-controlled trial of ursodeoxycholic acid with vitamin e in nonalcoholic steatohepatitis. Clin Gastroenterol Hepatol. 2006;4:1537-1543. [RCA] [PubMed] [DOI] [Full Text] [Cited by in Crossref: 256] [Cited by in RCA: 256] [Article Influence: 13.5] [Reference Citation Analysis (0)] |
| 33. | Hossain N, Kanwar P, Mohanty SR. A Comprehensive Updated Review of Pharmaceutical and Nonpharmaceutical Treatment for NAFLD. Gastroenterol Res Pract. 2016;2016:7109270. [RCA] [PubMed] [DOI] [Full Text] [Full Text (PDF)] [Cited by in Crossref: 37] [Cited by in RCA: 46] [Article Influence: 5.1] [Reference Citation Analysis (0)] |
| 34. | Konerman MA, Jones JC, Harrison SA. Pharmacotherapy for NASH: Current and emerging. J Hepatol. 2018;68:362-375. [RCA] [PubMed] [DOI] [Full Text] [Cited by in Crossref: 196] [Cited by in RCA: 230] [Article Influence: 32.9] [Reference Citation Analysis (0)] |
| 35. | Younossi ZM, Ratziu V, Loomba R, Rinella M, Anstee QM, Goodman Z, Bedossa P, Geier A, Beckebaum S, Newsome PN, Sheridan D, Sheikh MY, Trotter J, Knapple W, Lawitz E, Abdelmalek MF, Kowdley KV, Montano-Loza AJ, Boursier J, Mathurin P, Bugianesi E, Mazzella G, Olveira A, Cortez-Pinto H, Graupera I, Orr D, Gluud LL, Dufour JF, Shapiro D, Campagna J, Zaru L, MacConell L, Shringarpure R, Harrison S, Sanyal AJ; REGENERATE Study Investigators. Obeticholic acid for the treatment of non-alcoholic steatohepatitis: interim analysis from a multicentre, randomised, placebo-controlled phase 3 trial. Lancet. 2019;394:2184-2196. [RCA] [PubMed] [DOI] [Full Text] [Cited by in Crossref: 940] [Cited by in RCA: 925] [Article Influence: 154.2] [Reference Citation Analysis (0)] |
| 36. | Ratziu V. Novel Pharmacotherapy Options for NASH. Dig Dis Sci. 2016;61:1398-1405. [RCA] [PubMed] [DOI] [Full Text] [Cited by in Crossref: 31] [Cited by in RCA: 25] [Article Influence: 2.8] [Reference Citation Analysis (0)] |
| 37. | Friedman SL, Ratziu V, Harrison SA, Abdelmalek MF, Aithal GP, Caballeria J, Francque S, Farrell G, Kowdley KV, Craxi A, Simon K, Fischer L, Melchor-Khan L, Vest J, Wiens BL, Vig P, Seyedkazemi S, Goodman Z, Wong VW, Loomba R, Tacke F, Sanyal A, Lefebvre E. A randomized, placebo-controlled trial of cenicriviroc for treatment of nonalcoholic steatohepatitis with fibrosis. Hepatology. 2018;67:1754-1767. [RCA] [PubMed] [DOI] [Full Text] [Full Text (PDF)] [Cited by in Crossref: 428] [Cited by in RCA: 533] [Article Influence: 76.1] [Reference Citation Analysis (0)] |
| 38. | Sato K, Gosho M, Yamamoto T, Kobayashi Y, Ishii N, Ohashi T, Nakade Y, Ito K, Fukuzawa Y, Yoneda M. Vitamin E has a beneficial effect on nonalcoholic fatty liver disease: a meta-analysis of randomized controlled trials. Nutrition. 2015;31:923-930. [RCA] [PubMed] [DOI] [Full Text] [Cited by in Crossref: 118] [Cited by in RCA: 141] [Article Influence: 12.8] [Reference Citation Analysis (1)] |


