Copyright
©The Author(s) 2017.
World J Hepatol. Aug 8, 2017; 9(22): 967-972
Published online Aug 8, 2017. doi: 10.4254/wjh.v9.i22.967
Published online Aug 8, 2017. doi: 10.4254/wjh.v9.i22.967
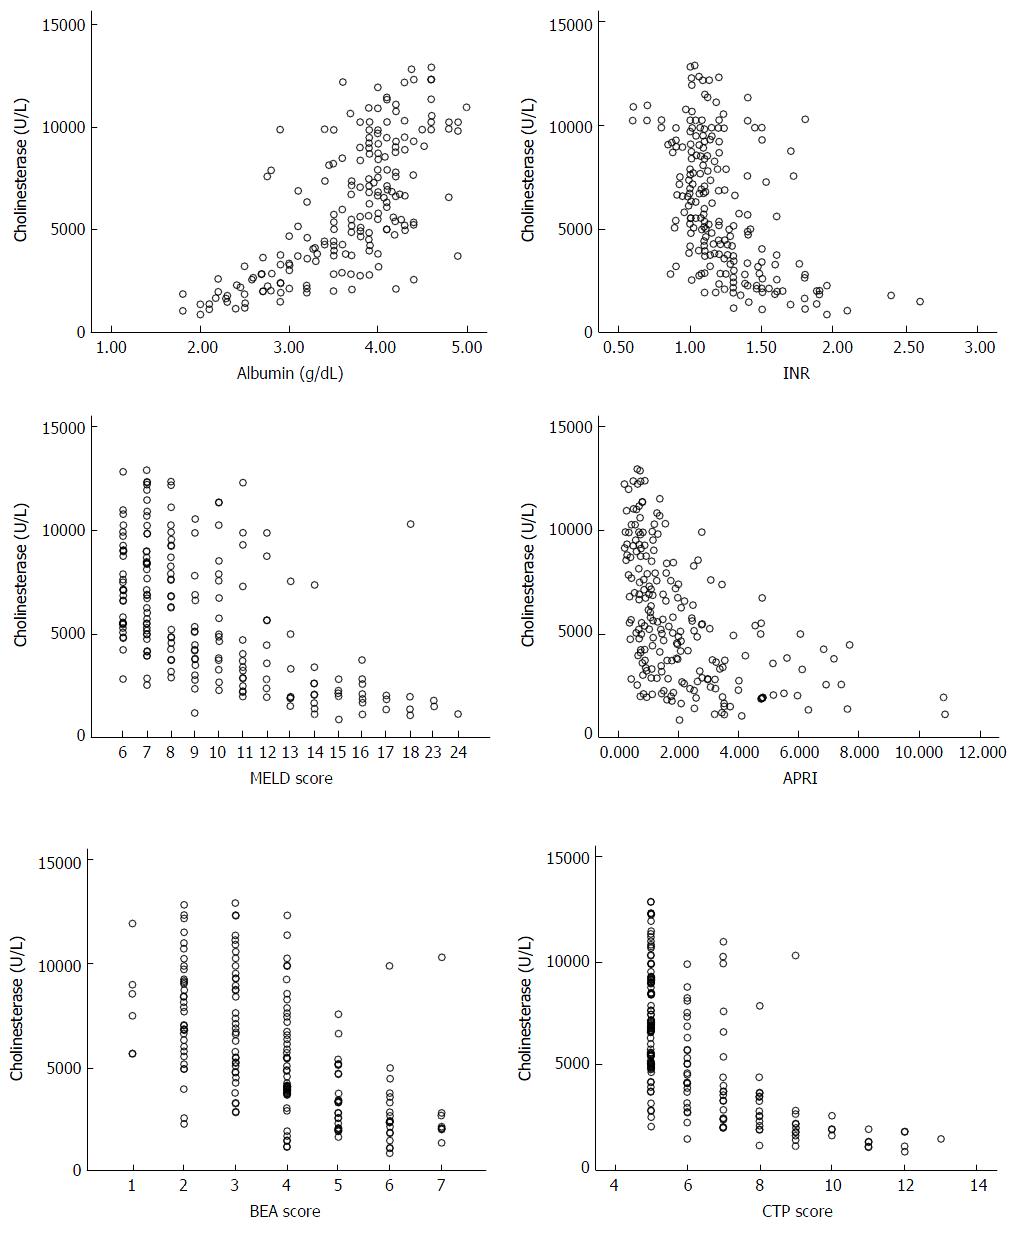
Figure 1 Correlations of cholinesterase levels with the synthetic liver function tests and liver function prognostic models.
INR: international normalization ratio; MELD: Model for end stage liver disease; APRI: AST to platelet ratio index; BEA: baseline-event-anticipation; CTP: Child Turgotte Pugh.
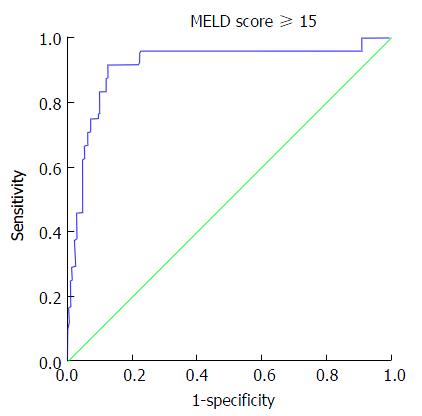
Figure 2 Receiver operating characteristic curve.
Cholinesterase levels for model for end stage liver disease score 15 or more (A smaller test result indicates a more positive test). MELD: Model for Endstage Liver Disease.
- Citation: Abbas M, Abbas Z. Serum cholinesterase: A predictive biomarker of hepatic reserves in chronic hepatitis D. World J Hepatol 2017; 9(22): 967-972
- URL: https://www.wjgnet.com/1948-5182/full/v9/i22/967.htm
- DOI: https://dx.doi.org/10.4254/wjh.v9.i22.967


