Copyright
©The Author(s) 2016.
World J Hepatol. Feb 8, 2016; 8(4): 211-225
Published online Feb 8, 2016. doi: 10.4254/wjh.v8.i4.211
Published online Feb 8, 2016. doi: 10.4254/wjh.v8.i4.211
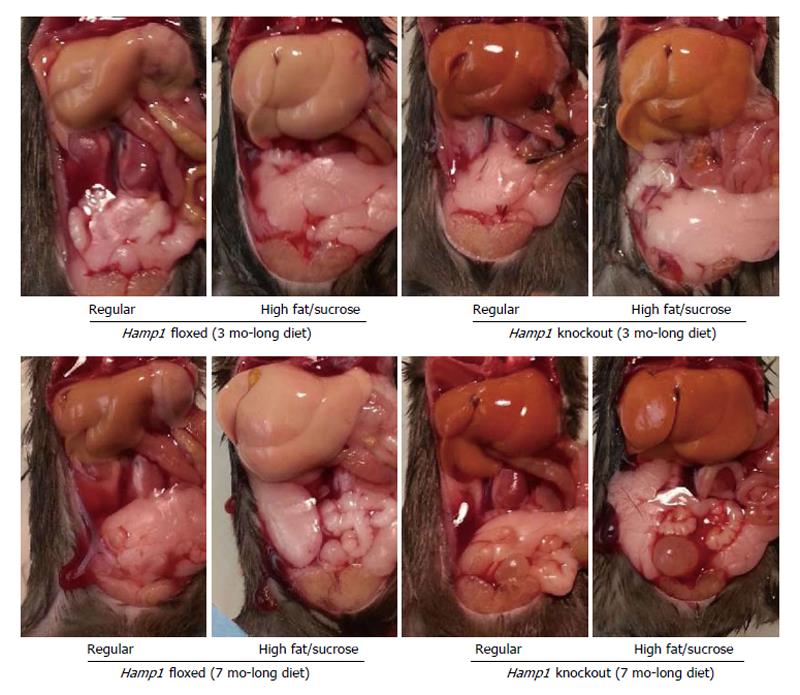
Figure 1 Macroscopic changes in Hamp1 floxed and knockout mice fed with either a high fat and high sucrose or a regular control diet for 3 or 7 mo.
Representative images showing the abdominal cavity of mice were obtained with a digital camera (Nikon).
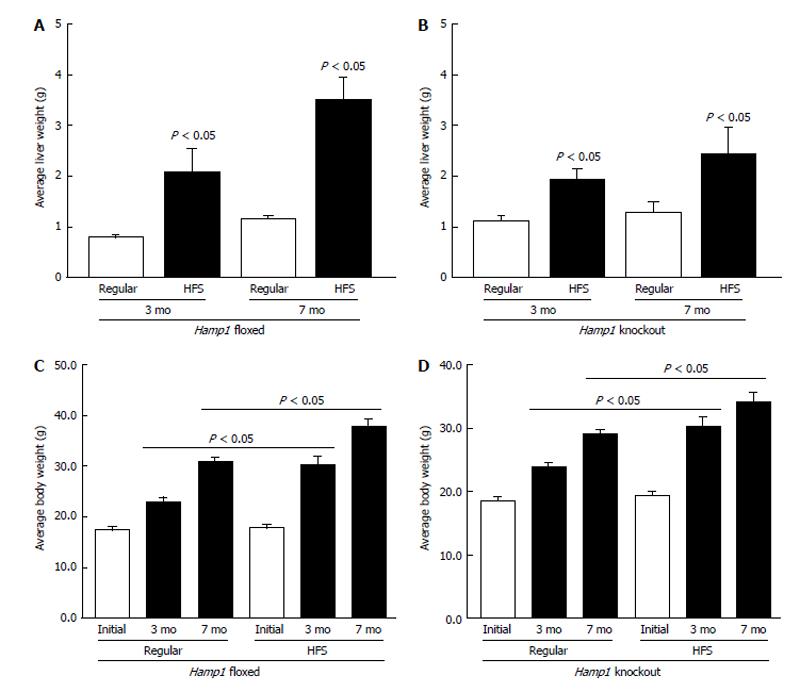
Figure 2 Liver and body weights of Hamp1 floxed and knockout mice fed with high fat or regular diets.
Average liver (A and B) and body (C and D) weights of floxed (A and C) and knockout (B and D) mice prior to (initial) and after feeding with high fat and sucrose (HFS) or regular control diets for 3 or 7 mo are shown as gram weight.
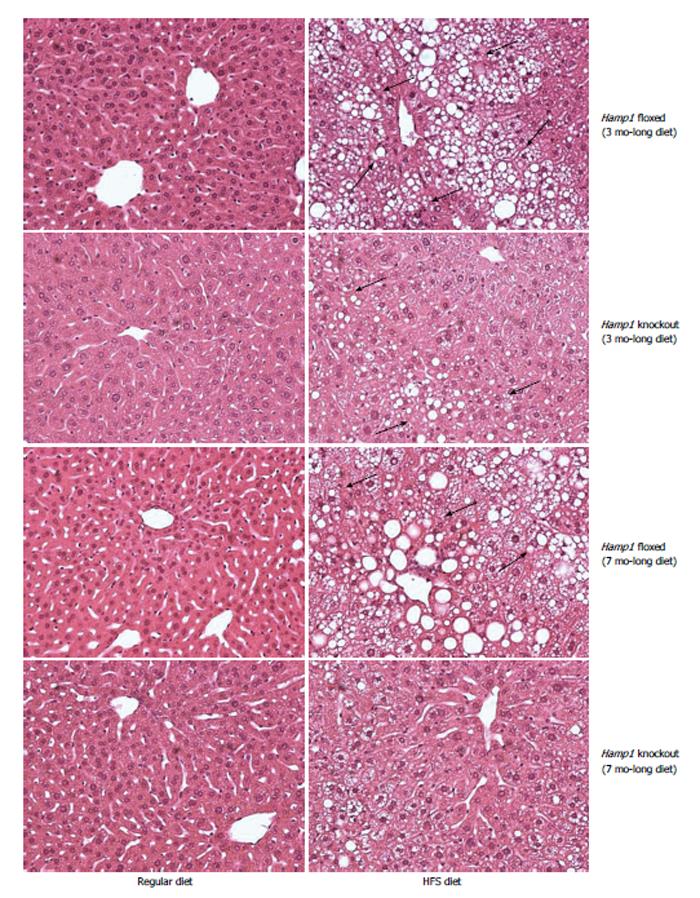
Figure 3 Liver histology in Hamp1 floxed and knockout mice fed high fat or regular diets.
Liver sections from floxed and knockout mice fed with high fat and sucrose (HFS) or regular diets for 3 and 7 mo were stained with hemotoxylin and eosin. Representative images obtained with a Nikon Eclipse E400 light microscope are shown (20 ×). Arrows indicate steatosis.
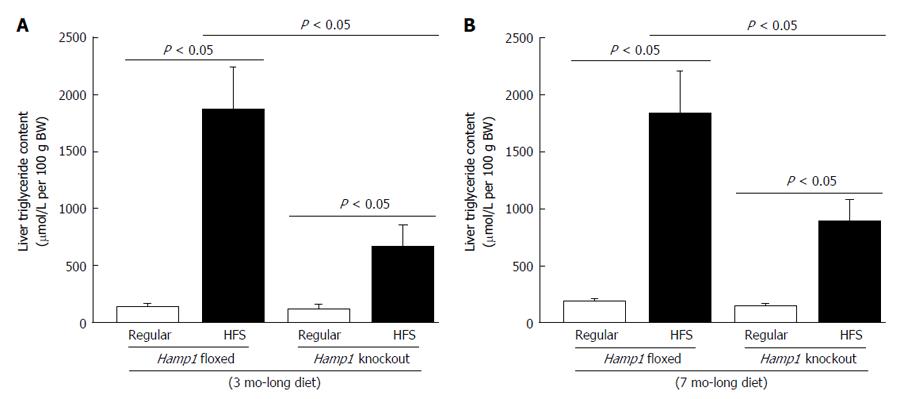
Figure 4 Liver triglyceride content in Hamp1 floxed and knockout mice fed high fat or regular diets.
Hepatic triglyceride content in floxed and knockout mice fed with regular or high fat sucrose (HFS) diets for 3 (A) or 7 (B) mo was quantified using 50 mg of wet liver tissue. Liver triglyceride amount was expressed as μmol per liver per 100 g body weight (μmol/L per 100 g BW).
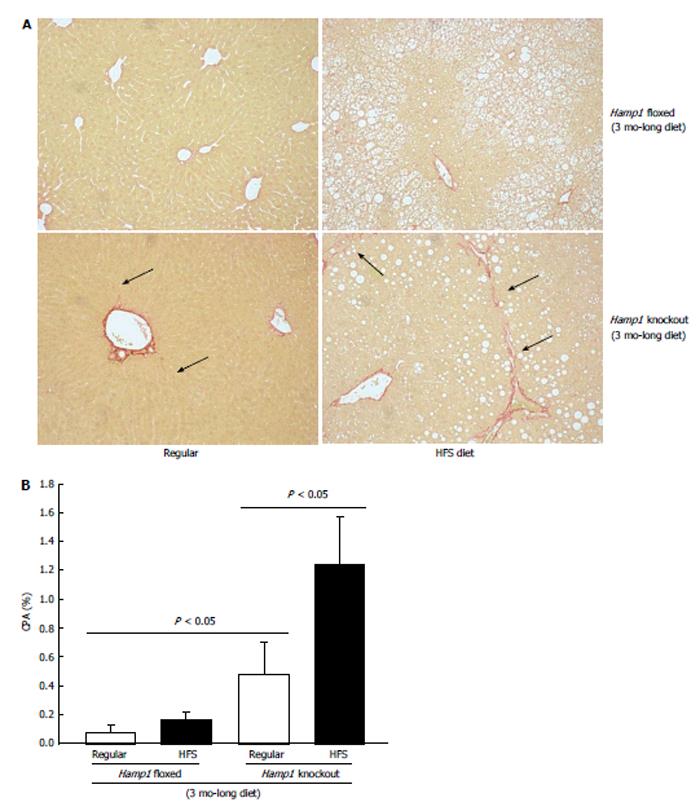
Figure 5 Fibrosis in Hamp1 floxed or knockout mice fed high fat or regular diets for 3 mo.
A: Fibrosis in the livers of floxed and knockout mice fed on regular or high fat sucrose (HFS) diets for 3 mo was detected by Sirius Red staining of tissue sections. Representative images obtained with Nikon Eclipse E400 light microscope are shown; B: 10 independent images (10 x) taken from each group were quantified using ImageJ ROI manager software. The collagen proportional area (CPA) was determined by calculating the percentage of collagen-occupied pixels against the total pixel values.
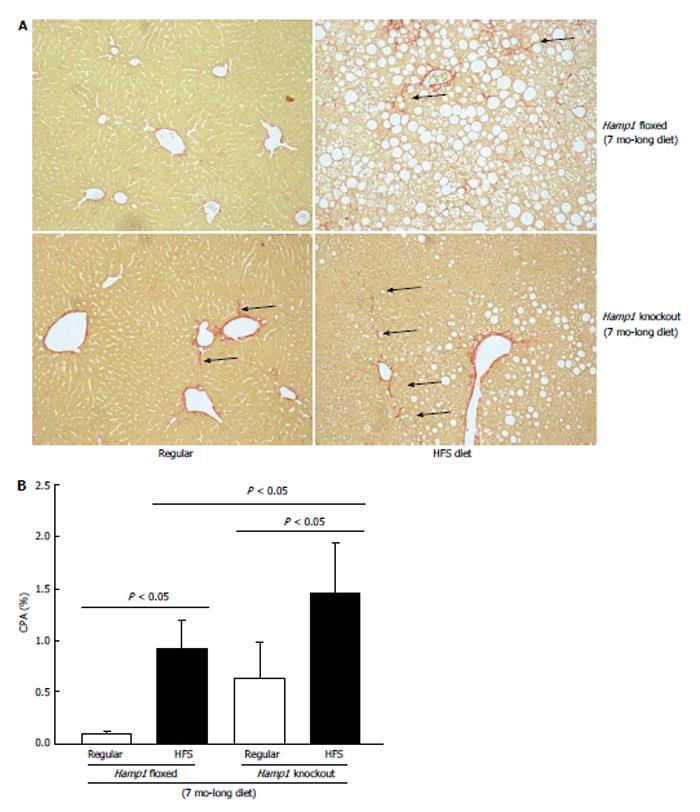
Figure 6 Fibrosis in Hamp1 floxed or knockout mice fed high fat or regular diets for 7 mo.
Liver fibrosis in floxed and knockout mice fed on regular or high fat sucrose (HFS) diets for 7 mo was detected (A) and quantified (B), as described above. CPA: Collagen proportional area.
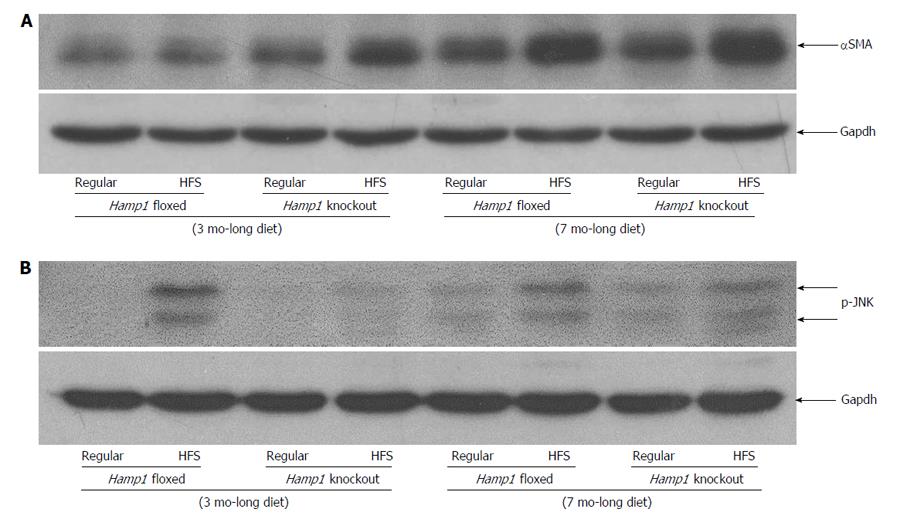
Figure 7 Protein expression levels of phosphorylated Jun N-terminal kinase and alpha smooth muscle actin in Hamp1 floxed and knockout mice fed with high fat or regular diets for 3 or 7 mo.
The expression levels of alpha smooth muscle actin (αSMA) (A) and phosphorylated Jun N-terminal kinase (p-JNK) (B) proteins in the livers of floxed and knockout mice fed with regular or high fat sucrose (HFS) diets for 3 or 7 mo was determined by western blotting, as described in Material and Methods. An anti-gapdh antibody was used as control to determine equal protein loading; Gapdh: Glyceraldehyde 3-phosphate dehydrogenase.
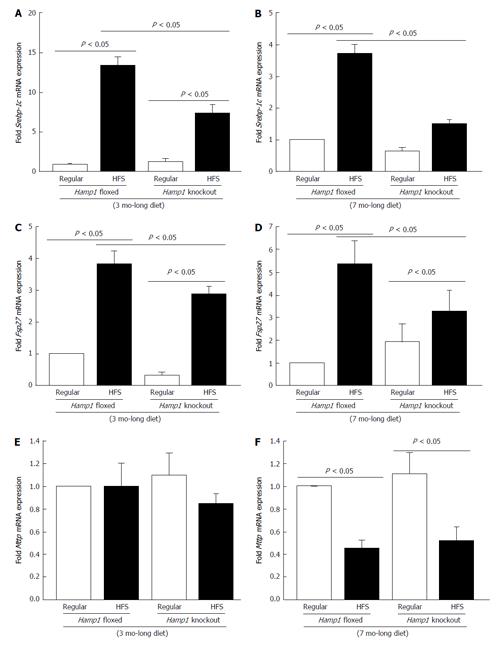
Figure 8 Expression of genes involved in lipogenesis, lipid storage and secretion.
The mRNA expression levels of Srebp-1c (A and B), Fsp27 (C and D), and Mttp (E and F) in the livers of floxed and knockout mice fed with regular and high fat sucrose (HFS) diets, was determined by real-time polymerase chain reaction. Gene expression in high fat-fed floxed or knockout and regular diet-fed knockout mice for 3 (A, C and E) or 7 mo (B, D and F) was expressed as fold change of that in floxed mice fed with a regular diet for the same time period.
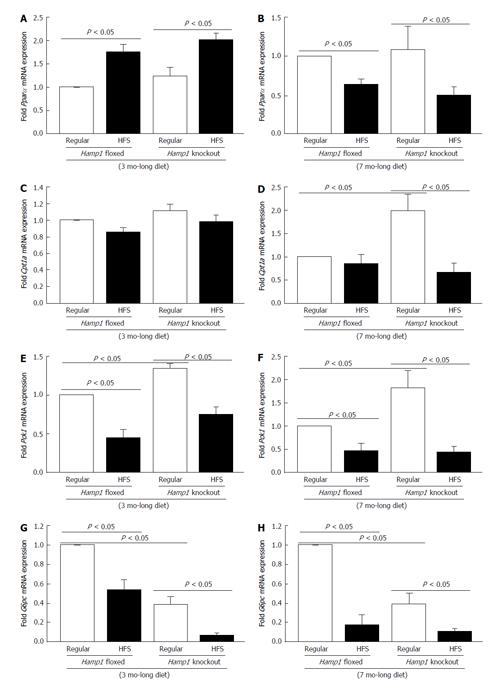
Figure 9 Expression of genes involved in β-oxidation and gluconeogenesis.
The mRNA expression levels of Pparα (A and B), Cpt1a (C and D), Pck1 (E and F) and G6pc (G and H), in the livers of Hamp1 floxed and knockout mice fed with regular and high fat sucrose (HFS) diets, was determined by real-time polymerase chain reaction. Gene expression in high fat-fed floxed or knockout and regular diet-fed knockout mice for 3 (A, C, E and G) or 7 mo (B, D, F and H) was expressed as fold change of that in floxed mice fed with a regular diet for the same time period.
- Citation: Lu S, Bennett RG, Kharbanda KK, Harrison-Findik DD. Lack of hepcidin expression attenuates steatosis and causes fibrosis in the liver. World J Hepatol 2016; 8(4): 211-225
- URL: https://www.wjgnet.com/1948-5182/full/v8/i4/211.htm
- DOI: https://dx.doi.org/10.4254/wjh.v8.i4.211


