Copyright
©2012 Baishideng Publishing Group Co.
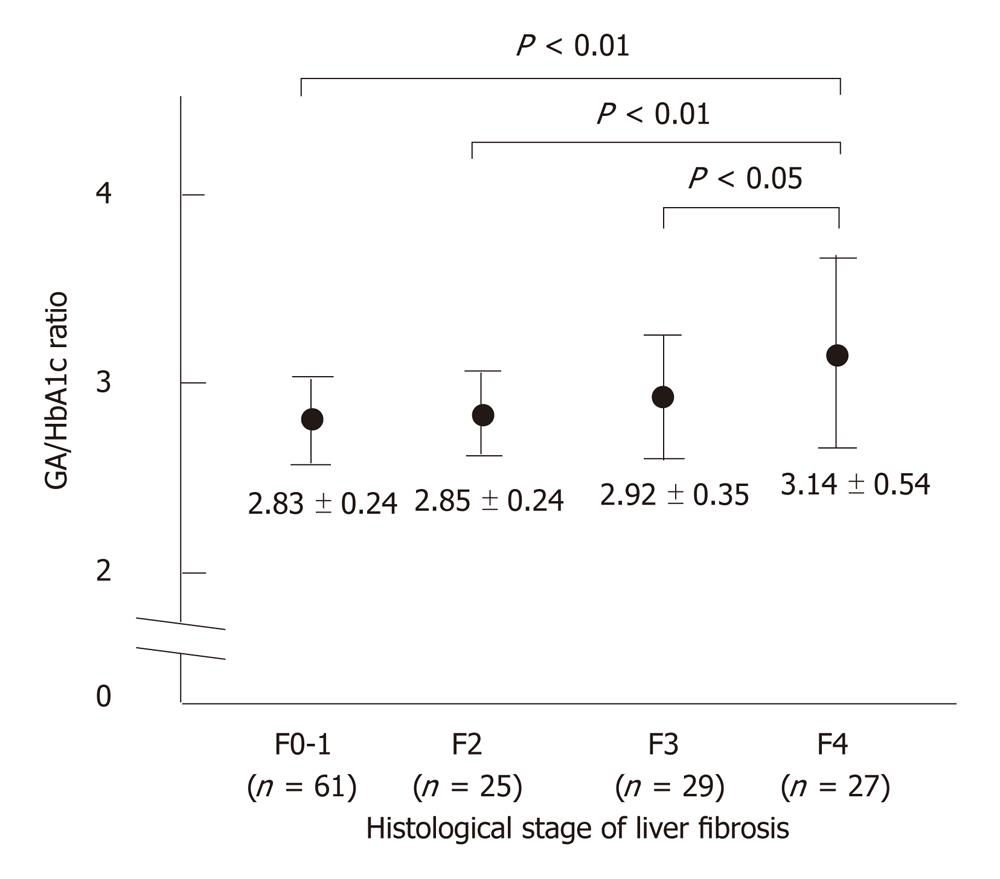
Figure 1 The glycated albumin/glycated hemoglobin ratio in relation to the METAVIR fibrosis score in patients with hepatitis C virus-related chronic liver disease.
The glycated albumin (GA)/glycated hemoglobin (HbA1c) ratio increased as the fibrosis progressed. There was a significant difference between the F0-F1 vs F4, F2 vs F4, and F3 vs F4 groups.
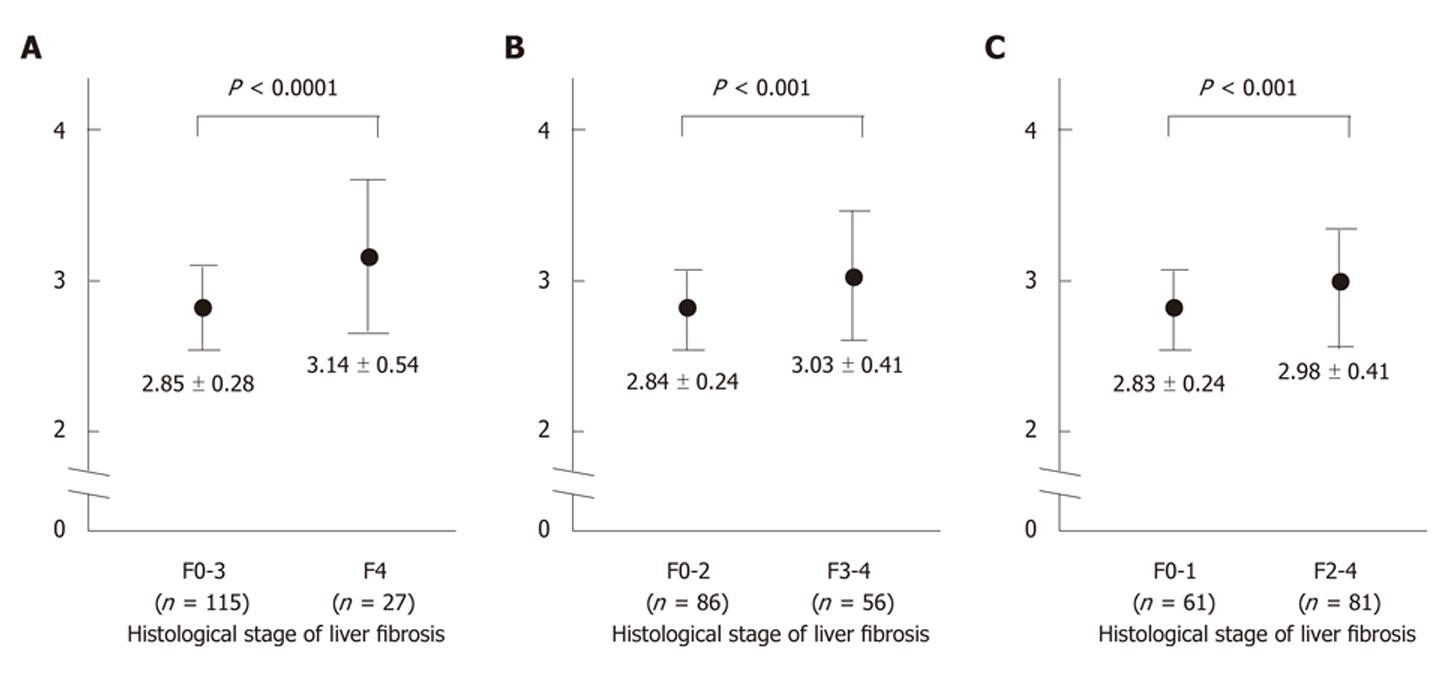
Figure 2 The glycated albumin/glycated hemoglobin ratio in patients with hepatitis C virus-related chronic liver disease.
A: A comparison between the F0-F3 (no cirrhosis) group and F4 (cirrhosis) group. The glycated albumin (GA)/glycated hemoglobin (HbA1c) ratio was higher in patients with cirrhosis than that in non-cirrhotic patients; B: The comparison between the F0-F2 (no or intermediate fibrosis: without severe fibrosis) group and the F3-F4 (severe fibrosis) group. The GA/HbA1c ratio was higher in the patients with significant fibrosis than that in the patients with no or minimal fibrosis; C: A comparison between the F0-F1 (no or minimal fibrosis: without significant fibrosis) group and the F2-F4 (significant fibrosis) group. The GA/HbA1c ratio was higher in the patients with significant fibrosis than in those with either minimal fibrosis or none at all.
- Citation: Aizawa N, Enomoto H, Imanishi H, Saito M, Iwata Y, Tanaka H, Ikeda N, Sakai Y, Takashima T, Iwai T, Moriwaki EI, Shimomura S, Iijima H, Nakamura H, Nishiguchi S. Elevation of the glycated albumin to glycated hemoglobin ratio during the progression of hepatitis C virus related liver fibrosis. World J Hepatol 2012; 4(1): 11-17
- URL: https://www.wjgnet.com/1948-5182/full/v4/i1/11.htm
- DOI: https://dx.doi.org/10.4254/wjh.v4.i1.11


