Copyright
©The Author(s) 2025.
World J Hepatol. Aug 27, 2025; 17(8): 108333
Published online Aug 27, 2025. doi: 10.4254/wjh.v17.i8.108333
Published online Aug 27, 2025. doi: 10.4254/wjh.v17.i8.108333
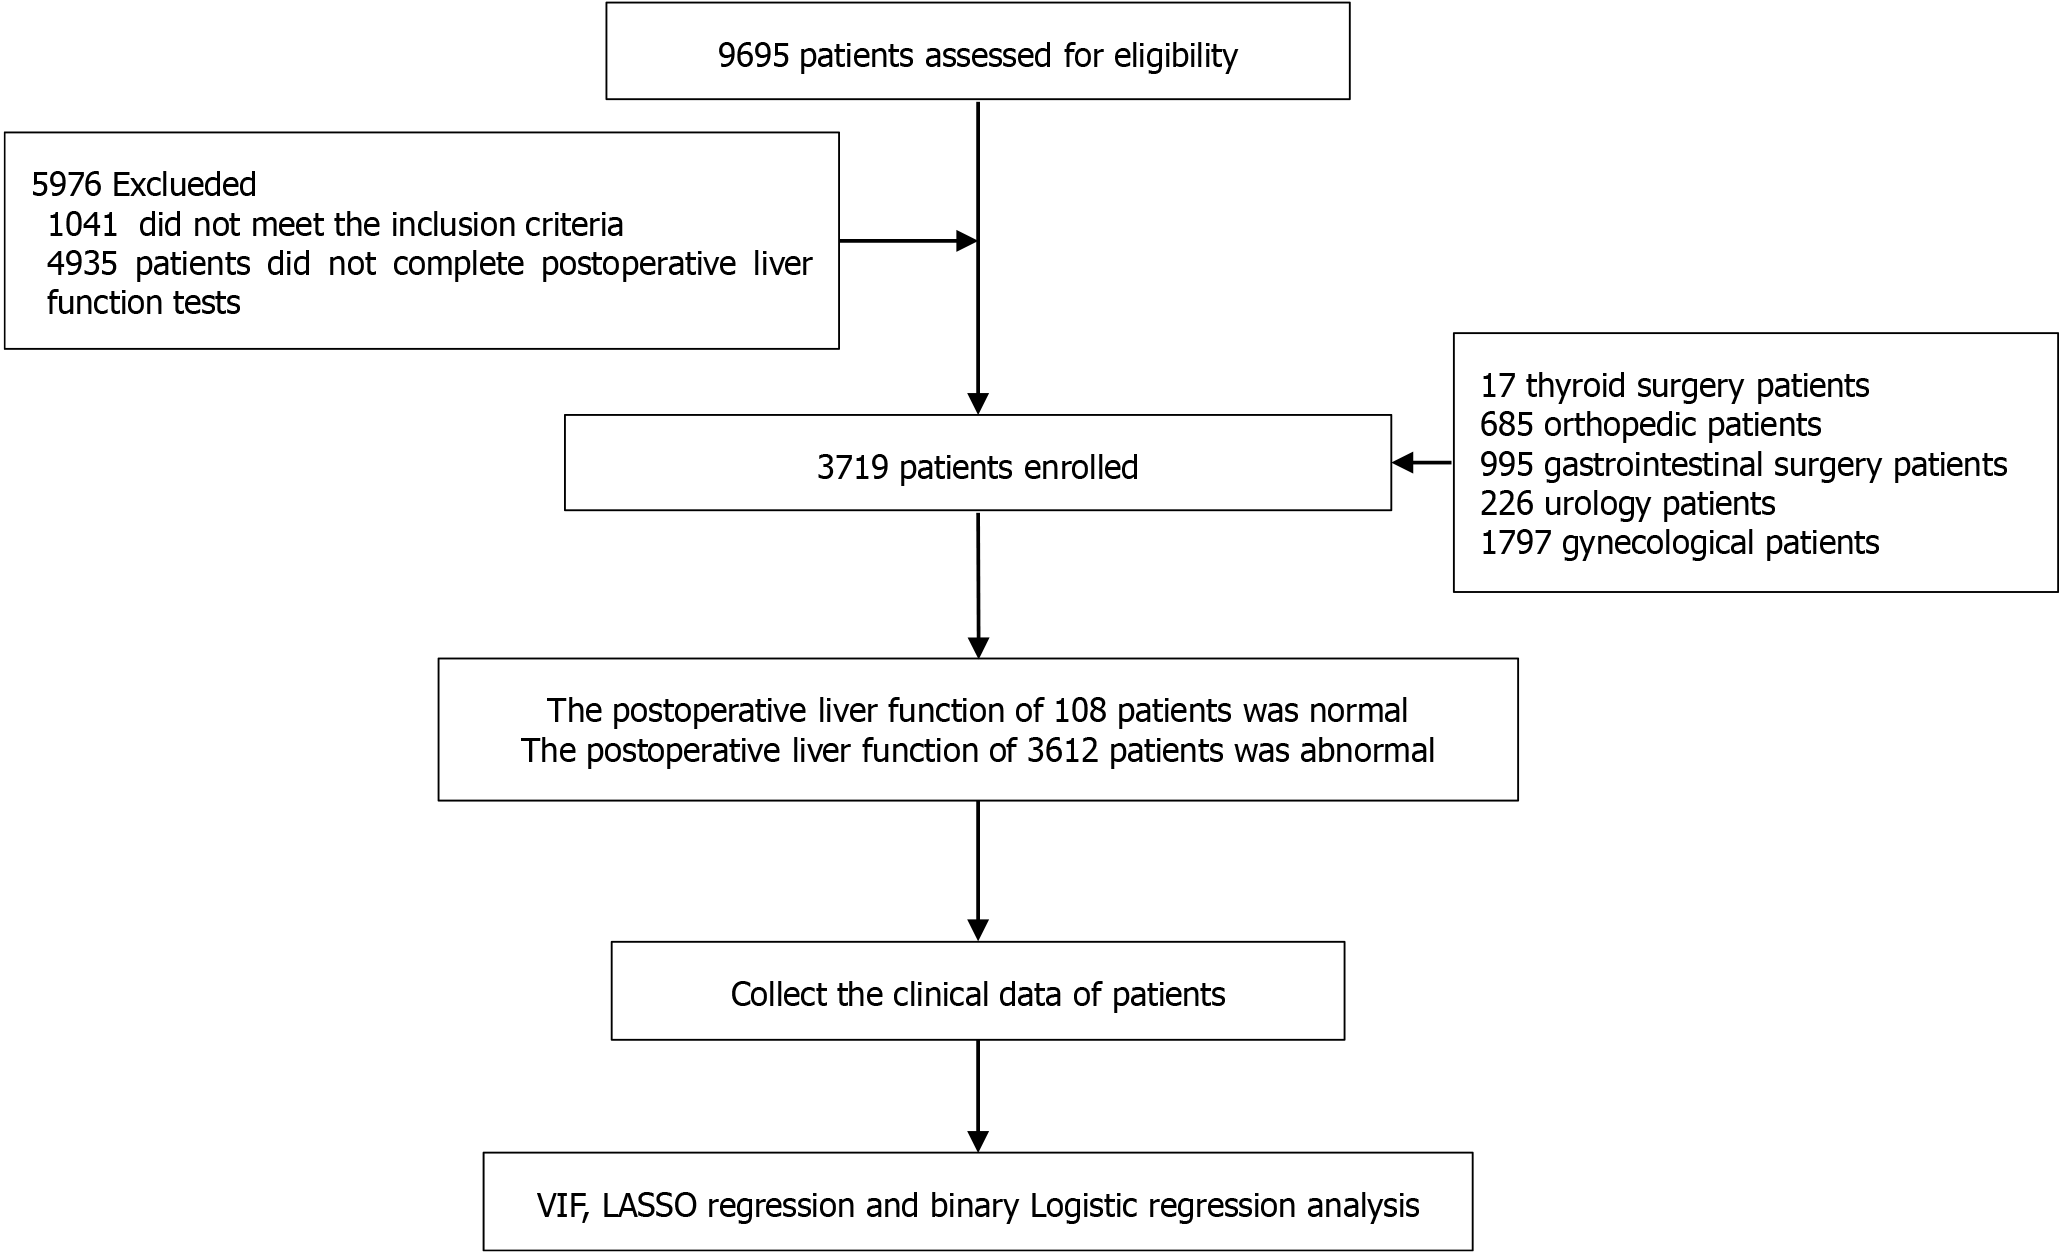
Figure 1 Flow chart.
VIF: Variance inflation factor.
Figure 2 LASSO regression analysis.
A: Lasso coefficient paths; B: Number of selected features.
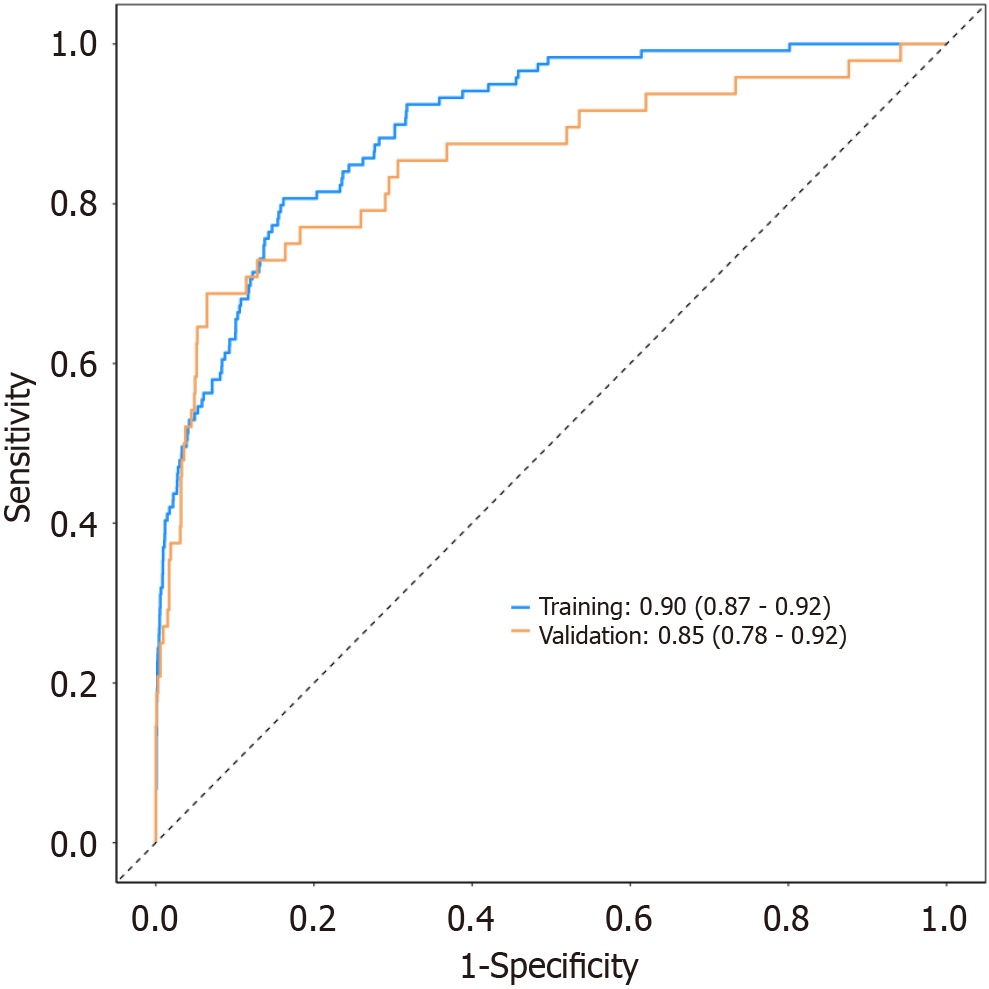
Figure 3
Receiver operating characteristic curves for training and validation sets.
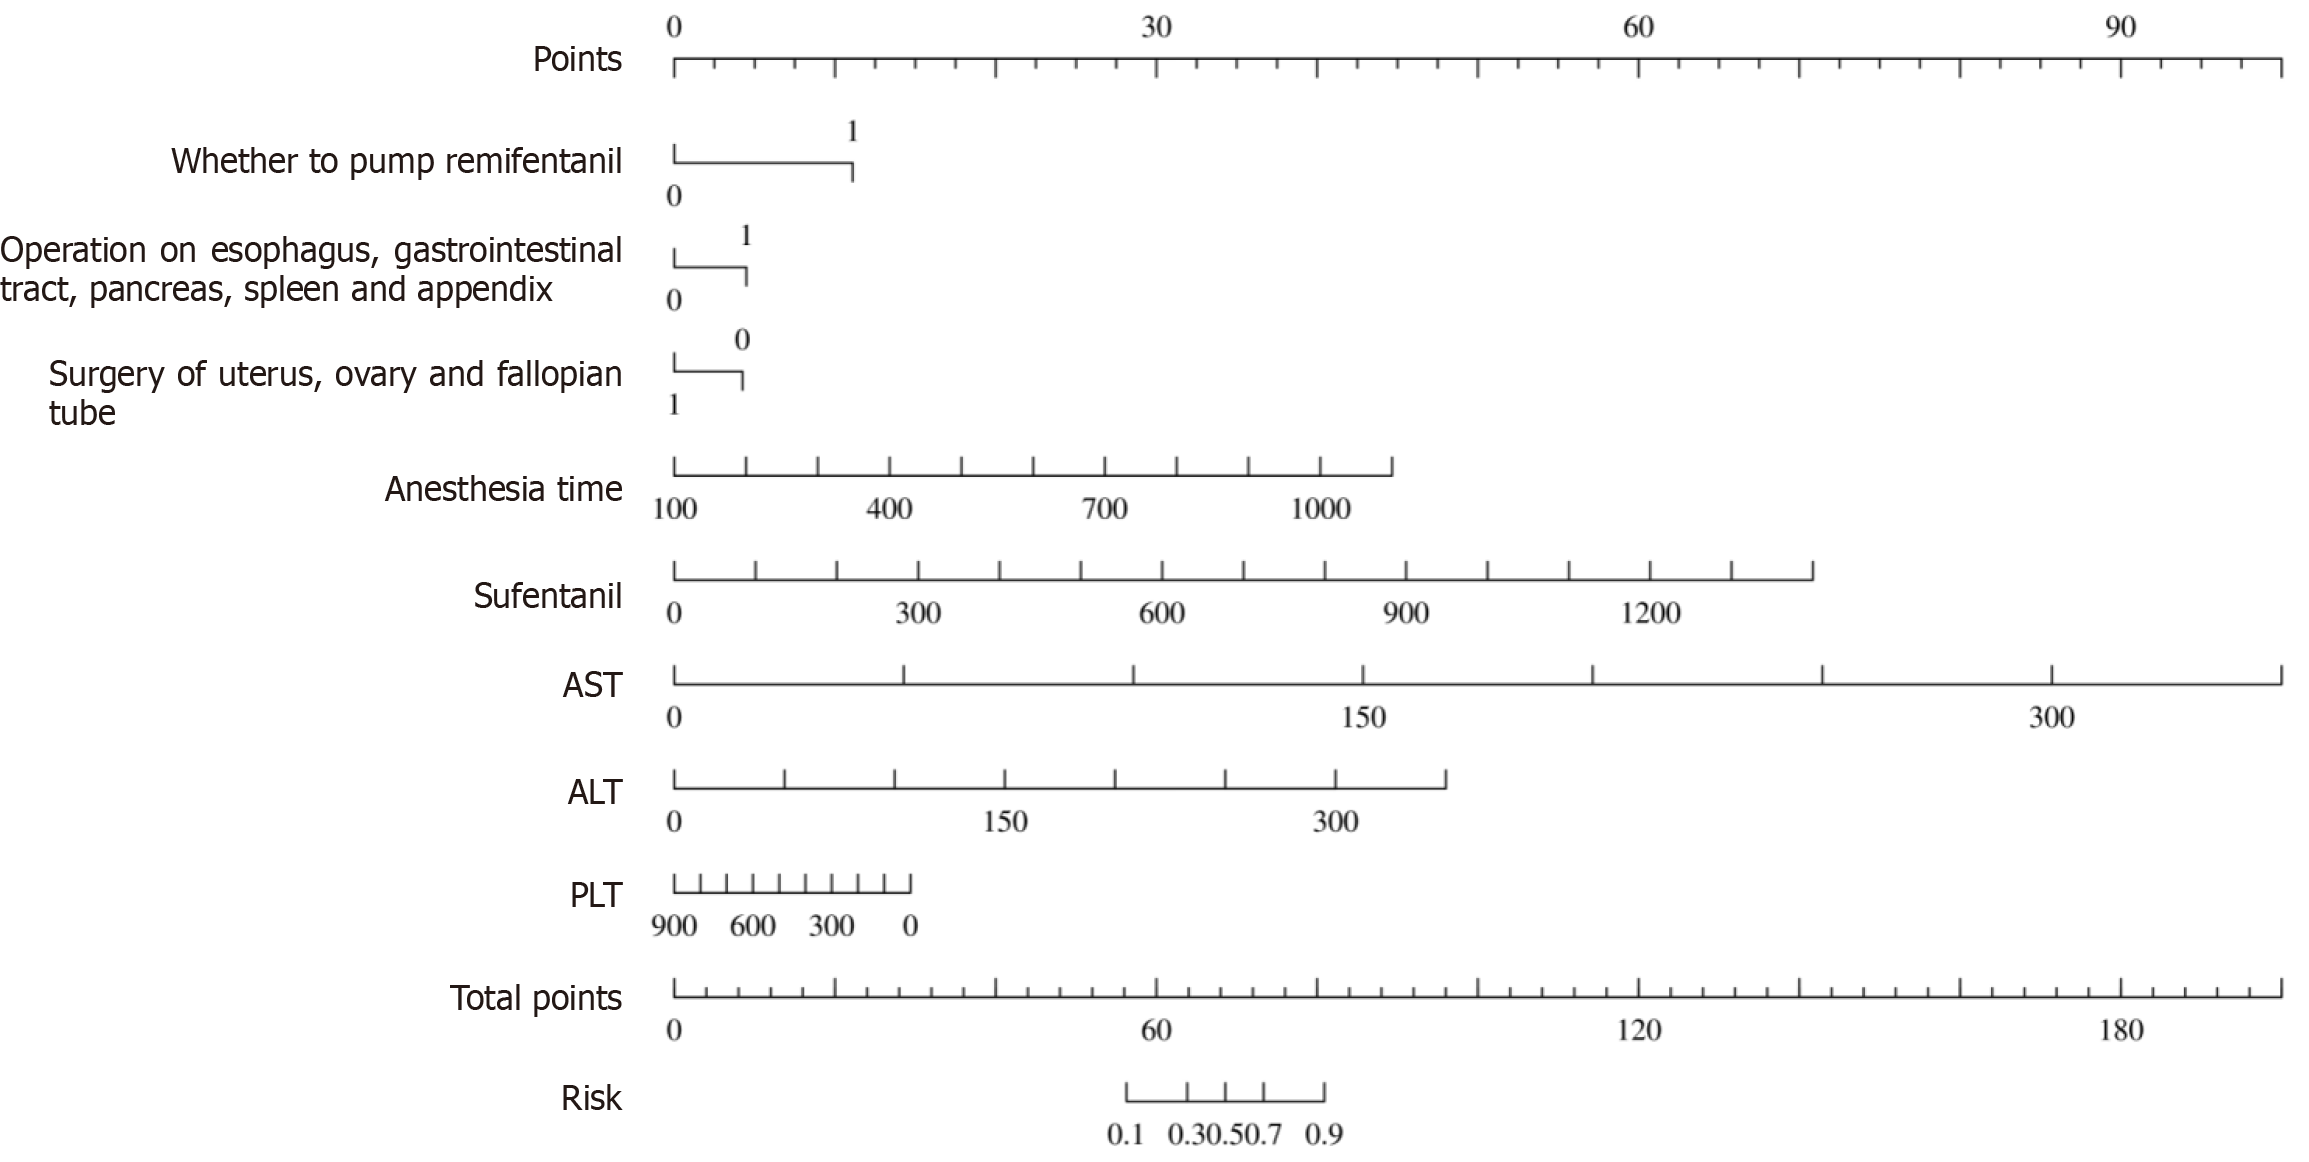
Figure 4
Predictive modeling nomogram.
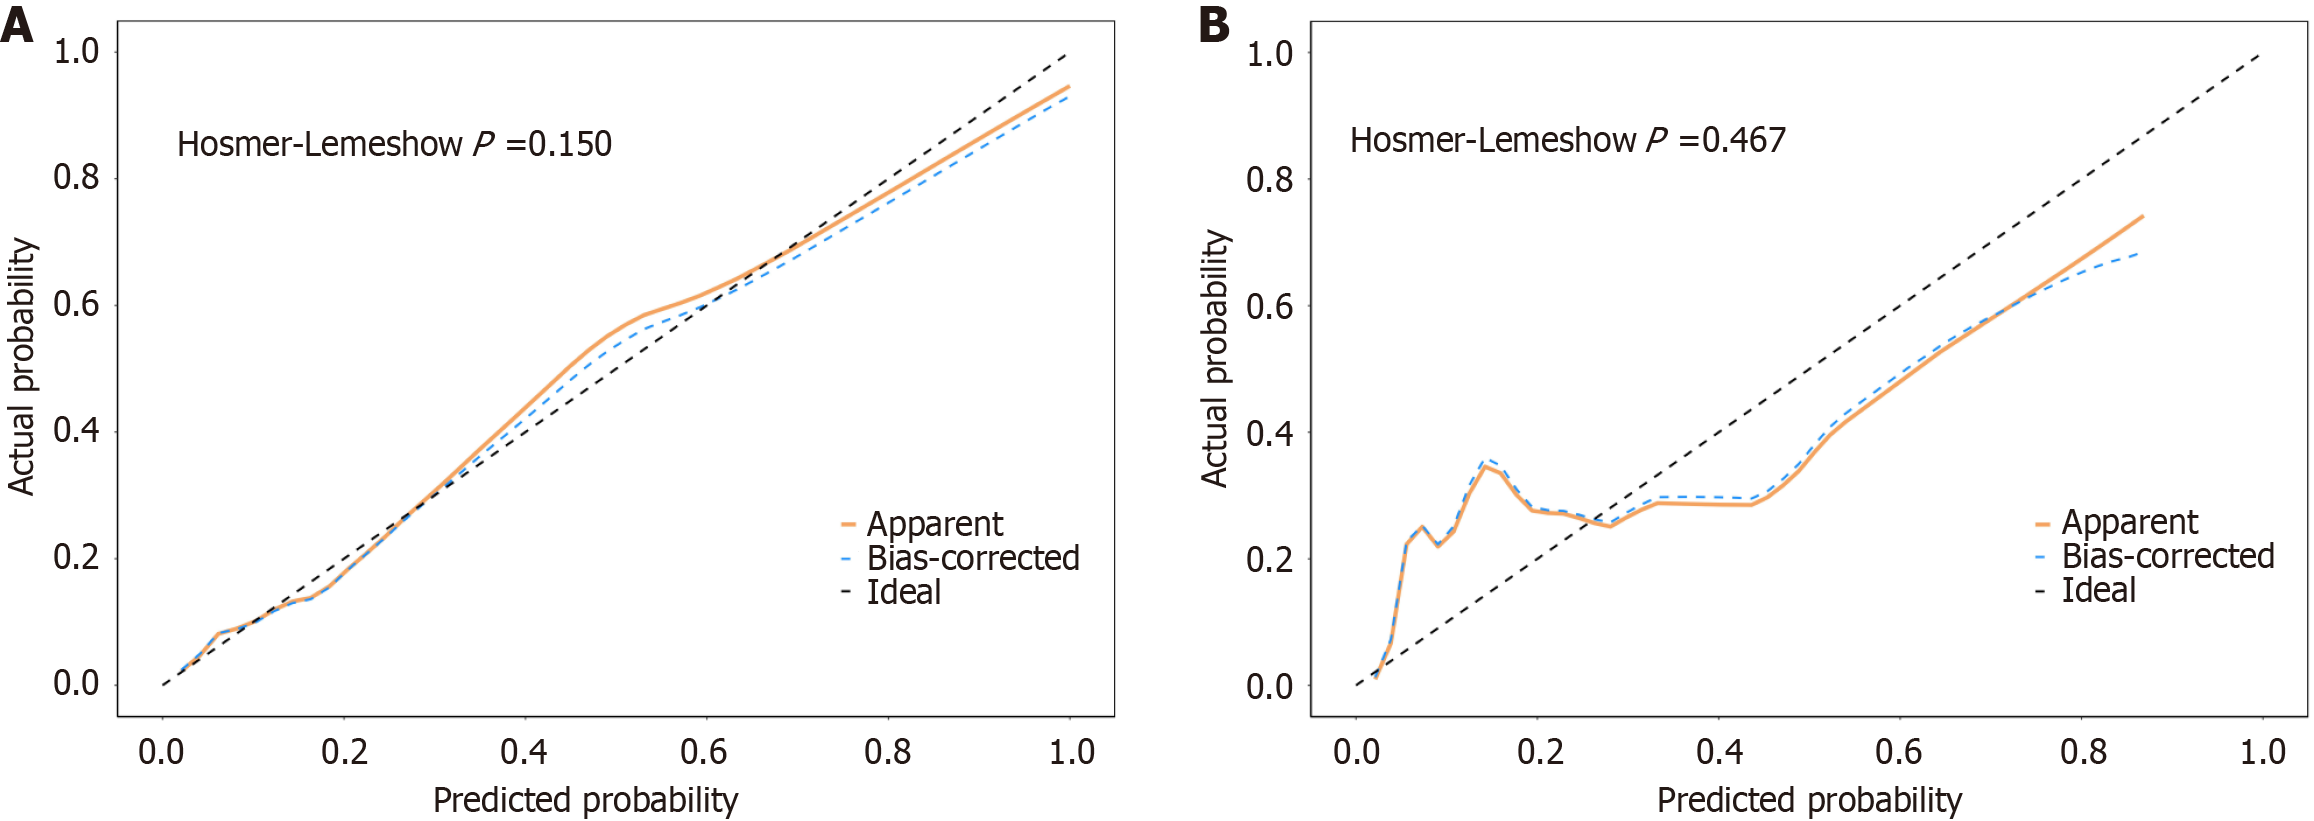
Figure 5 Calibration curves.
A: Calibration curve of the training set; B: Calibration curve of the verification set.
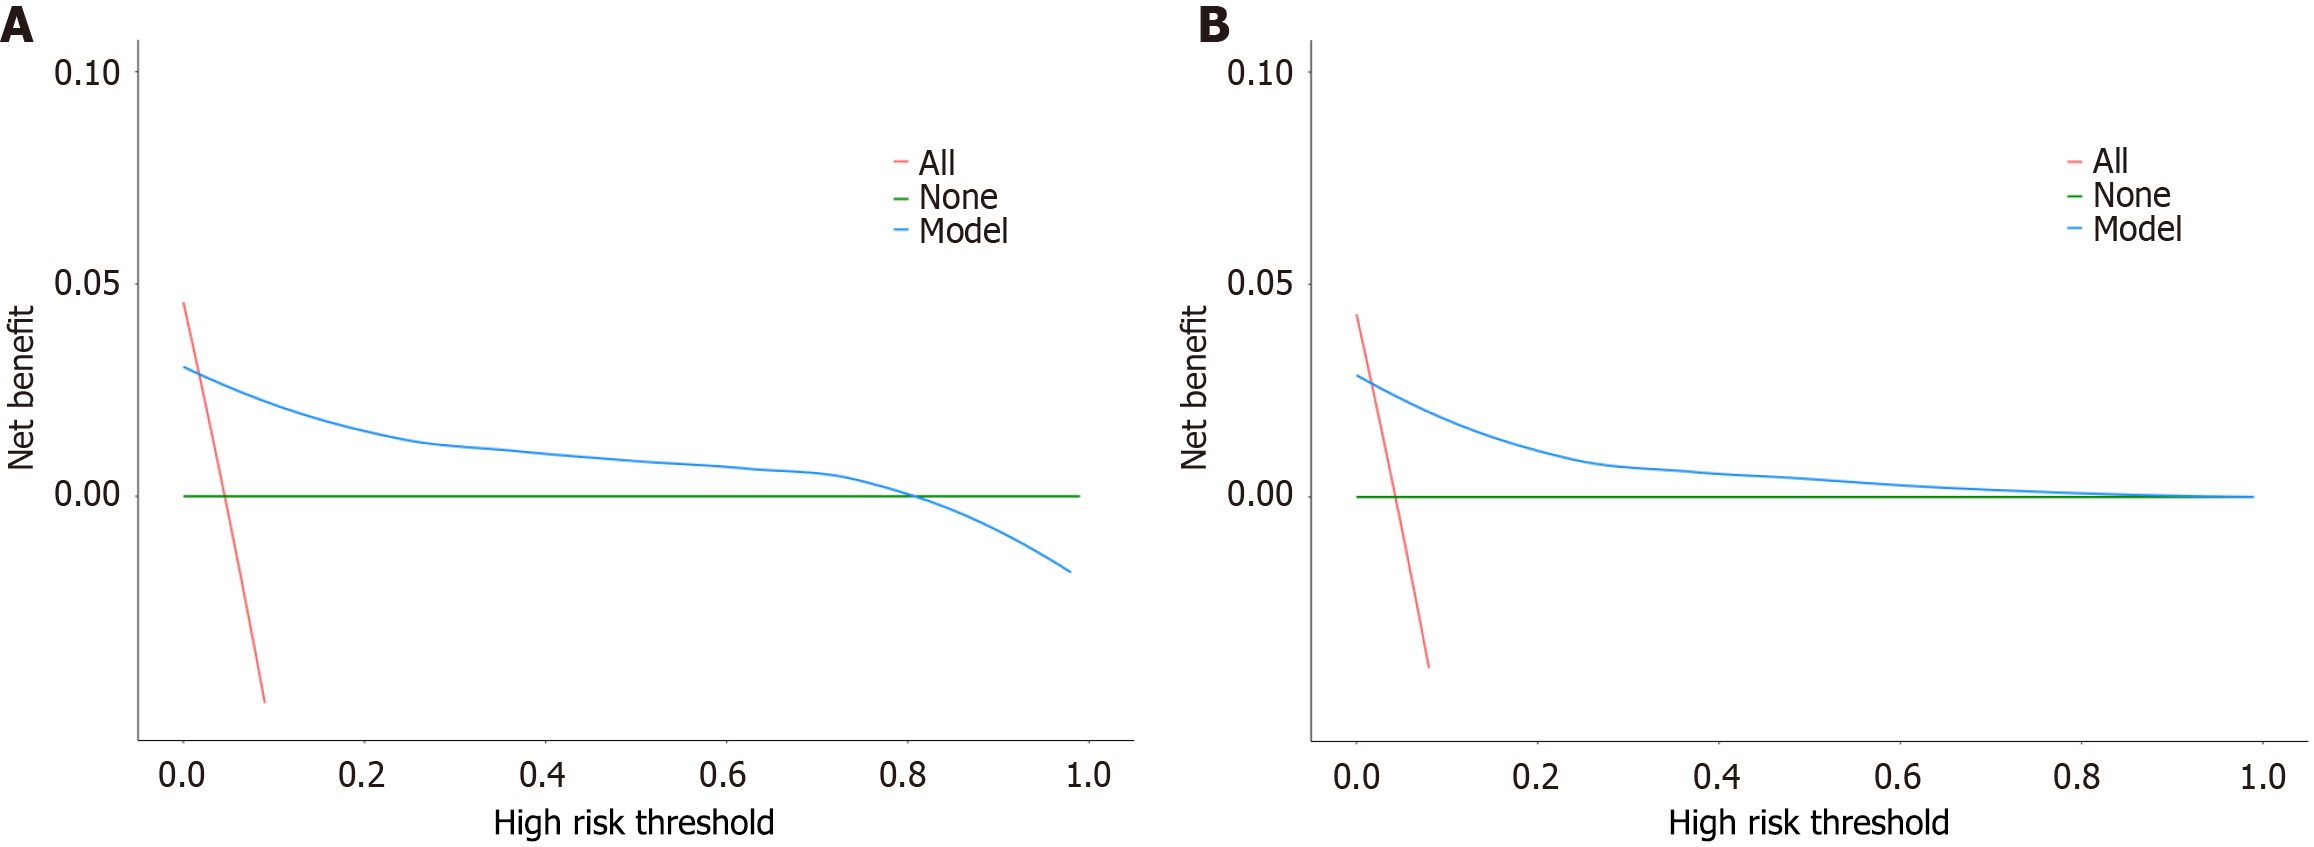
Figure 6 Decision curves.
A: Decision curves of the training set; B: Decision curve of the validation set.
- Citation: Zhong L, Wang HY, Li XN, Ling Q, Hao N, Li XY, Zhao GF, Liao M. Risk factors and predictive modeling of early postoperative liver function abnormalities. World J Hepatol 2025; 17(8): 108333
- URL: https://www.wjgnet.com/1948-5182/full/v17/i8/108333.htm
- DOI: https://dx.doi.org/10.4254/wjh.v17.i8.108333


