Copyright
©The Author(s) 2025.
World J Hepatol. Feb 27, 2025; 17(2): 102001
Published online Feb 27, 2025. doi: 10.4254/wjh.v17.i2.102001
Published online Feb 27, 2025. doi: 10.4254/wjh.v17.i2.102001
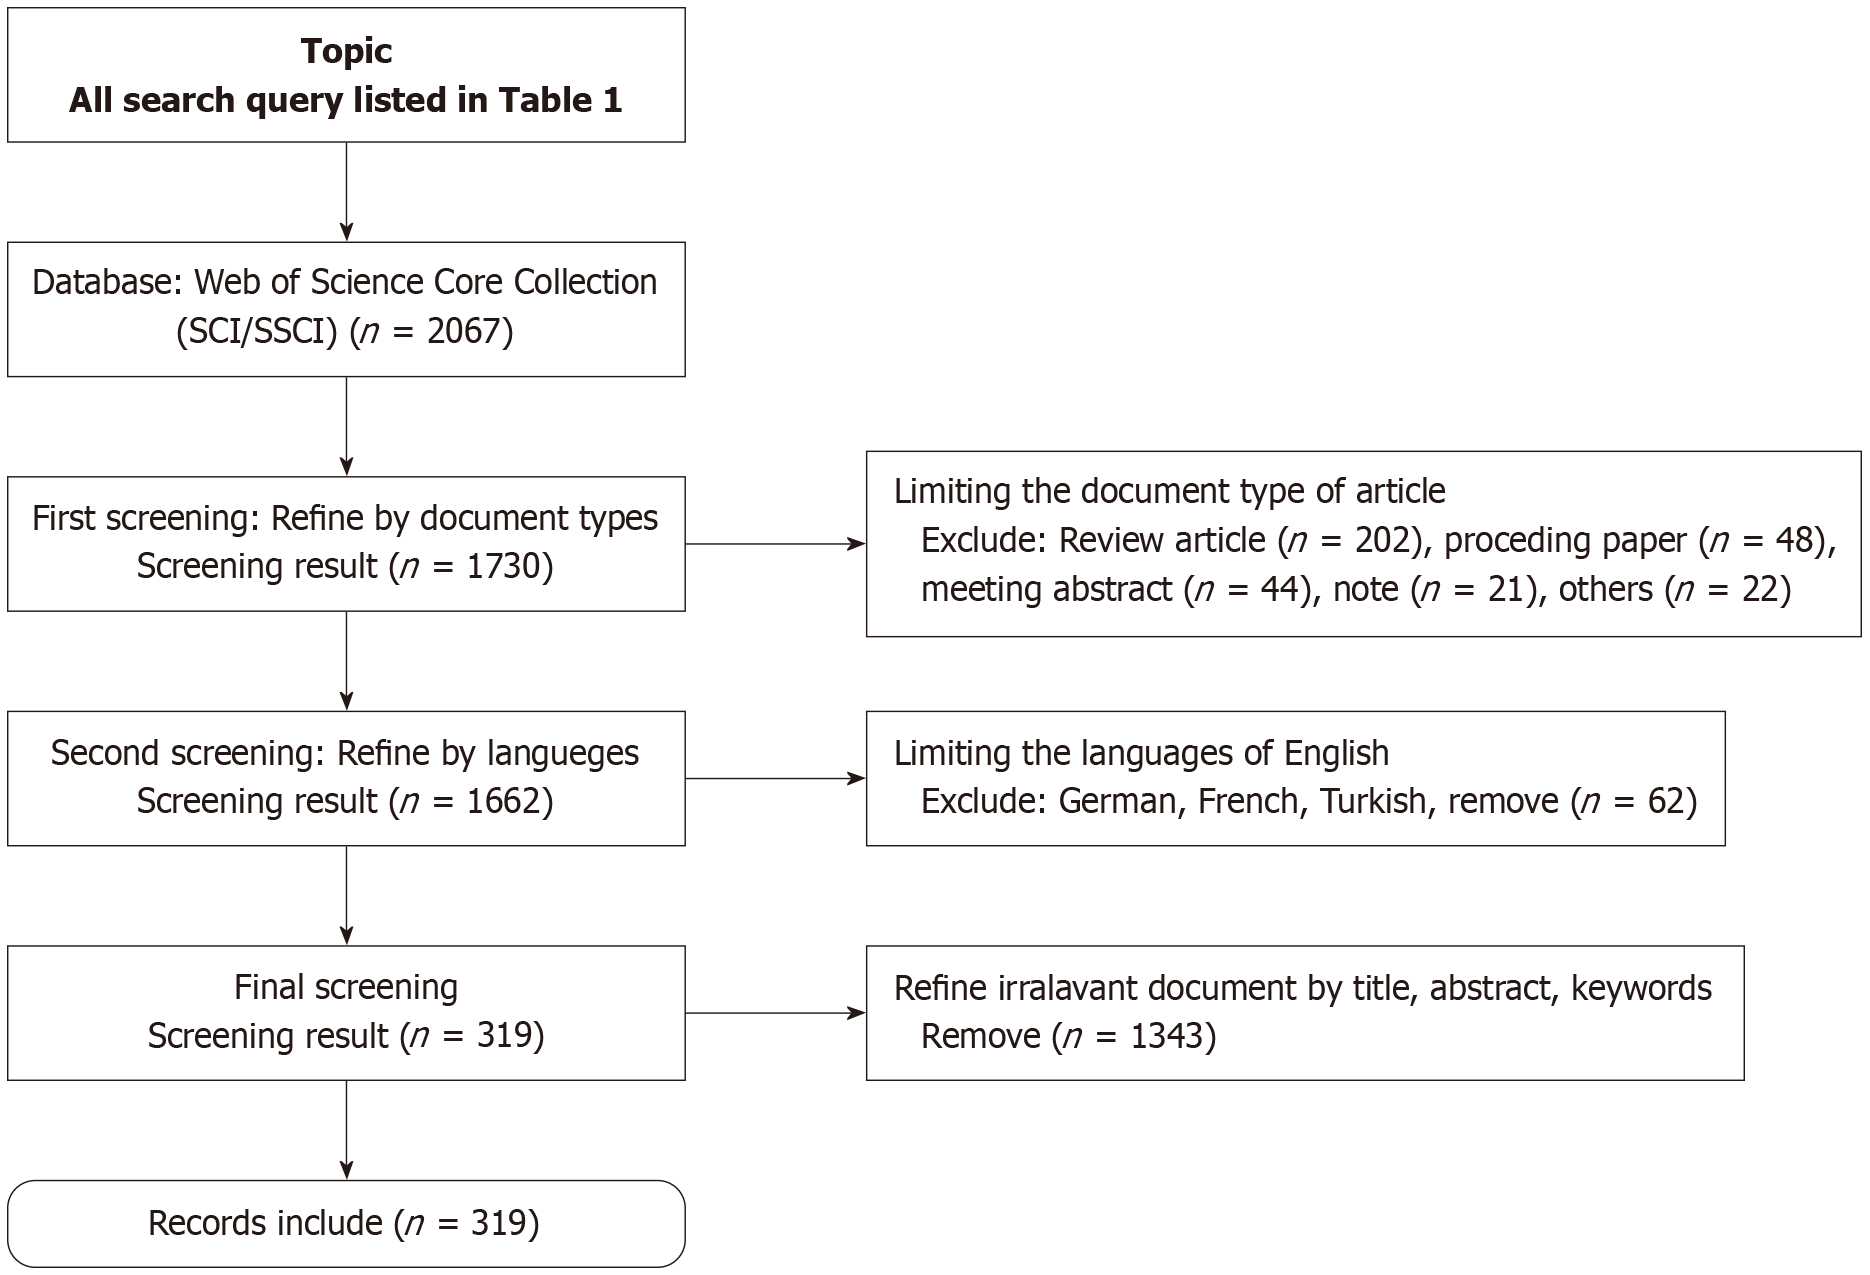
Figure 1
Flowchart for selecting references for the current study.
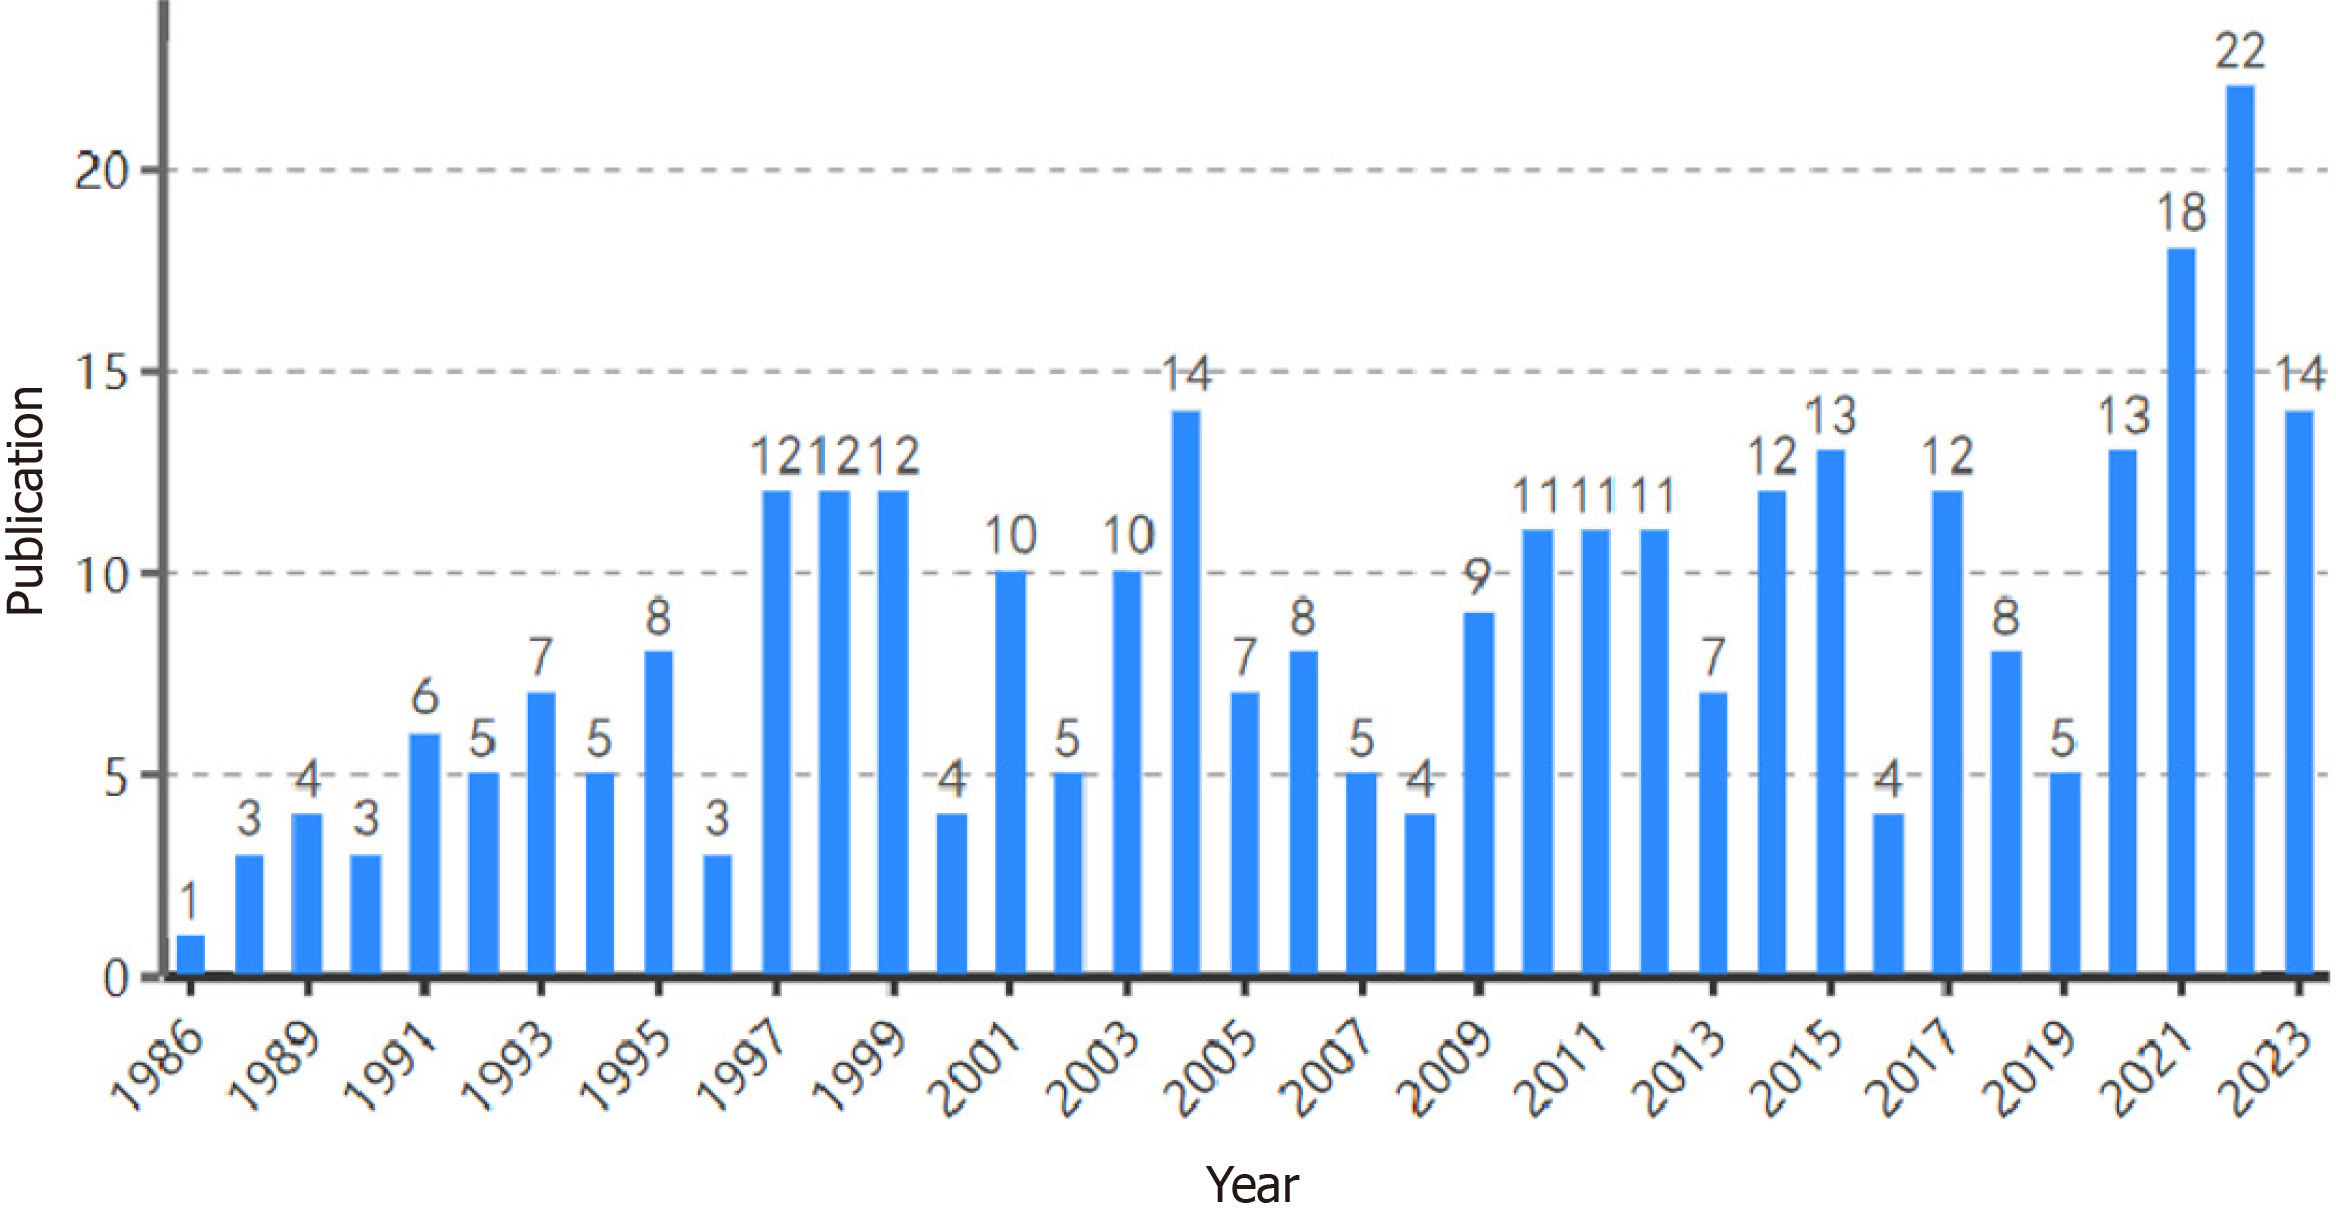
Figure 2 Publication product.
Number of articles per year from 1983 to 2023.
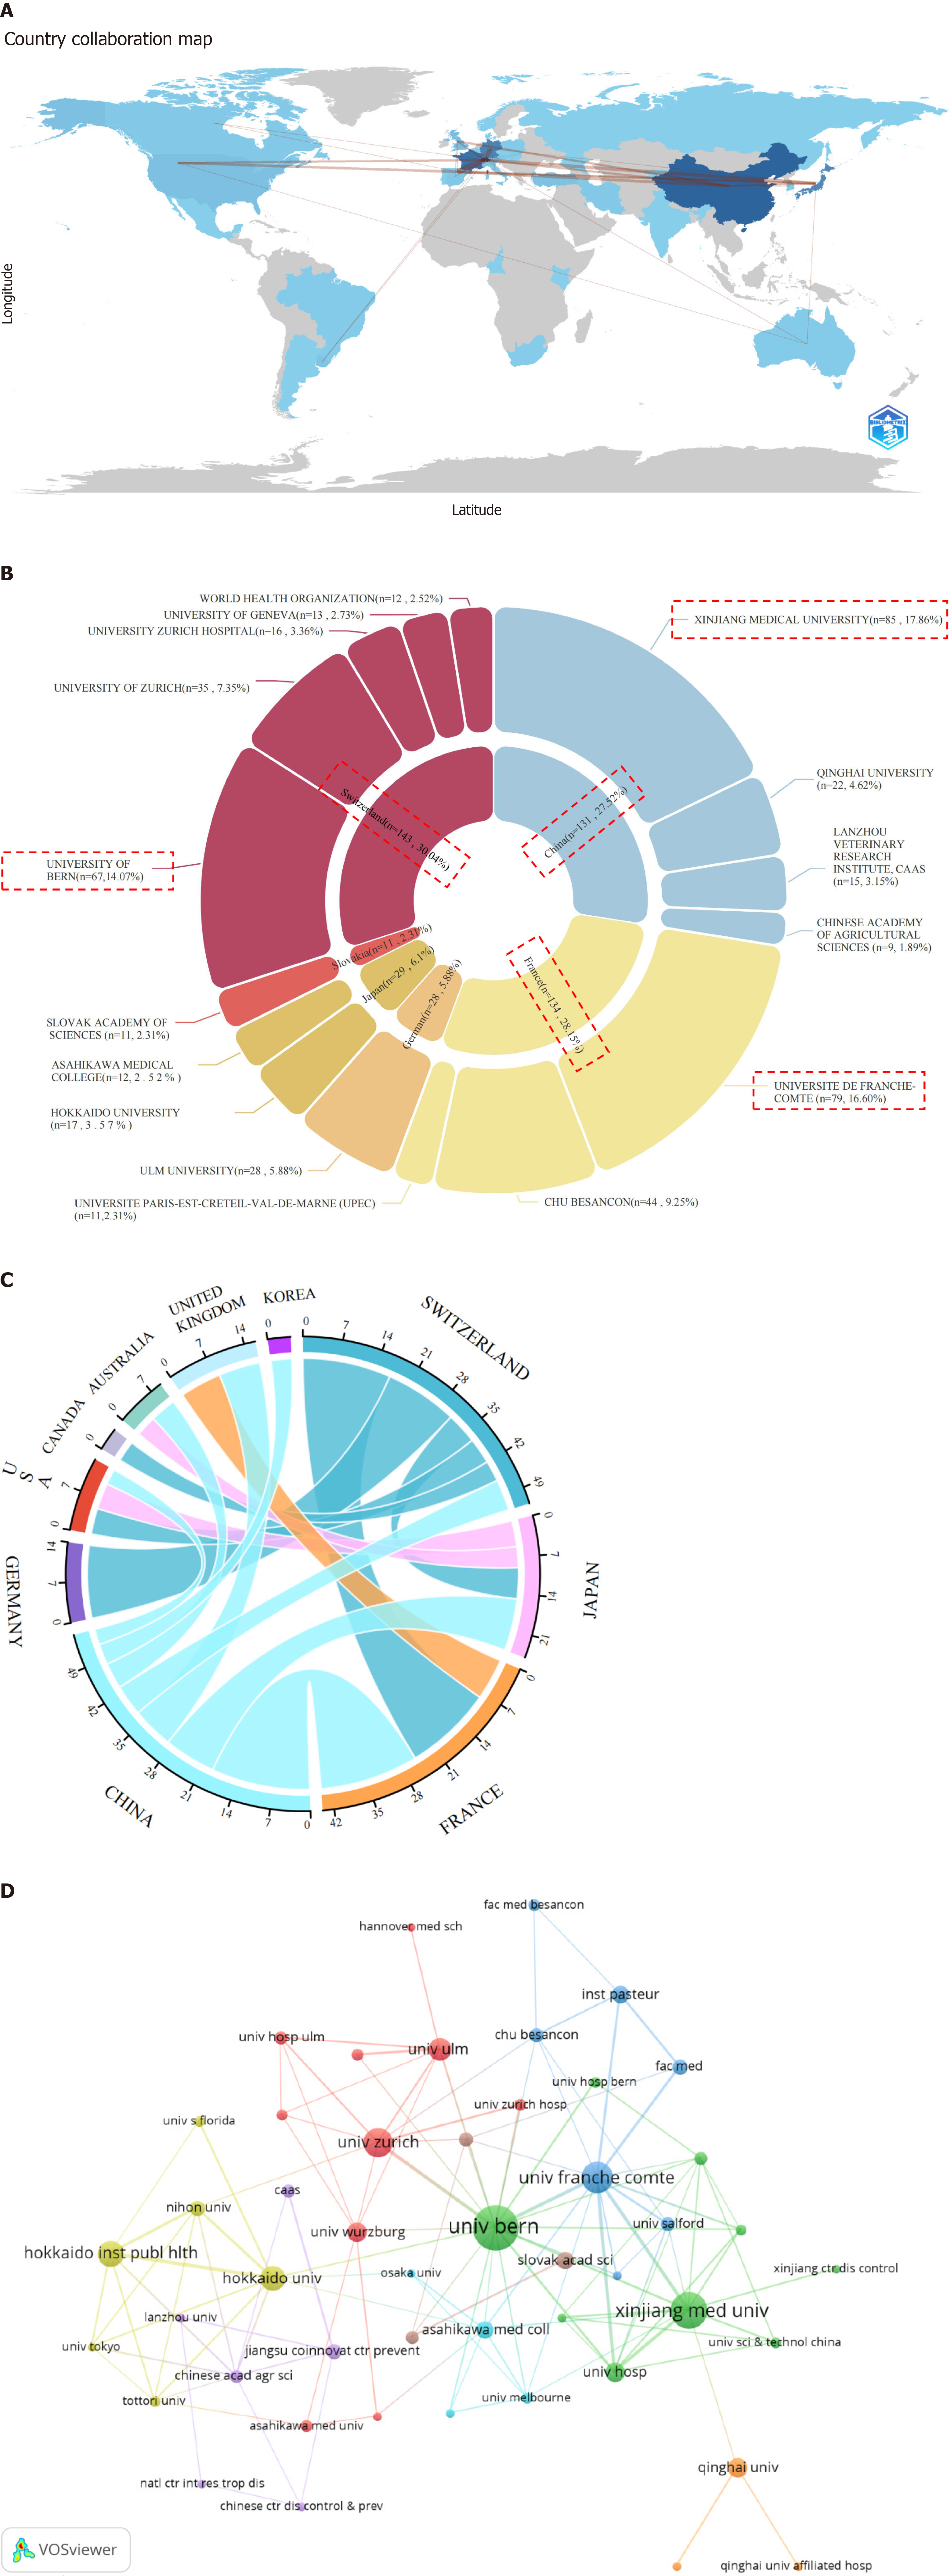
Figure 3 Country scientific production.
A: Country collaboration map; B: The leading countries and institutions with the highest number of publications; C: International cooperation; D: Institutional collaboration networks.
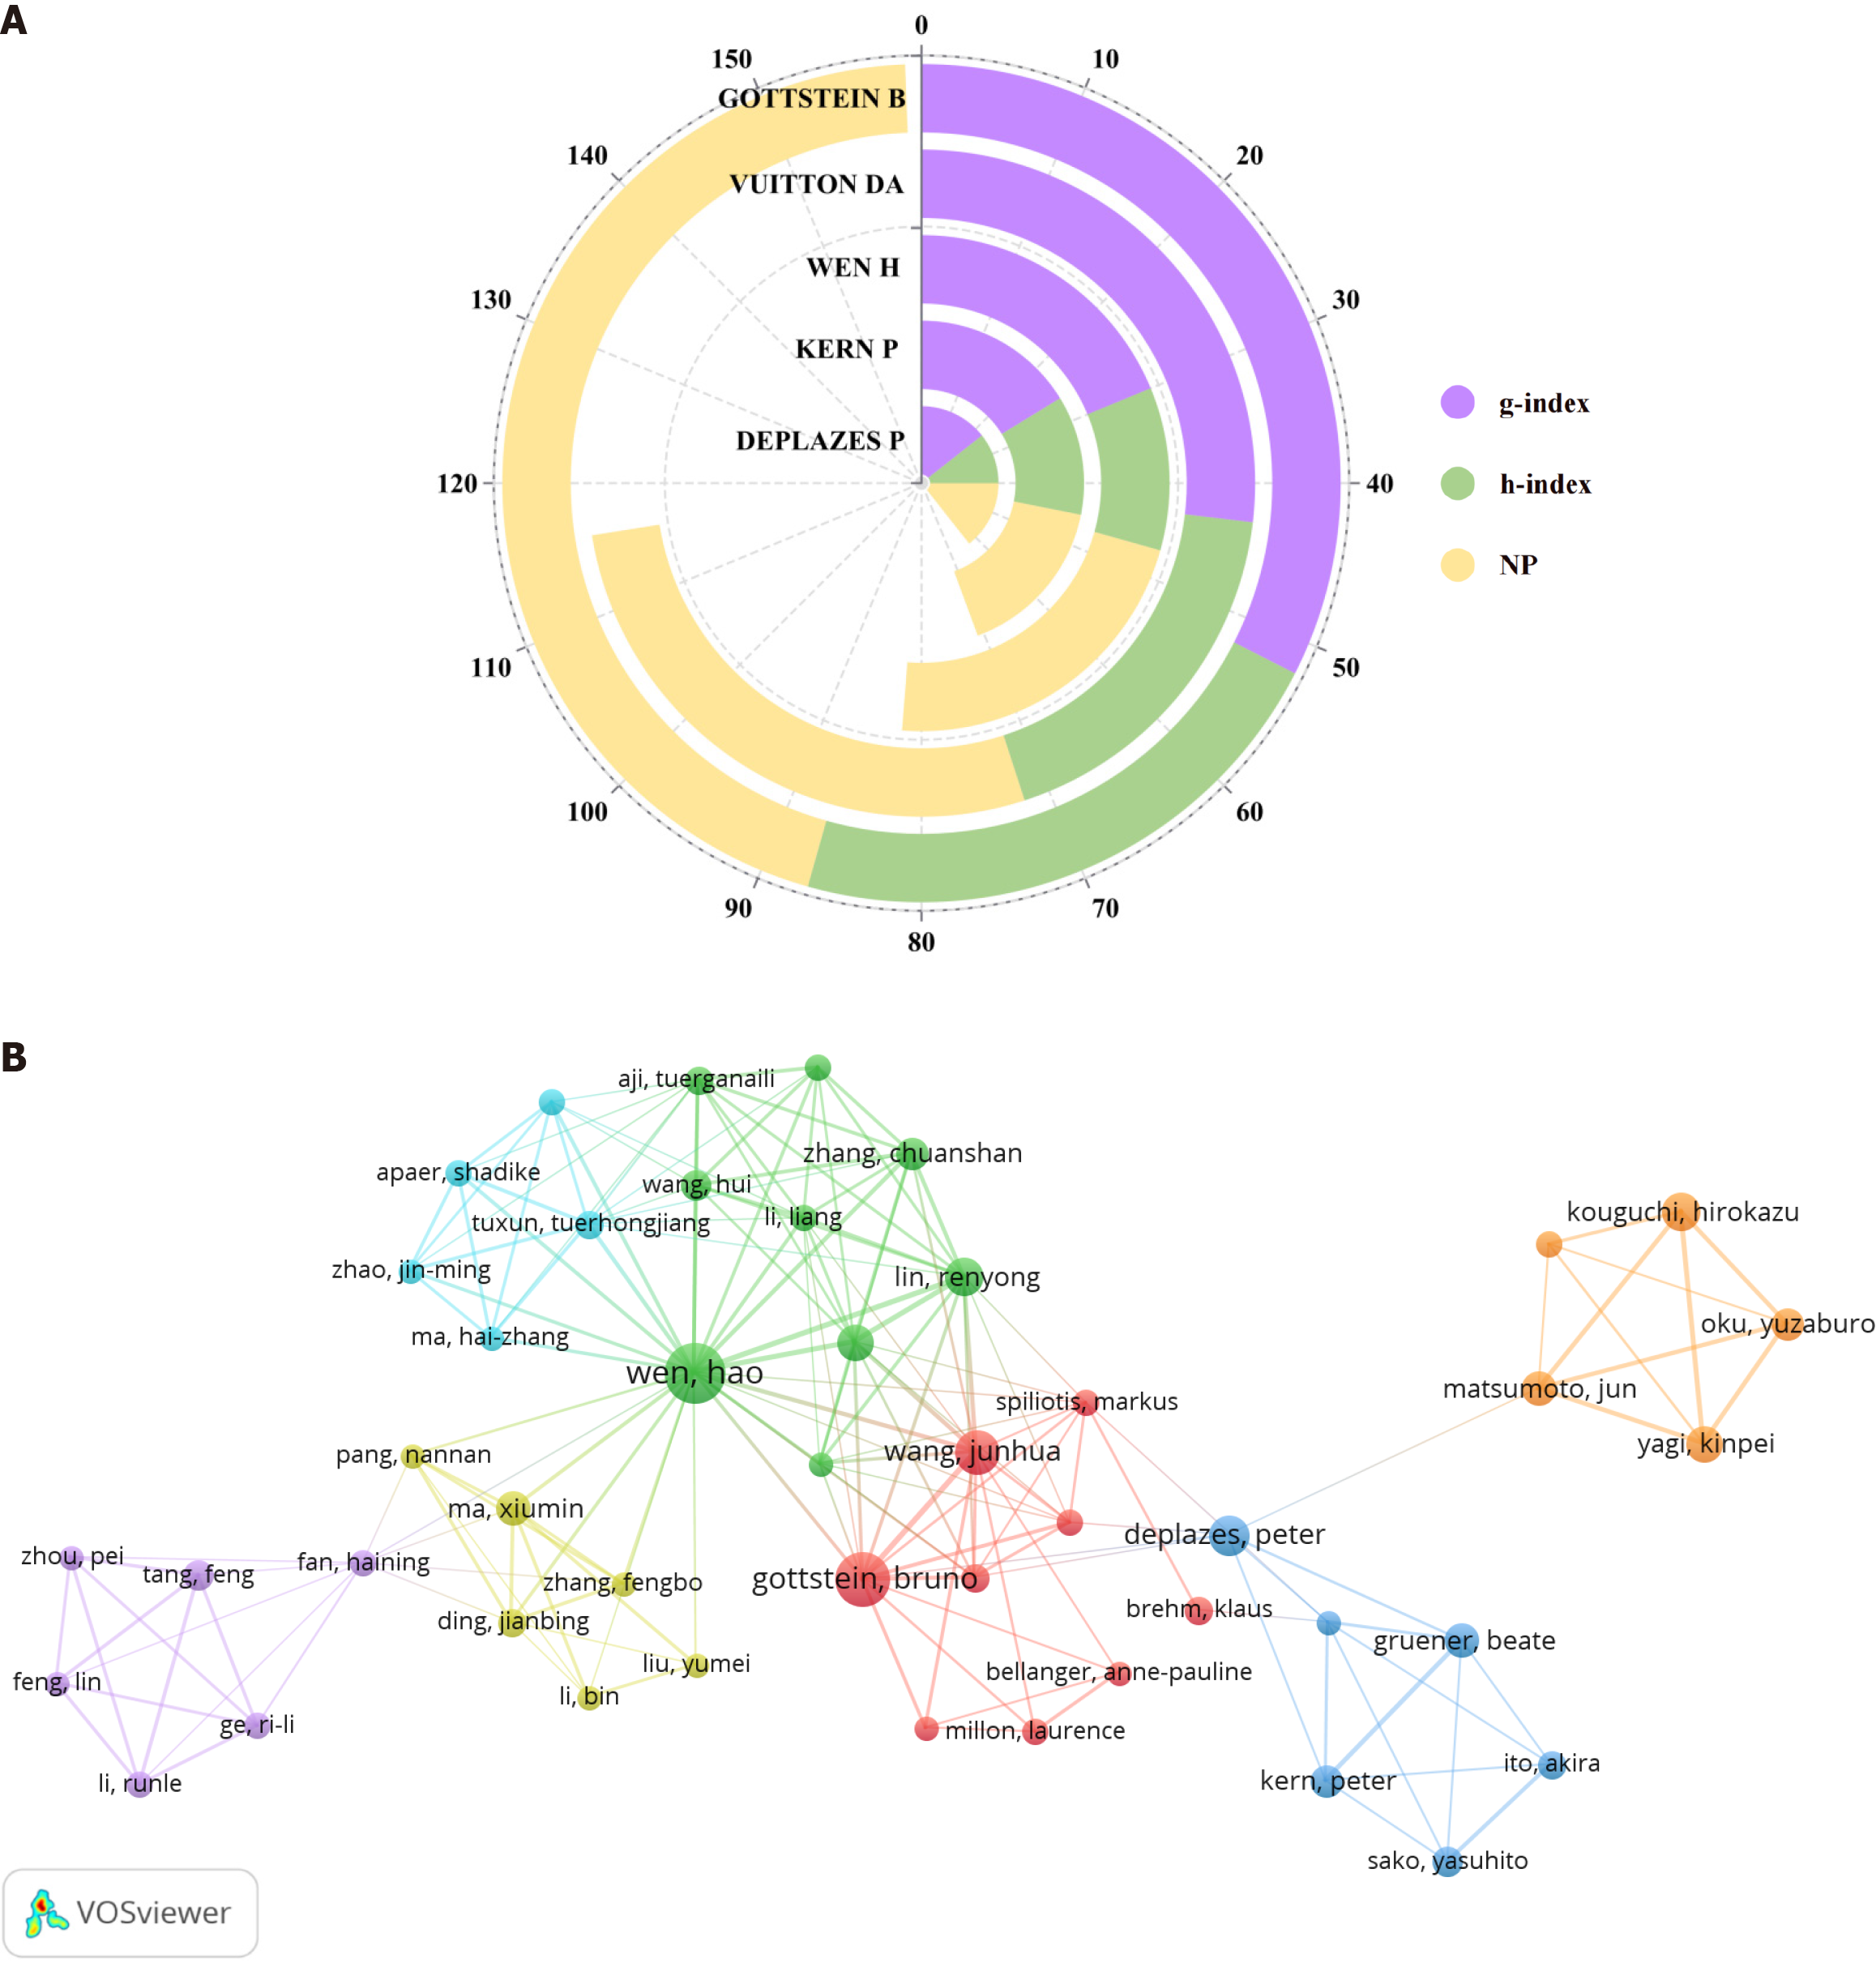
Figure 4 Analysis of author.
A: Analysis of author influence; B: Collaboration network.
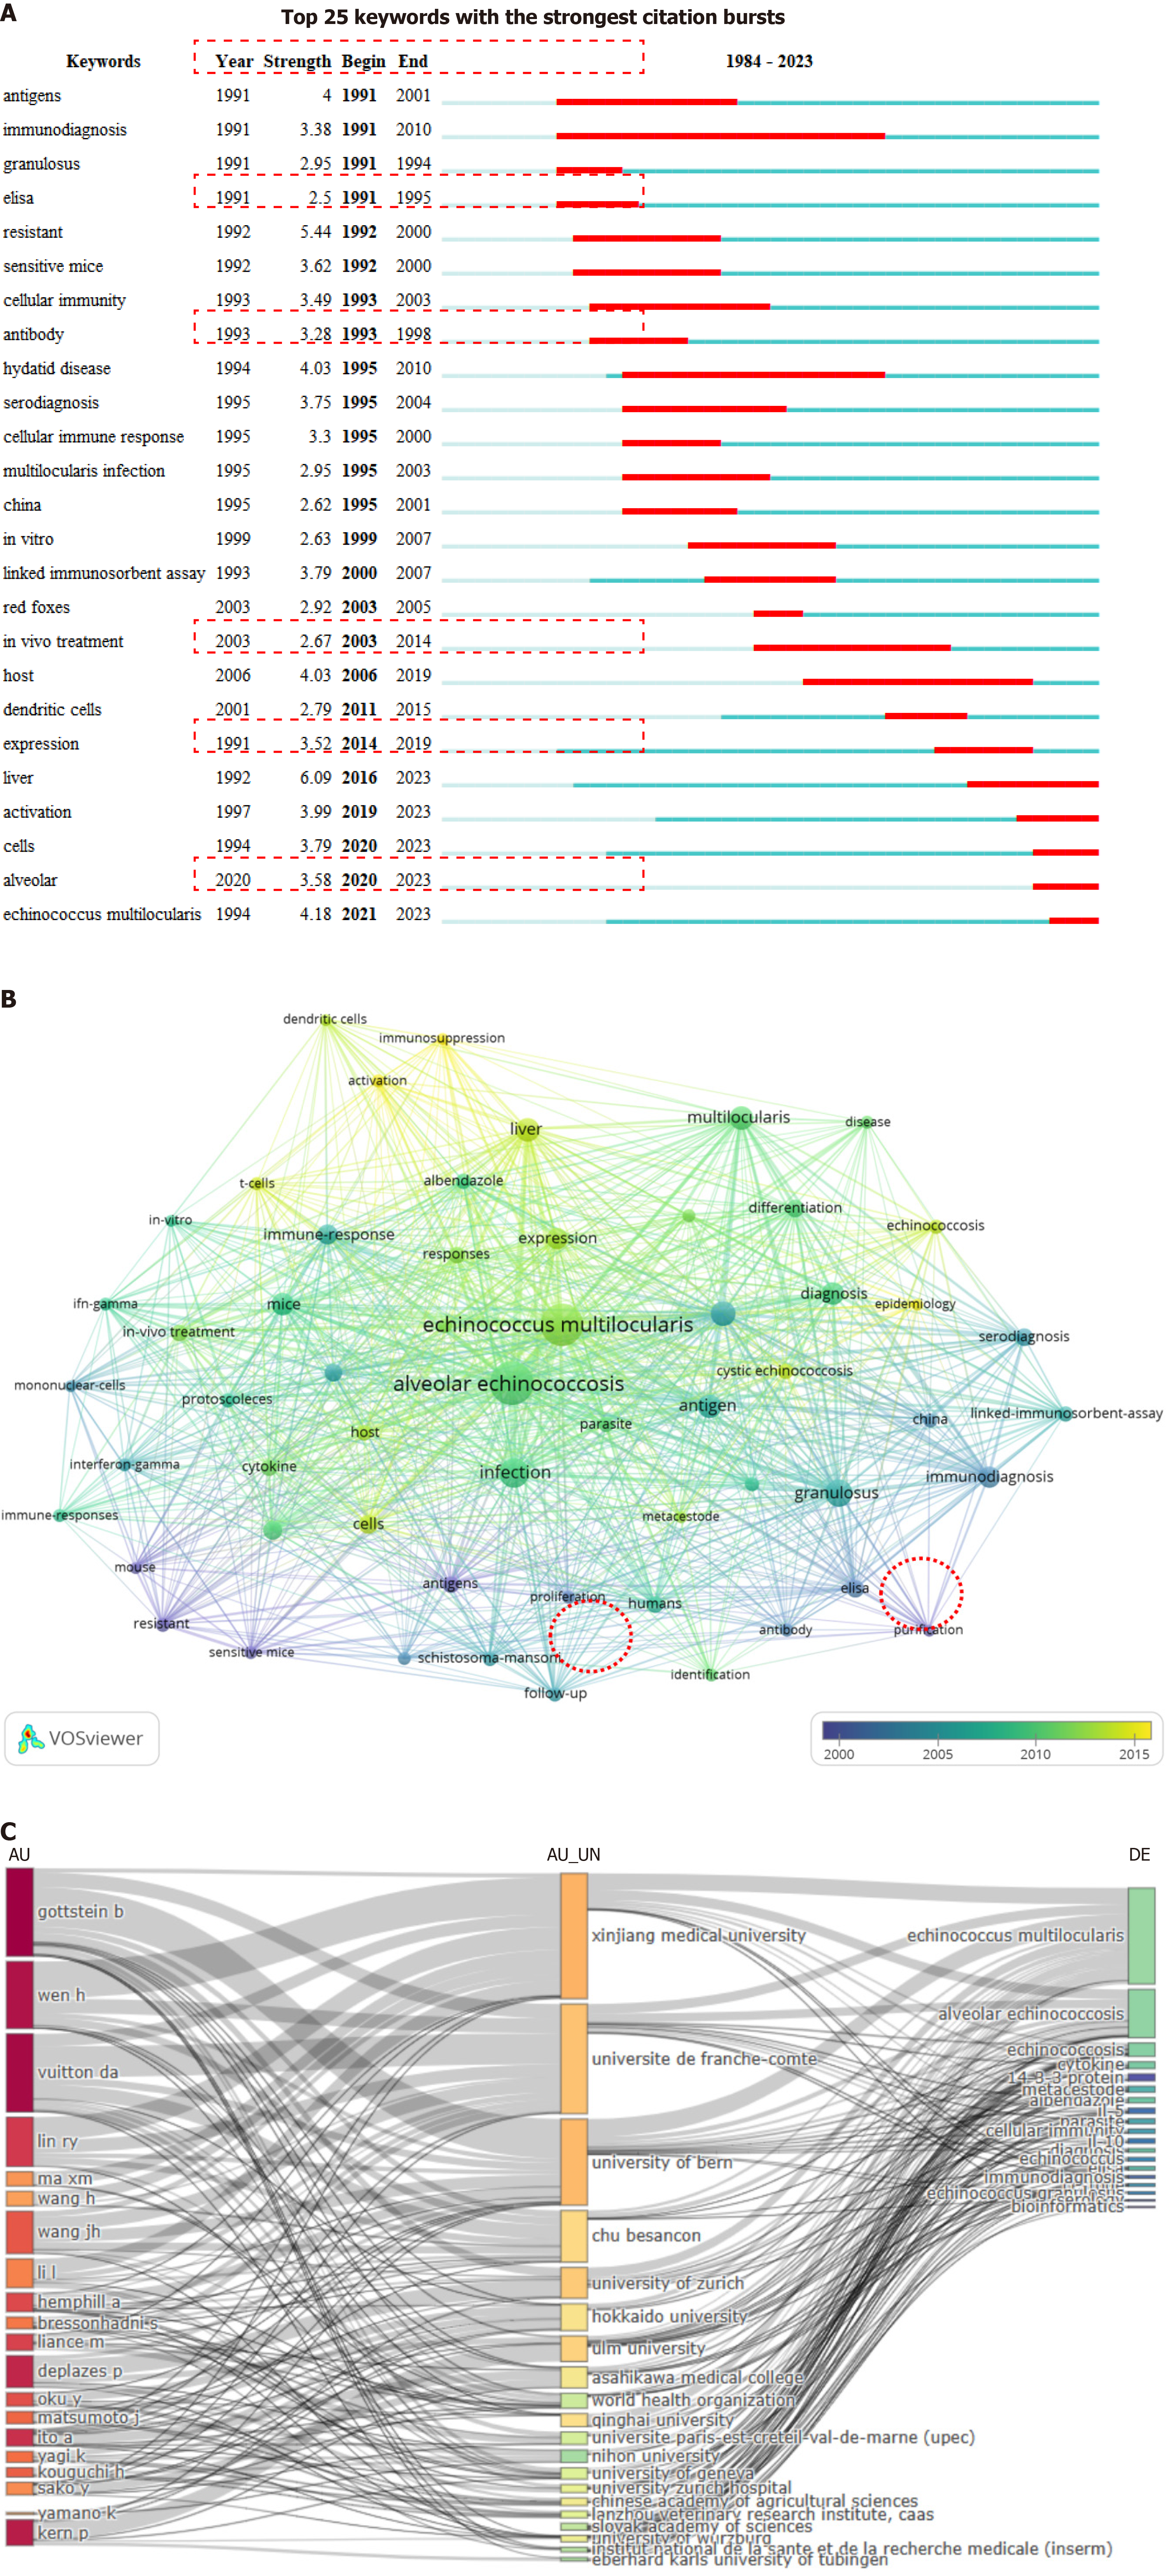
Figure 5 Research hotpots on hepatic alveolar echinococcosis.
A: The 25 keywords with the strongest citation bursts; B: Network of keywords; C: Three-field plot. Left field: Author; Middle field: Affiliation; Right field: Keyword.
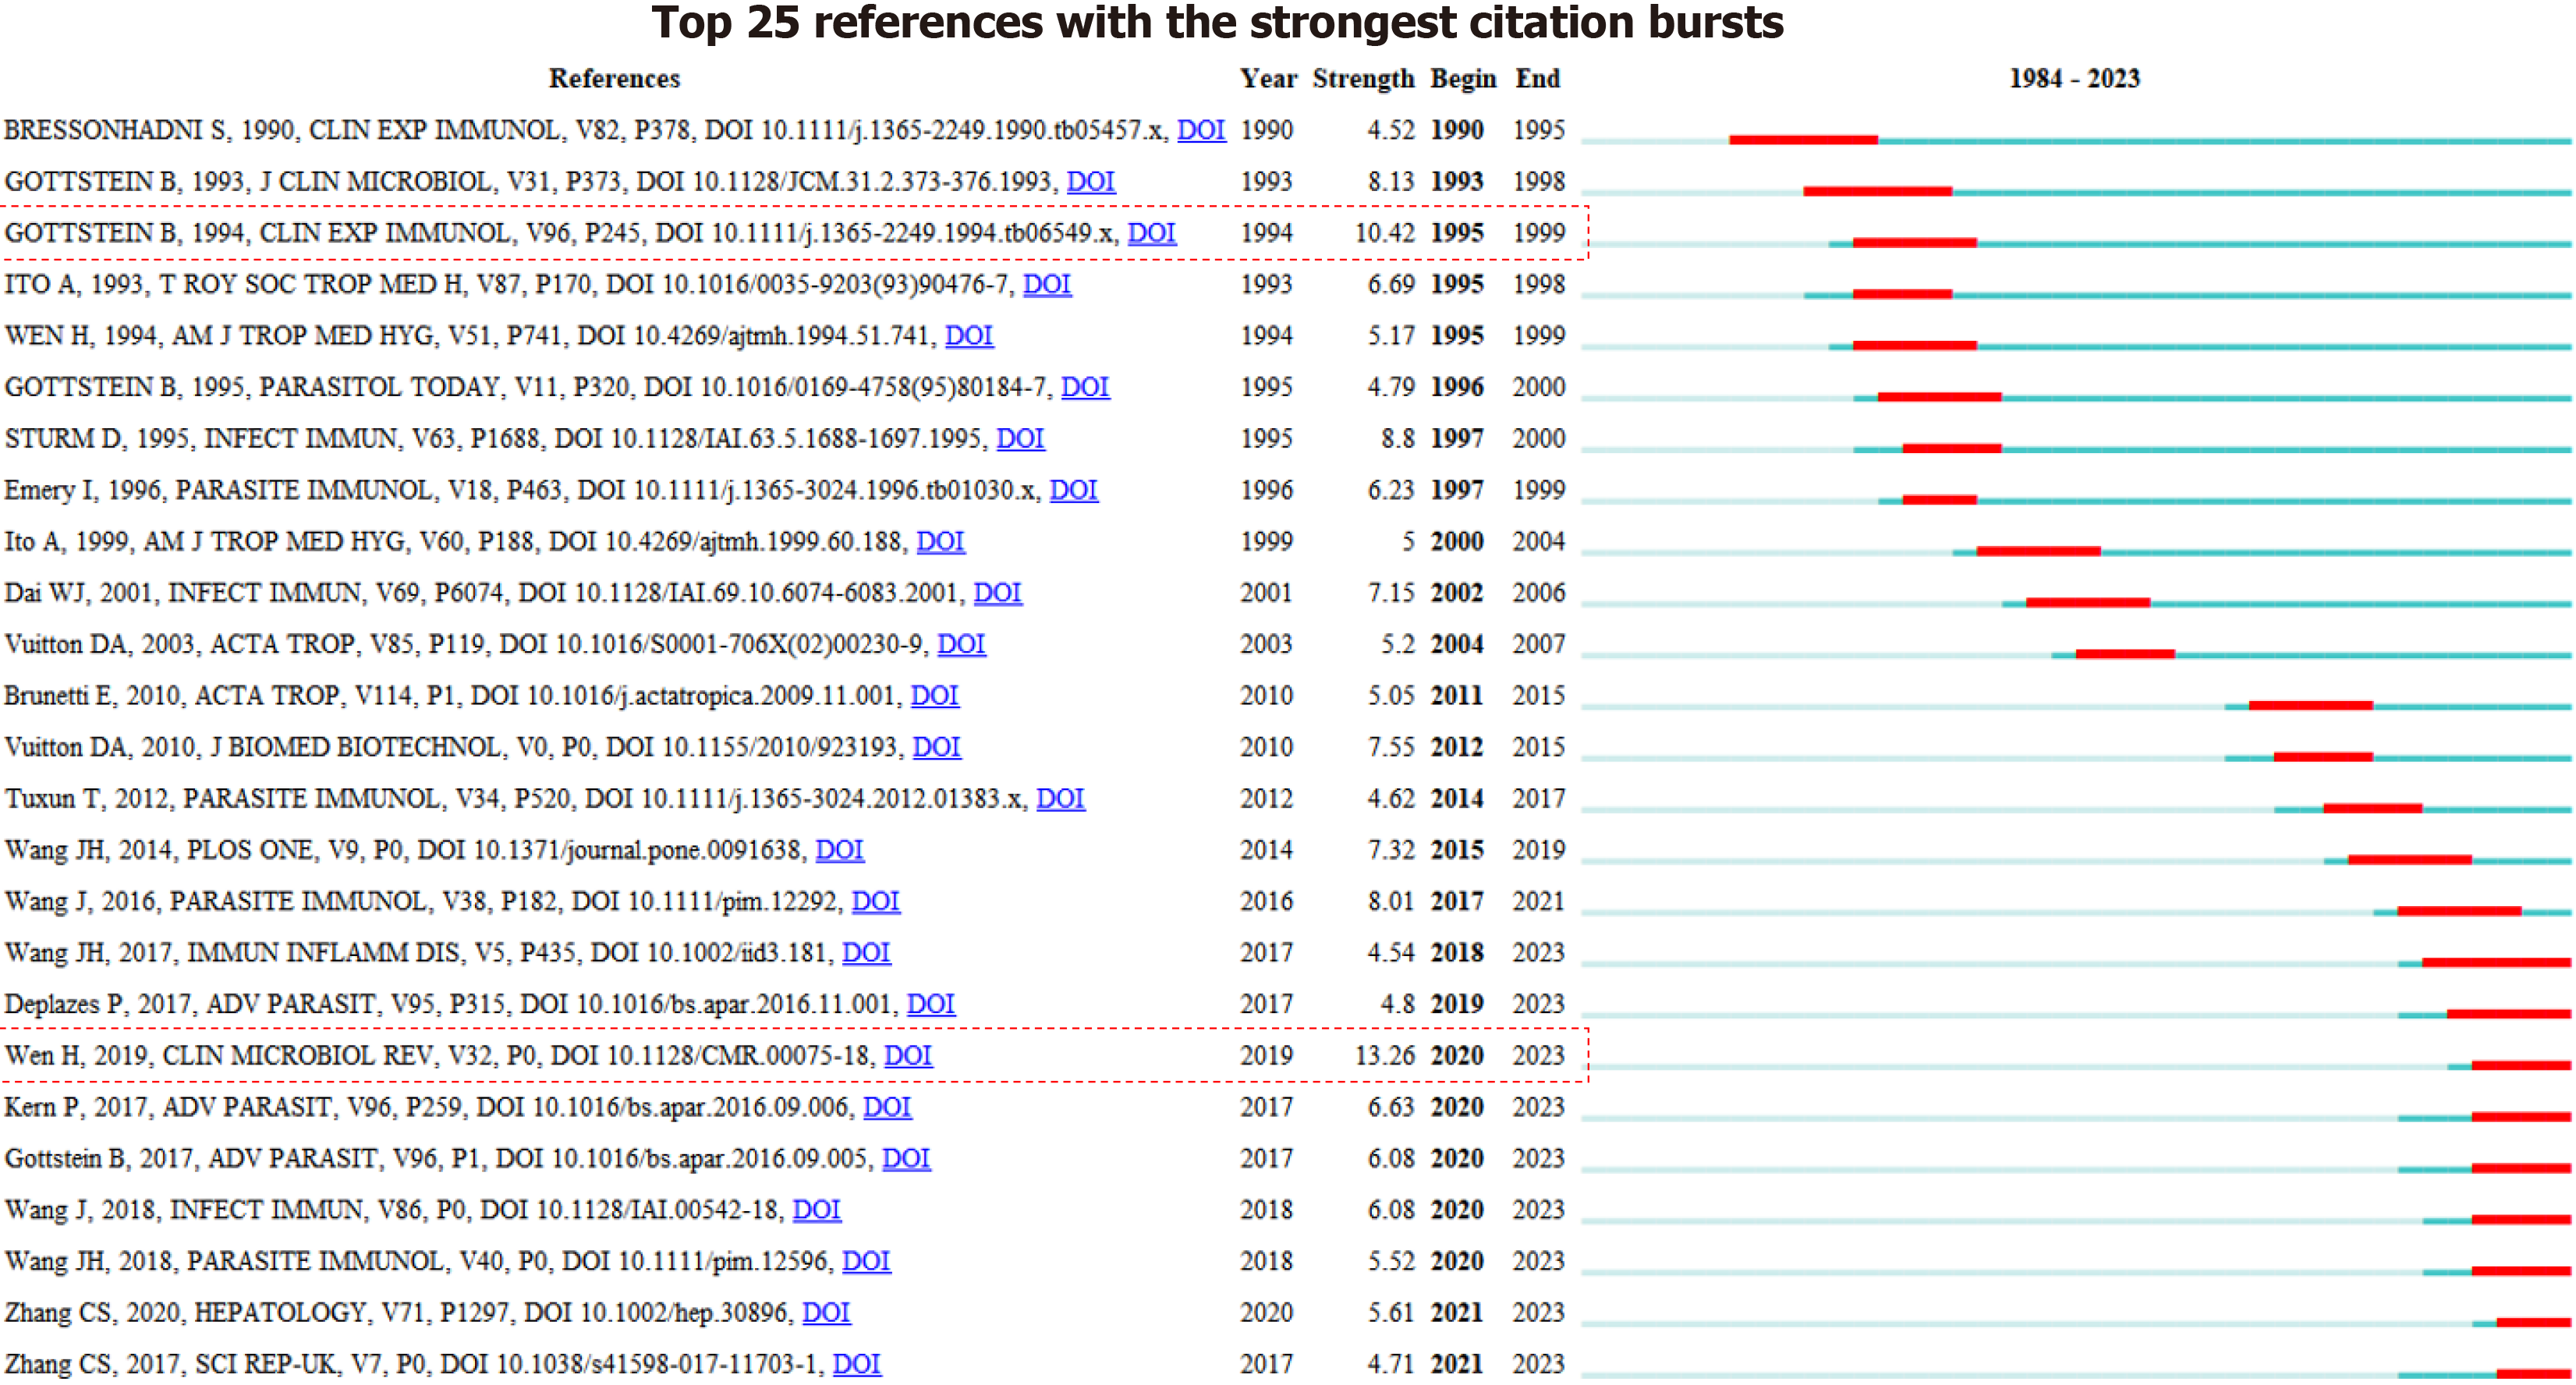
Figure 6 Analysis of references.
Top 25 references with the strongest citation bursts. The bars in red represent for a burst period for the references.
- Citation: Tulading A, Wu J, Zhang YF, Mamuti A, Azhati Y, Lv CH, Tuersunmaimaiti A, Tuxun T. Immunological landscape of hepatic alveolar echinococcosis: A bibliometric analysis. World J Hepatol 2025; 17(2): 102001
- URL: https://www.wjgnet.com/1948-5182/full/v17/i2/102001.htm
- DOI: https://dx.doi.org/10.4254/wjh.v17.i2.102001


