Copyright
©The Author(s) 2025.
World J Hepatol. Feb 27, 2025; 17(2): 100923
Published online Feb 27, 2025. doi: 10.4254/wjh.v17.i2.100923
Published online Feb 27, 2025. doi: 10.4254/wjh.v17.i2.100923
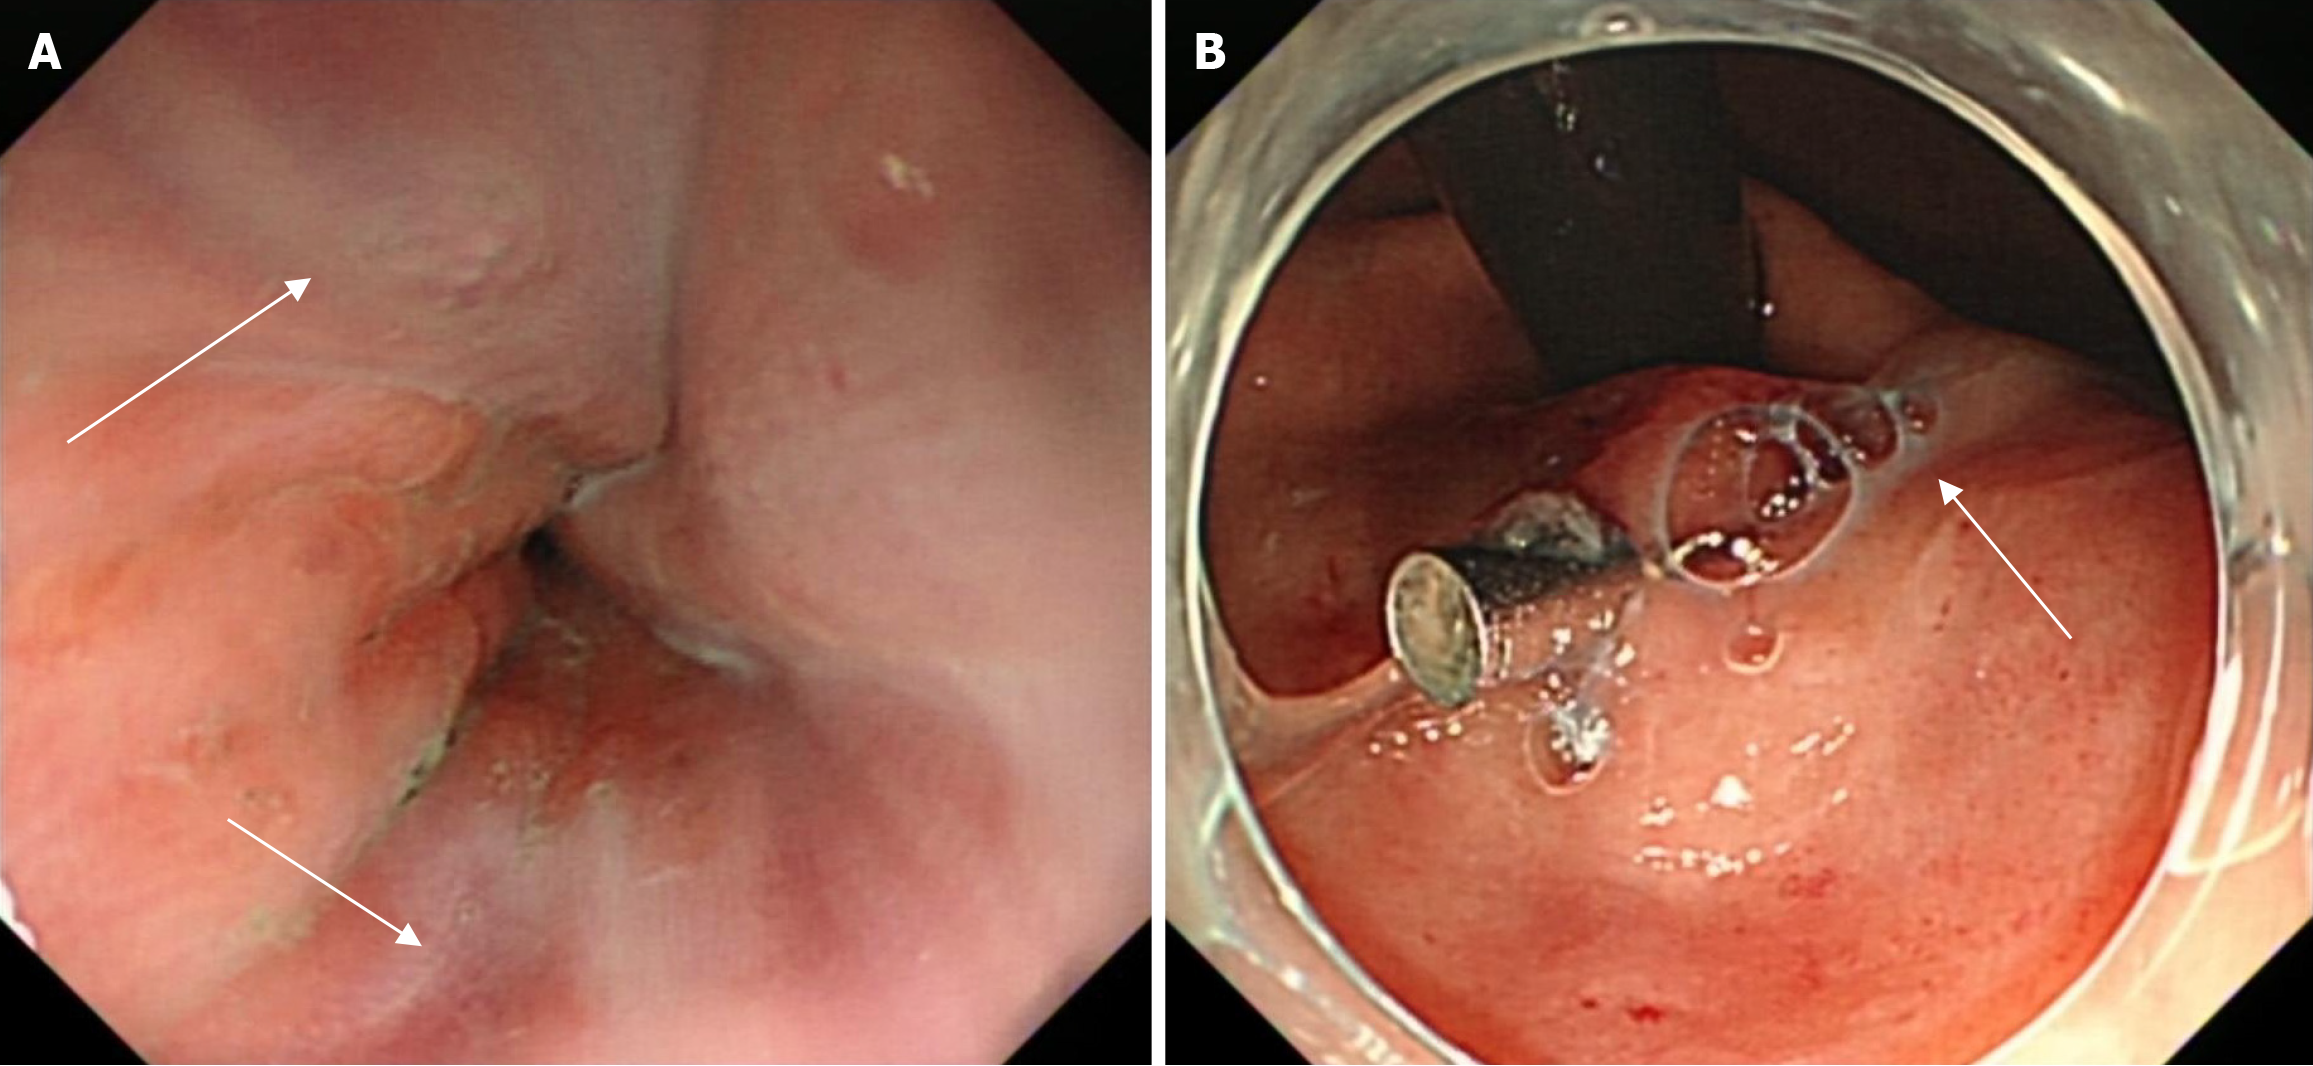
Figure 1 Endoscopic presentation of esophageal varices.
Treatment: 1 titanium clip was inserted to restrict varicose vein flow at the cardia. The varicose vein was embolized using lauromacrogol injection + hydroxyl acrylate + lauromacrogol injection, and the varicose vein in the esophagus was perfused with polyglutethimide. A: Several varicose veins are observed 30 cm from the incisors (white arrow); B: One varicose vein is observed on the side of the cardia’s lesser curvature (white arrow).
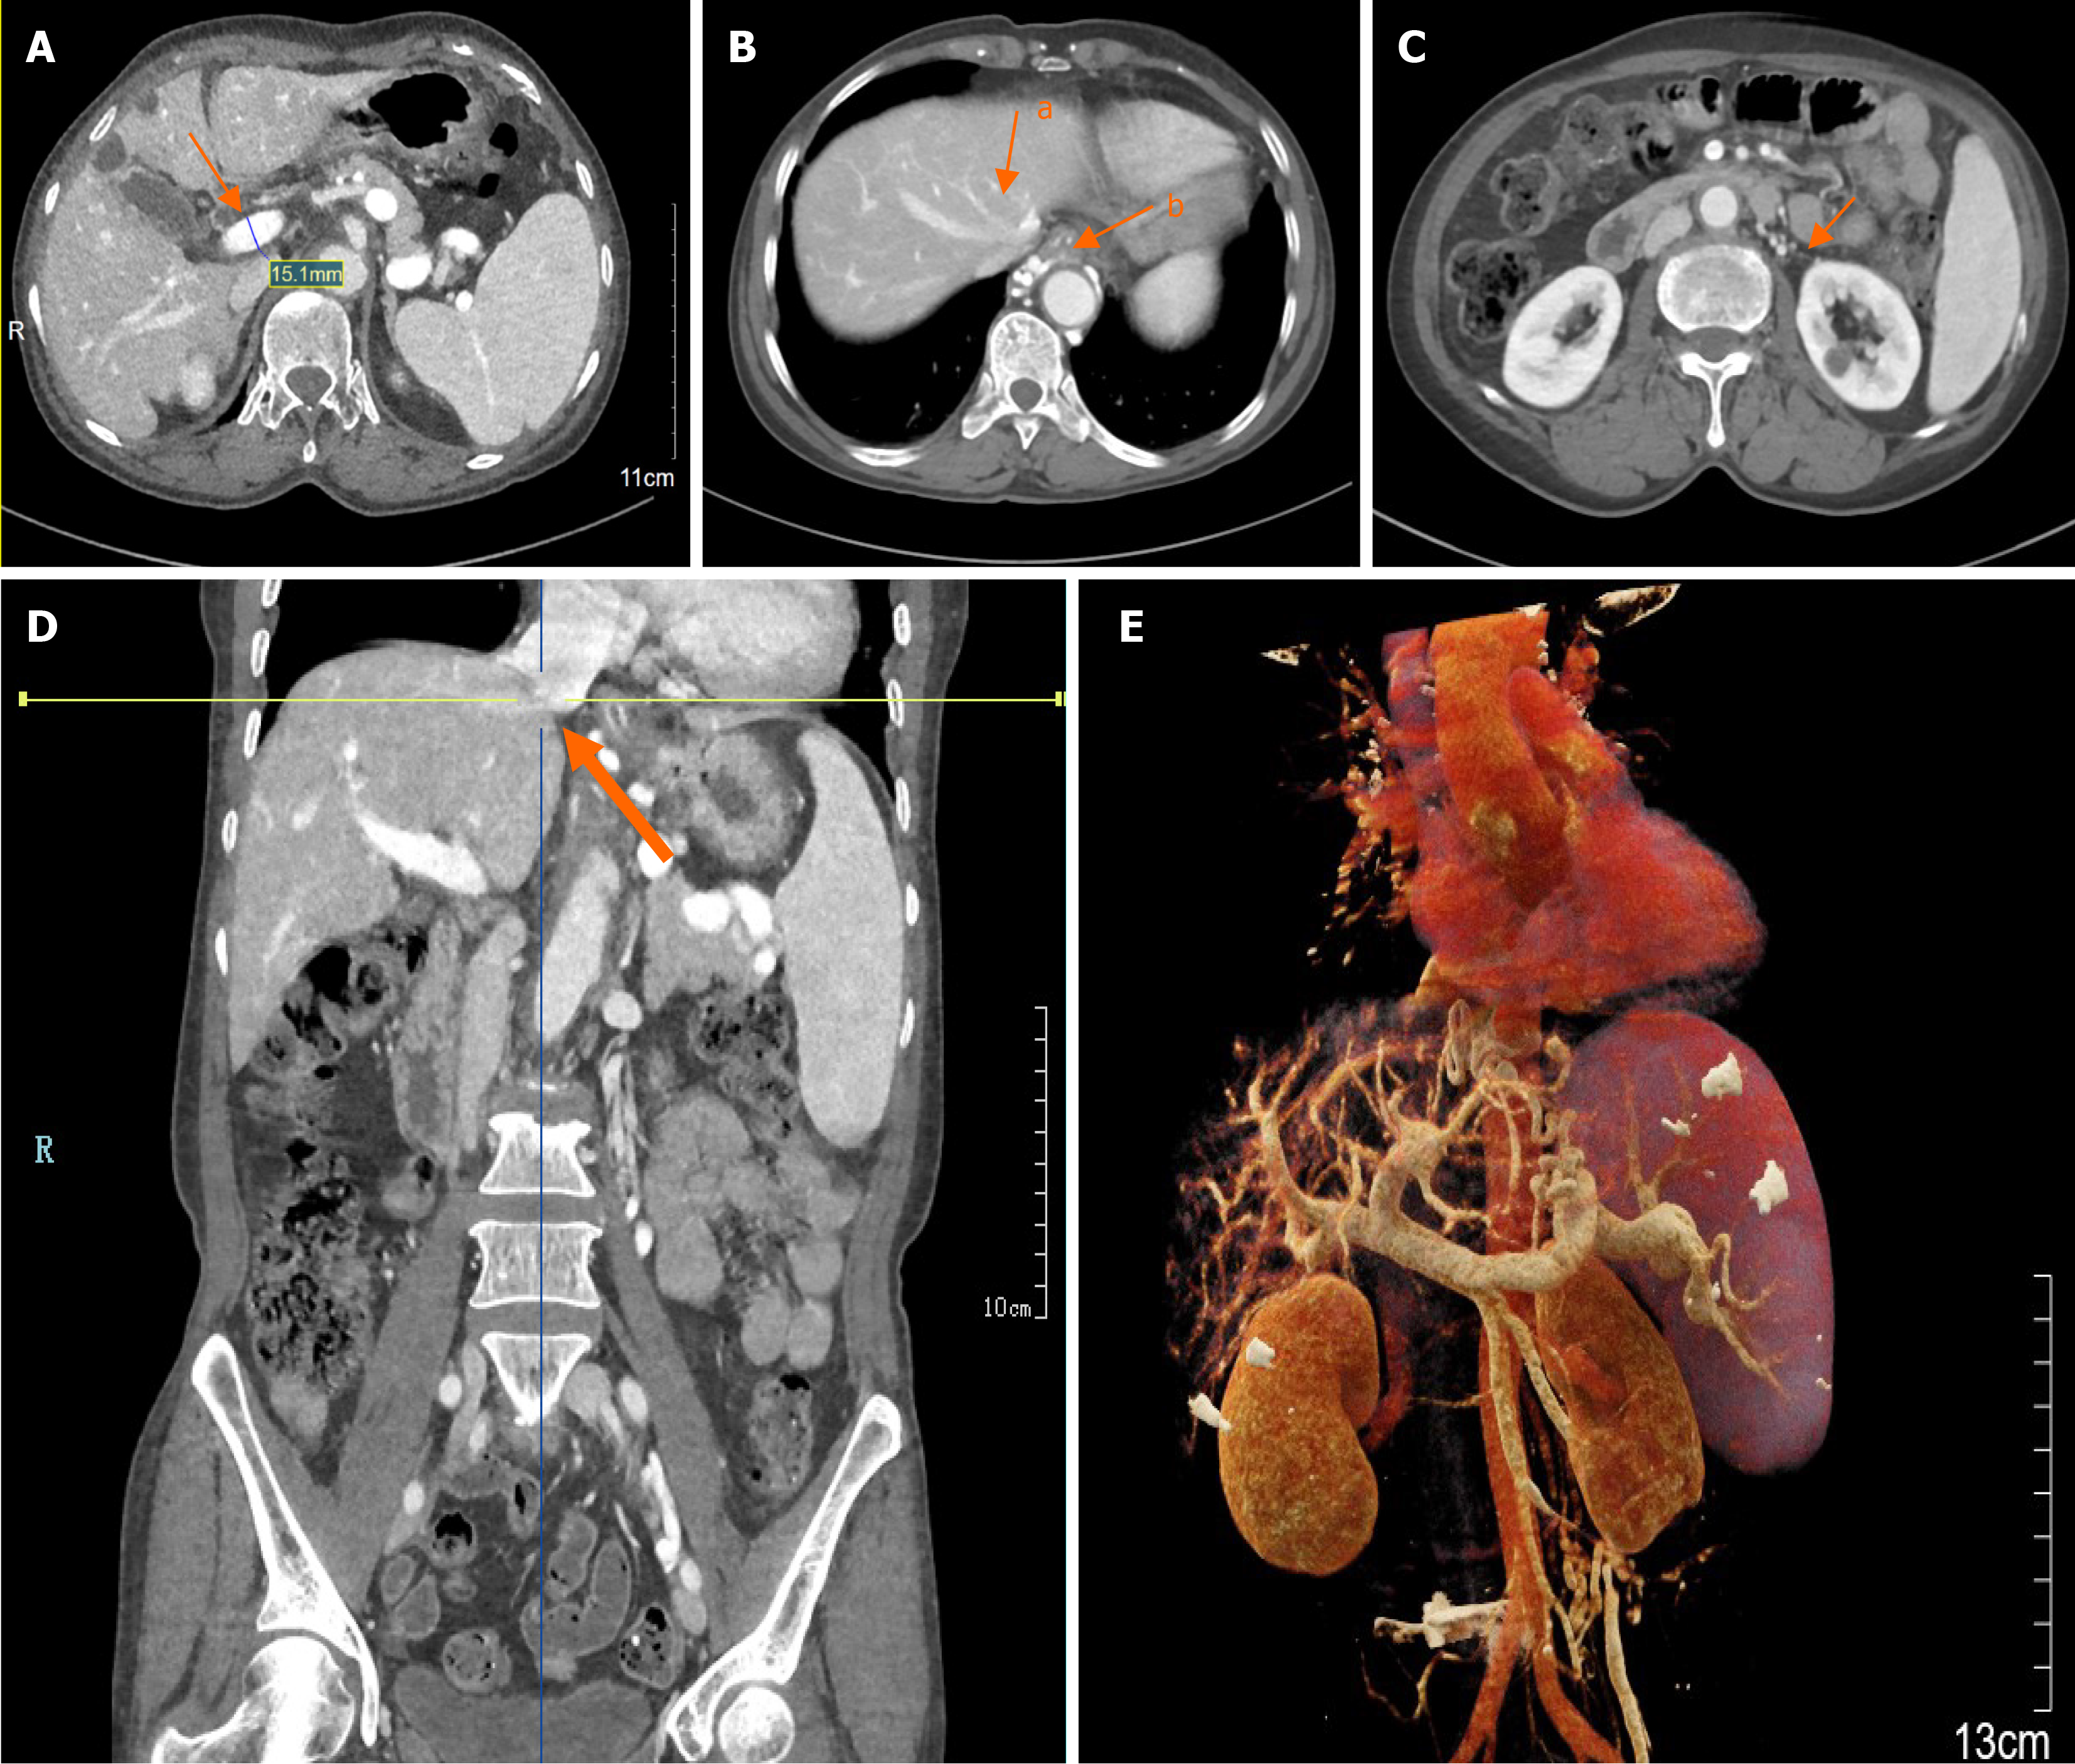
Figure 2 Presentation of portal hypertension on computed tomography.
A: The portal vein is 15.1 mm in diameter and significantly widened; B: Images of the portal venous phase of computed tomography (CT), (arrow a: CT images of the second porta hepatis reveal no obstruction in the secondary portal of the liver. Arrow b: Multiple esophageal varices are observed on enhanced CT); C: The splenorenal shunt is seen in the portal venous phase; therefore, the varicose vein near the cardia was clamped under endoscopic treatment before injection; D: Sagittal screenshot of the second porta hepatis in the portal venous phase of CT; The orange arrow indicates the intersection of the two lines where the hepatic vein joins the inferior vena cava, and there is no obvious obstruction; E: The CT portal vein reconstruction reveals no significant obstructions.
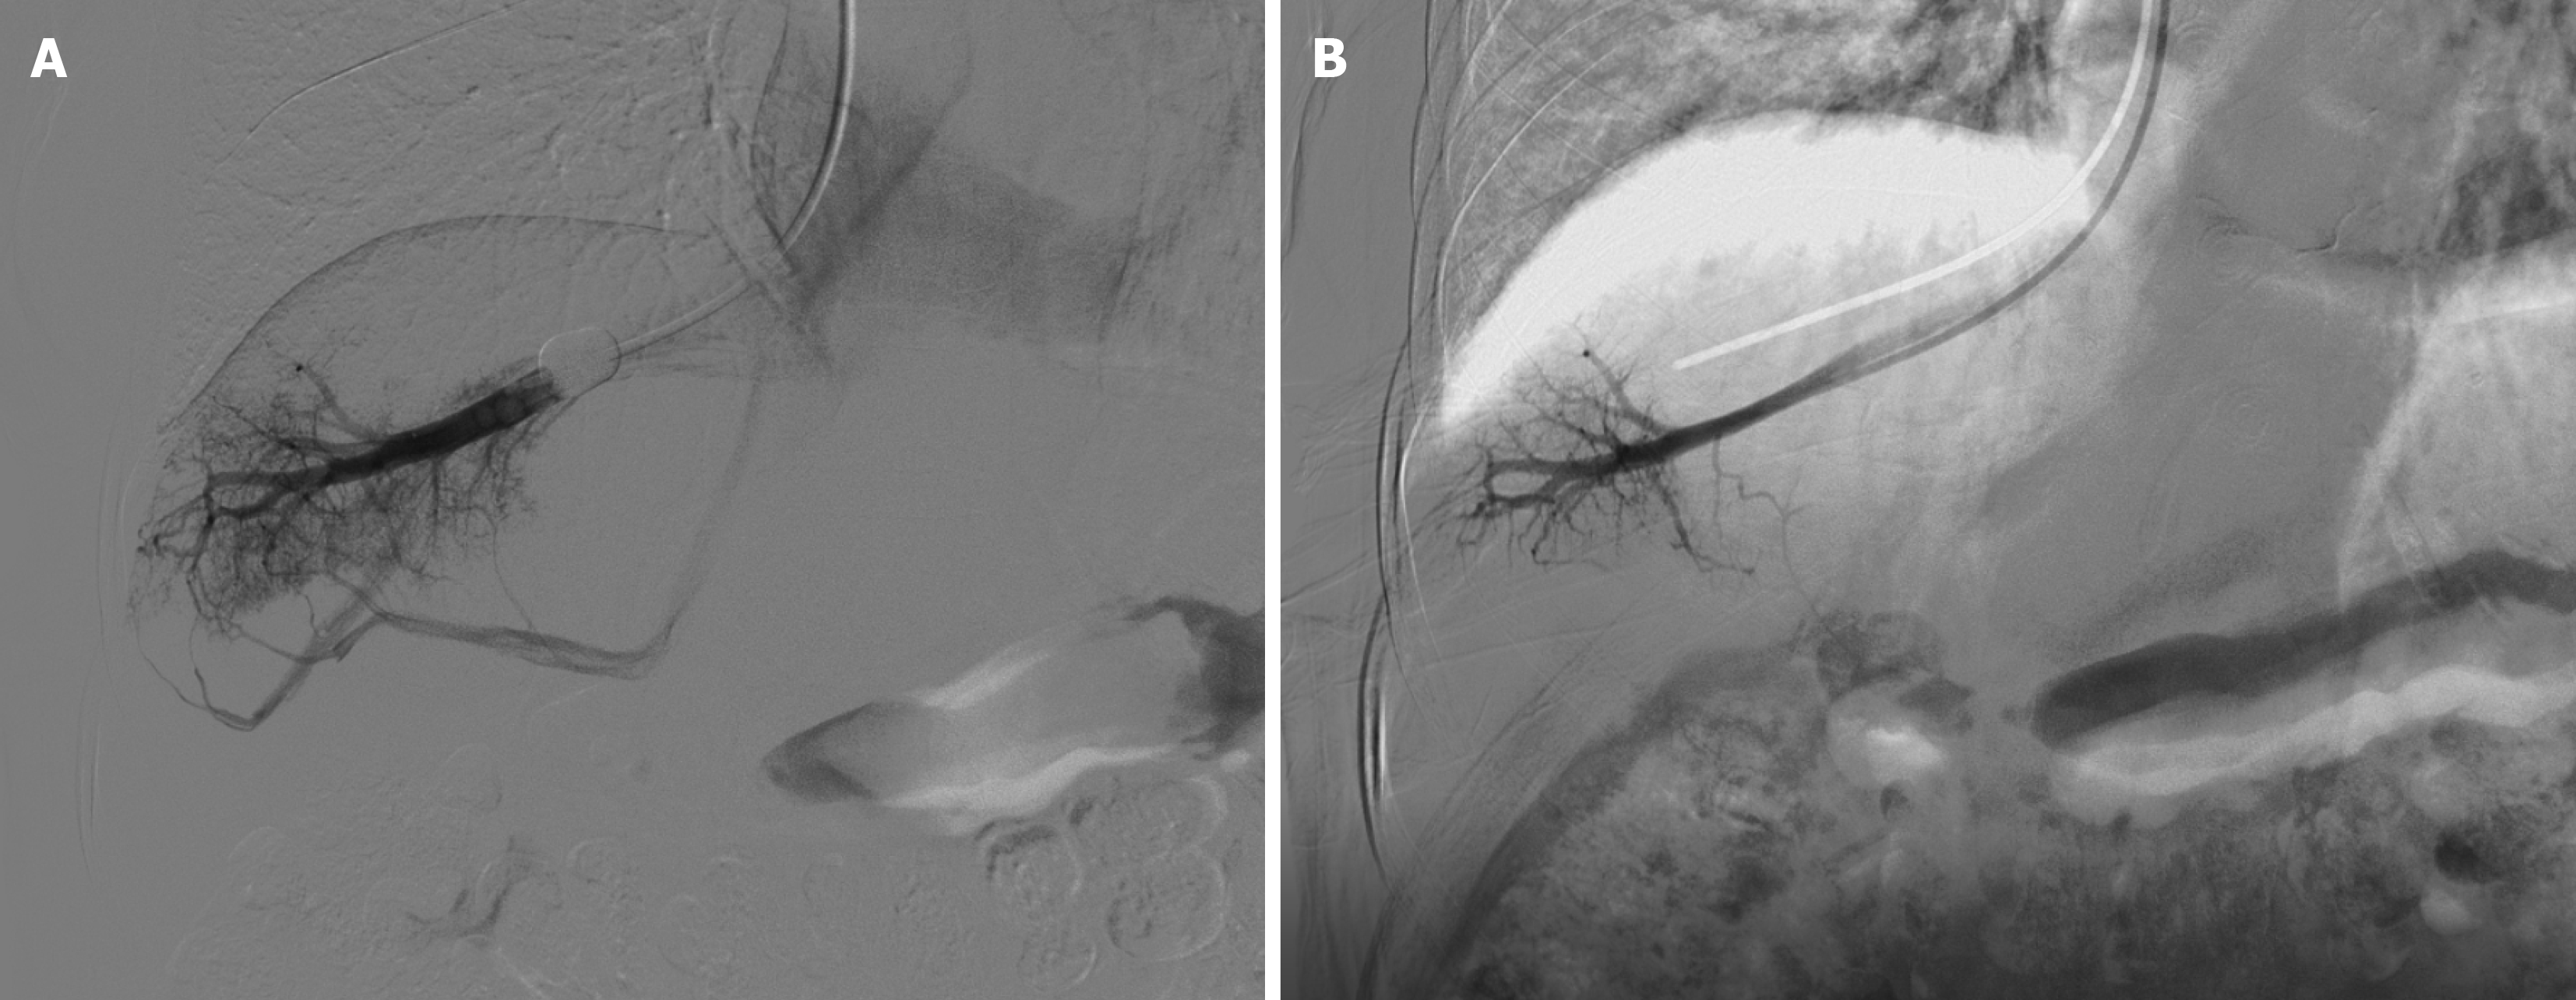
Figure 3 Measurement of wedged hepatic venous pressure.
A: The wedged hepatic venous pressure of the horizontal branch of the right hepatic vein is 16 mmHg. The contrast following balloon occlusion suggests compensatory visualization of the subhepatic vein, resulting in a pressure that is lower than the actual pressure; B: The free hepatic vein pressure is 11 mmHg when the balloon is unfilled.
Figure 4 Presentation on pathologic tissue sections.
A: Multiple small dilated veins are observed in certain confluent areas, with some herniated into the surrounding hepatic parenchyma, the small bile ducts appear normal, and no infiltration of inflammatory cells is seen; B: Some confluent areas are mildly fibrotic, and the small portal veins are occluded; C: CD34 staining reveals occluded portal veins (orange arrow).
- Citation: Liu XC, Yan HH, Wei W, Du Q. Idiopathic portal hypertension misdiagnosed as hepatitis B cirrhosis: A case report and review of the literature. World J Hepatol 2025; 17(2): 100923
- URL: https://www.wjgnet.com/1948-5182/full/v17/i2/100923.htm
- DOI: https://dx.doi.org/10.4254/wjh.v17.i2.100923


