Copyright
©The Author(s) 2025.
World J Hepatol. Jan 27, 2025; 17(1): 100377
Published online Jan 27, 2025. doi: 10.4254/wjh.v17.i1.100377
Published online Jan 27, 2025. doi: 10.4254/wjh.v17.i1.100377
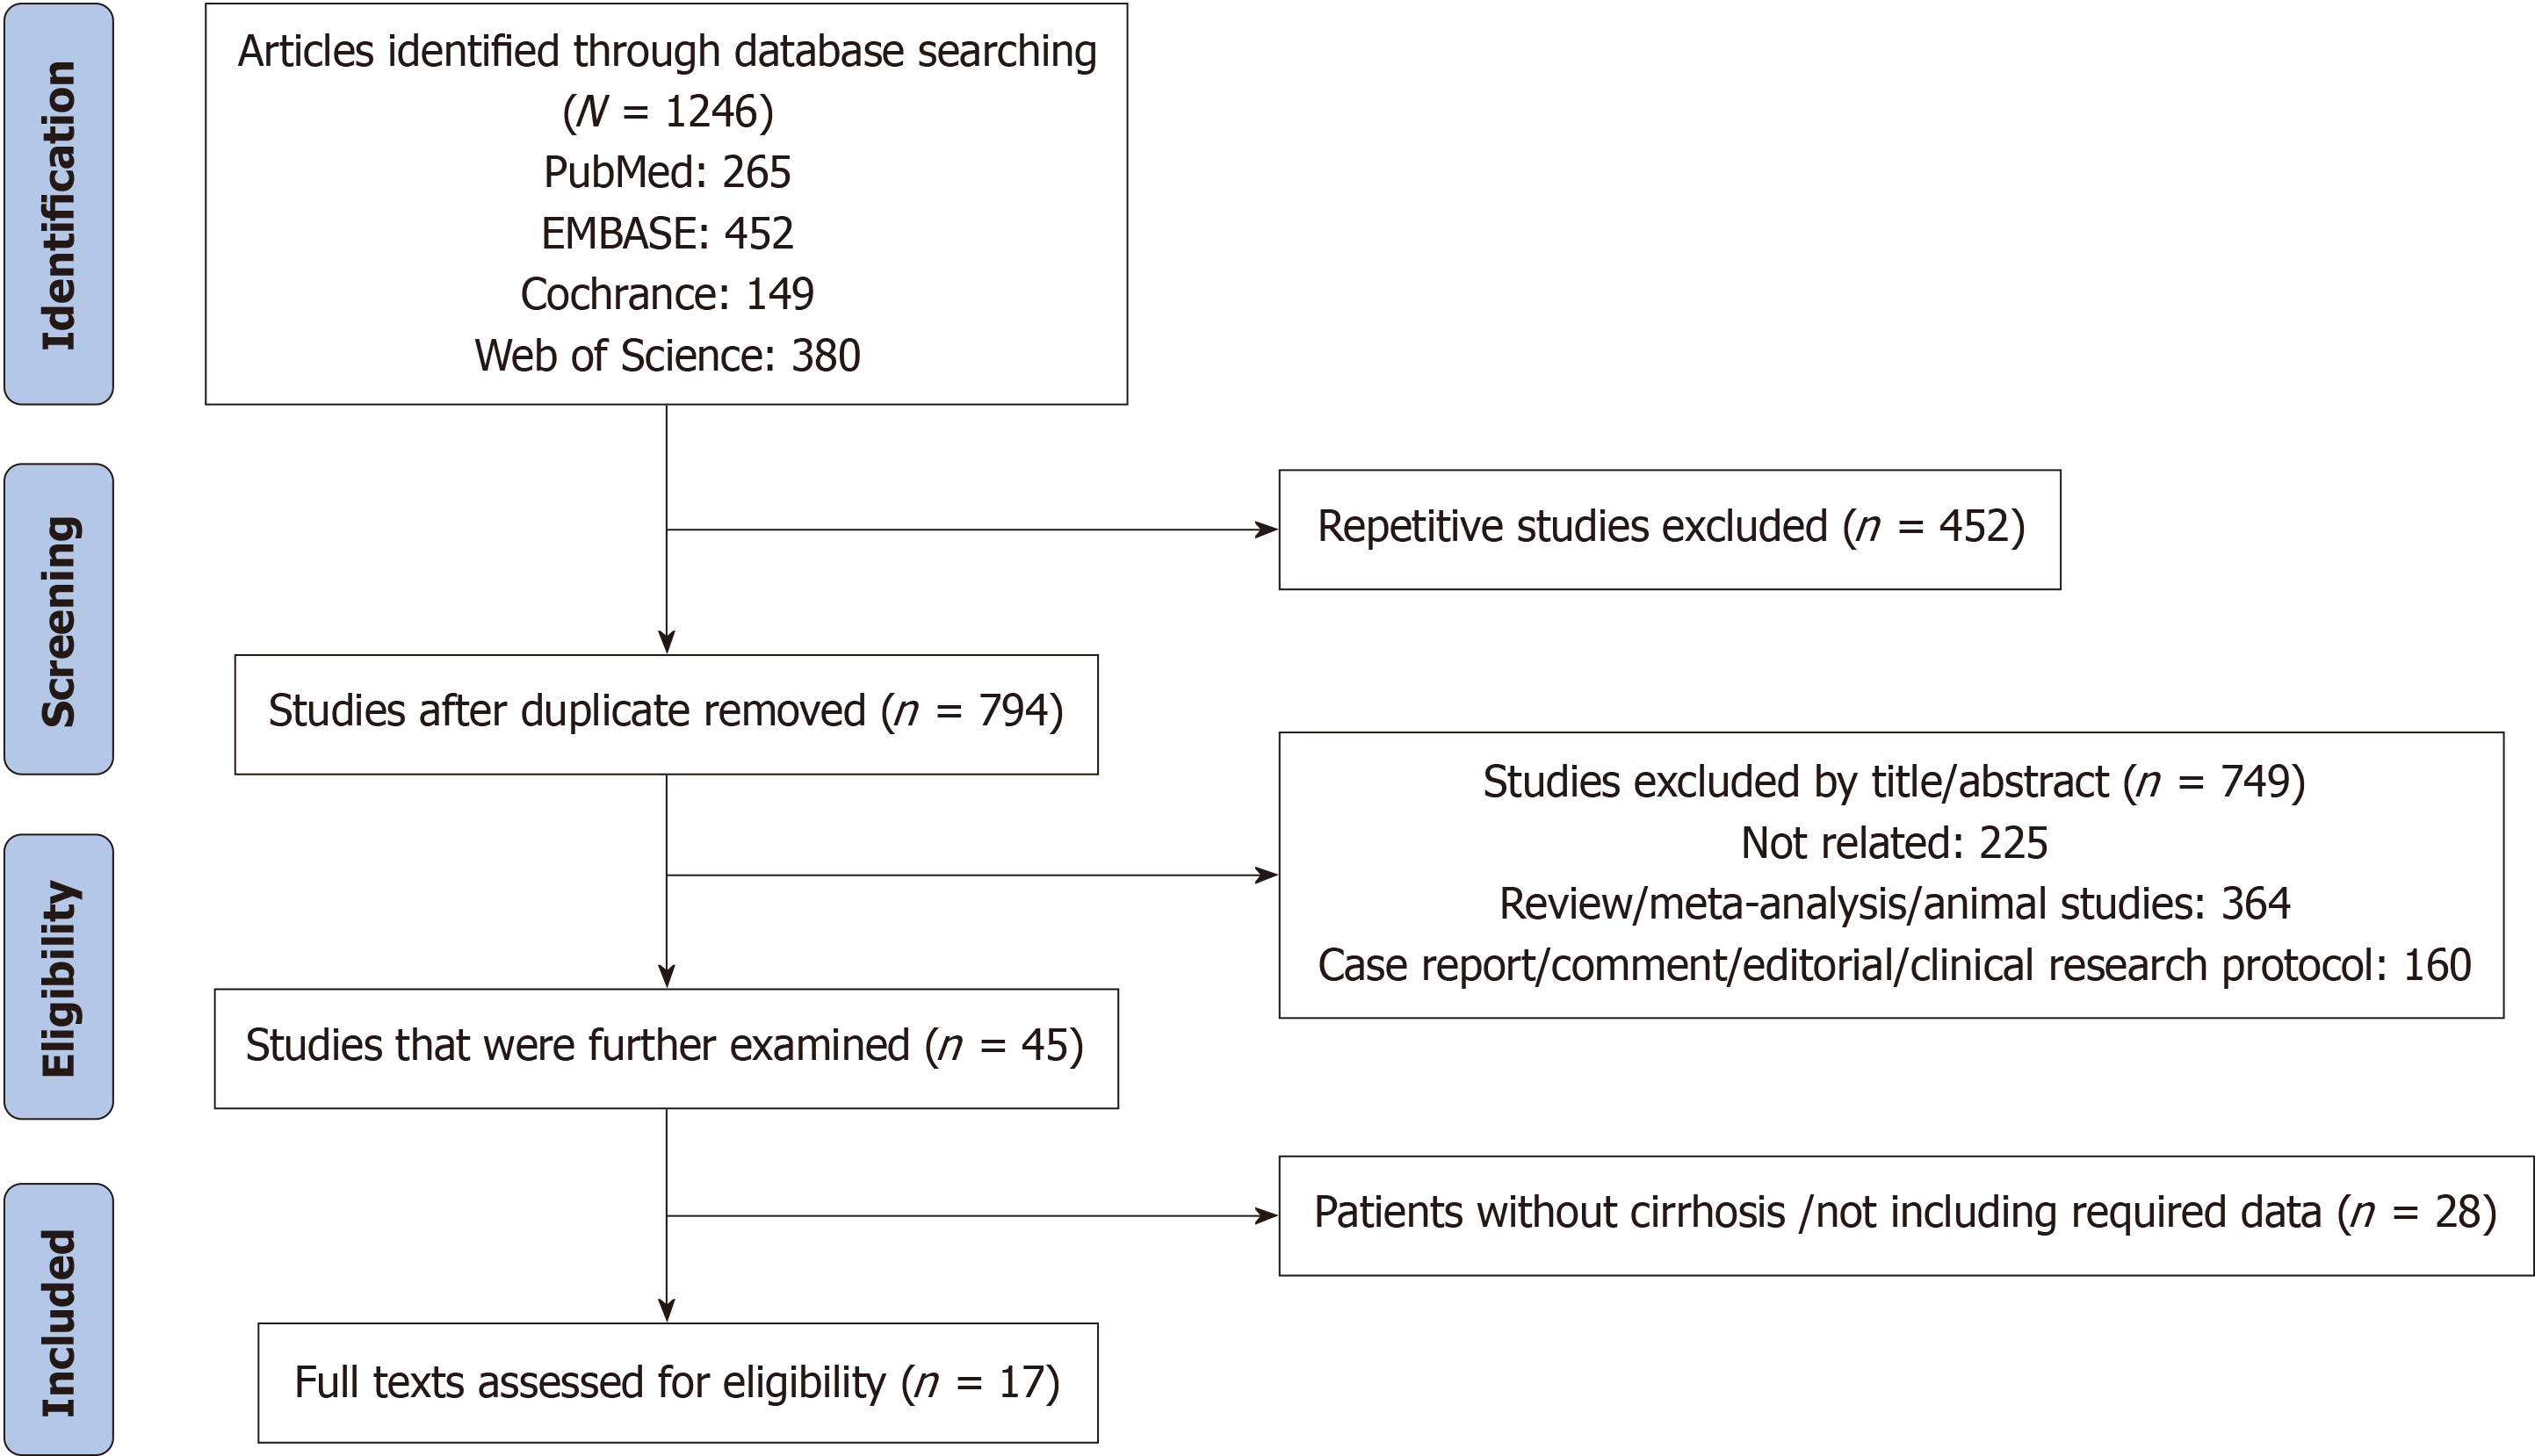
Figure 1 Flowchart of literature screening.
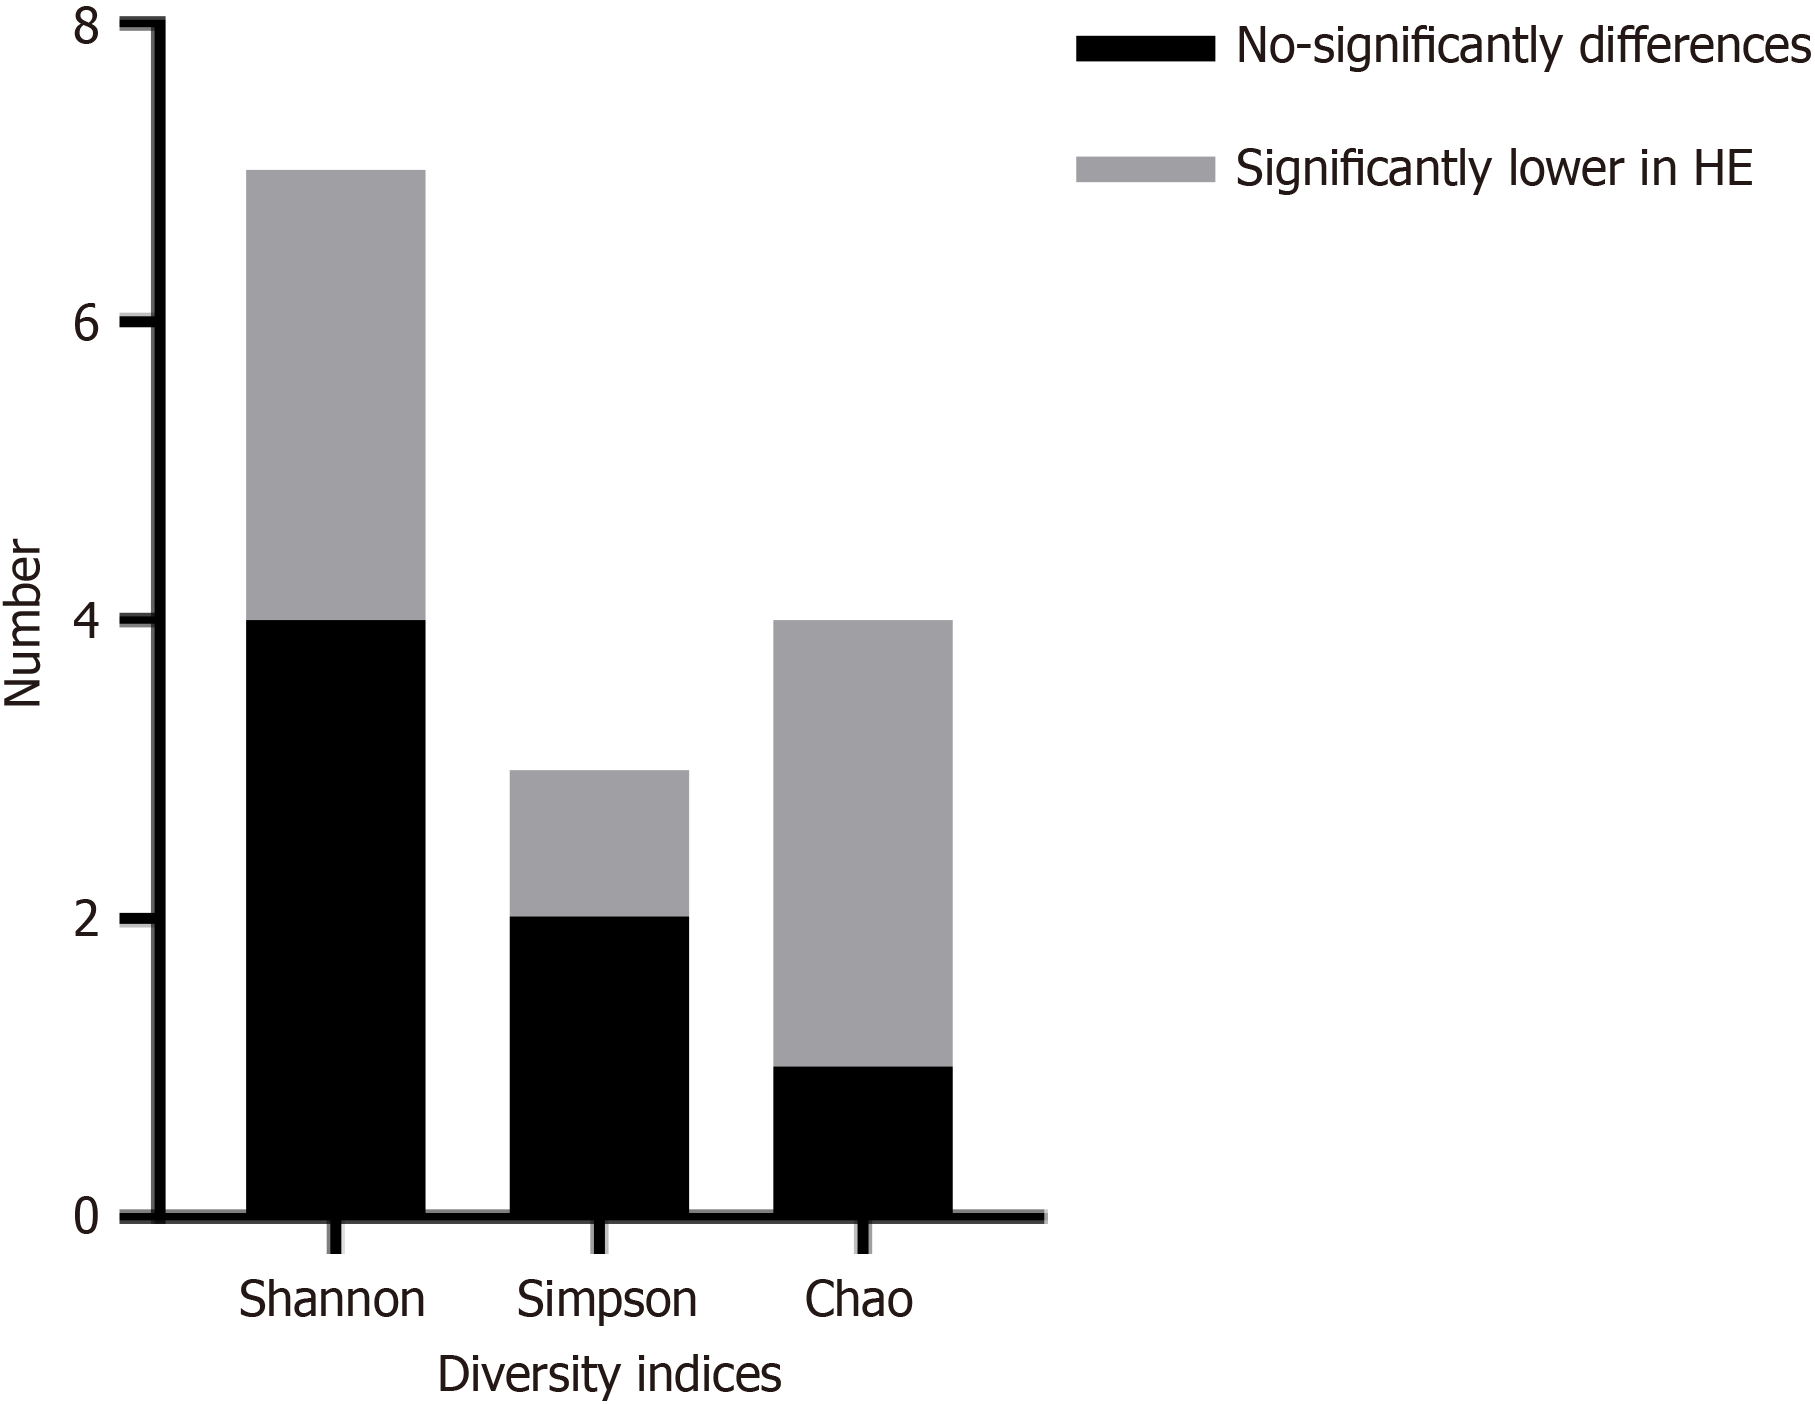
Figure 2 Comparison of alpha diversity indices between patients with hepatic encephalopathy and without hepatic encephalopathy in cirrhosis.
HE: Hepatic encephalopathy.
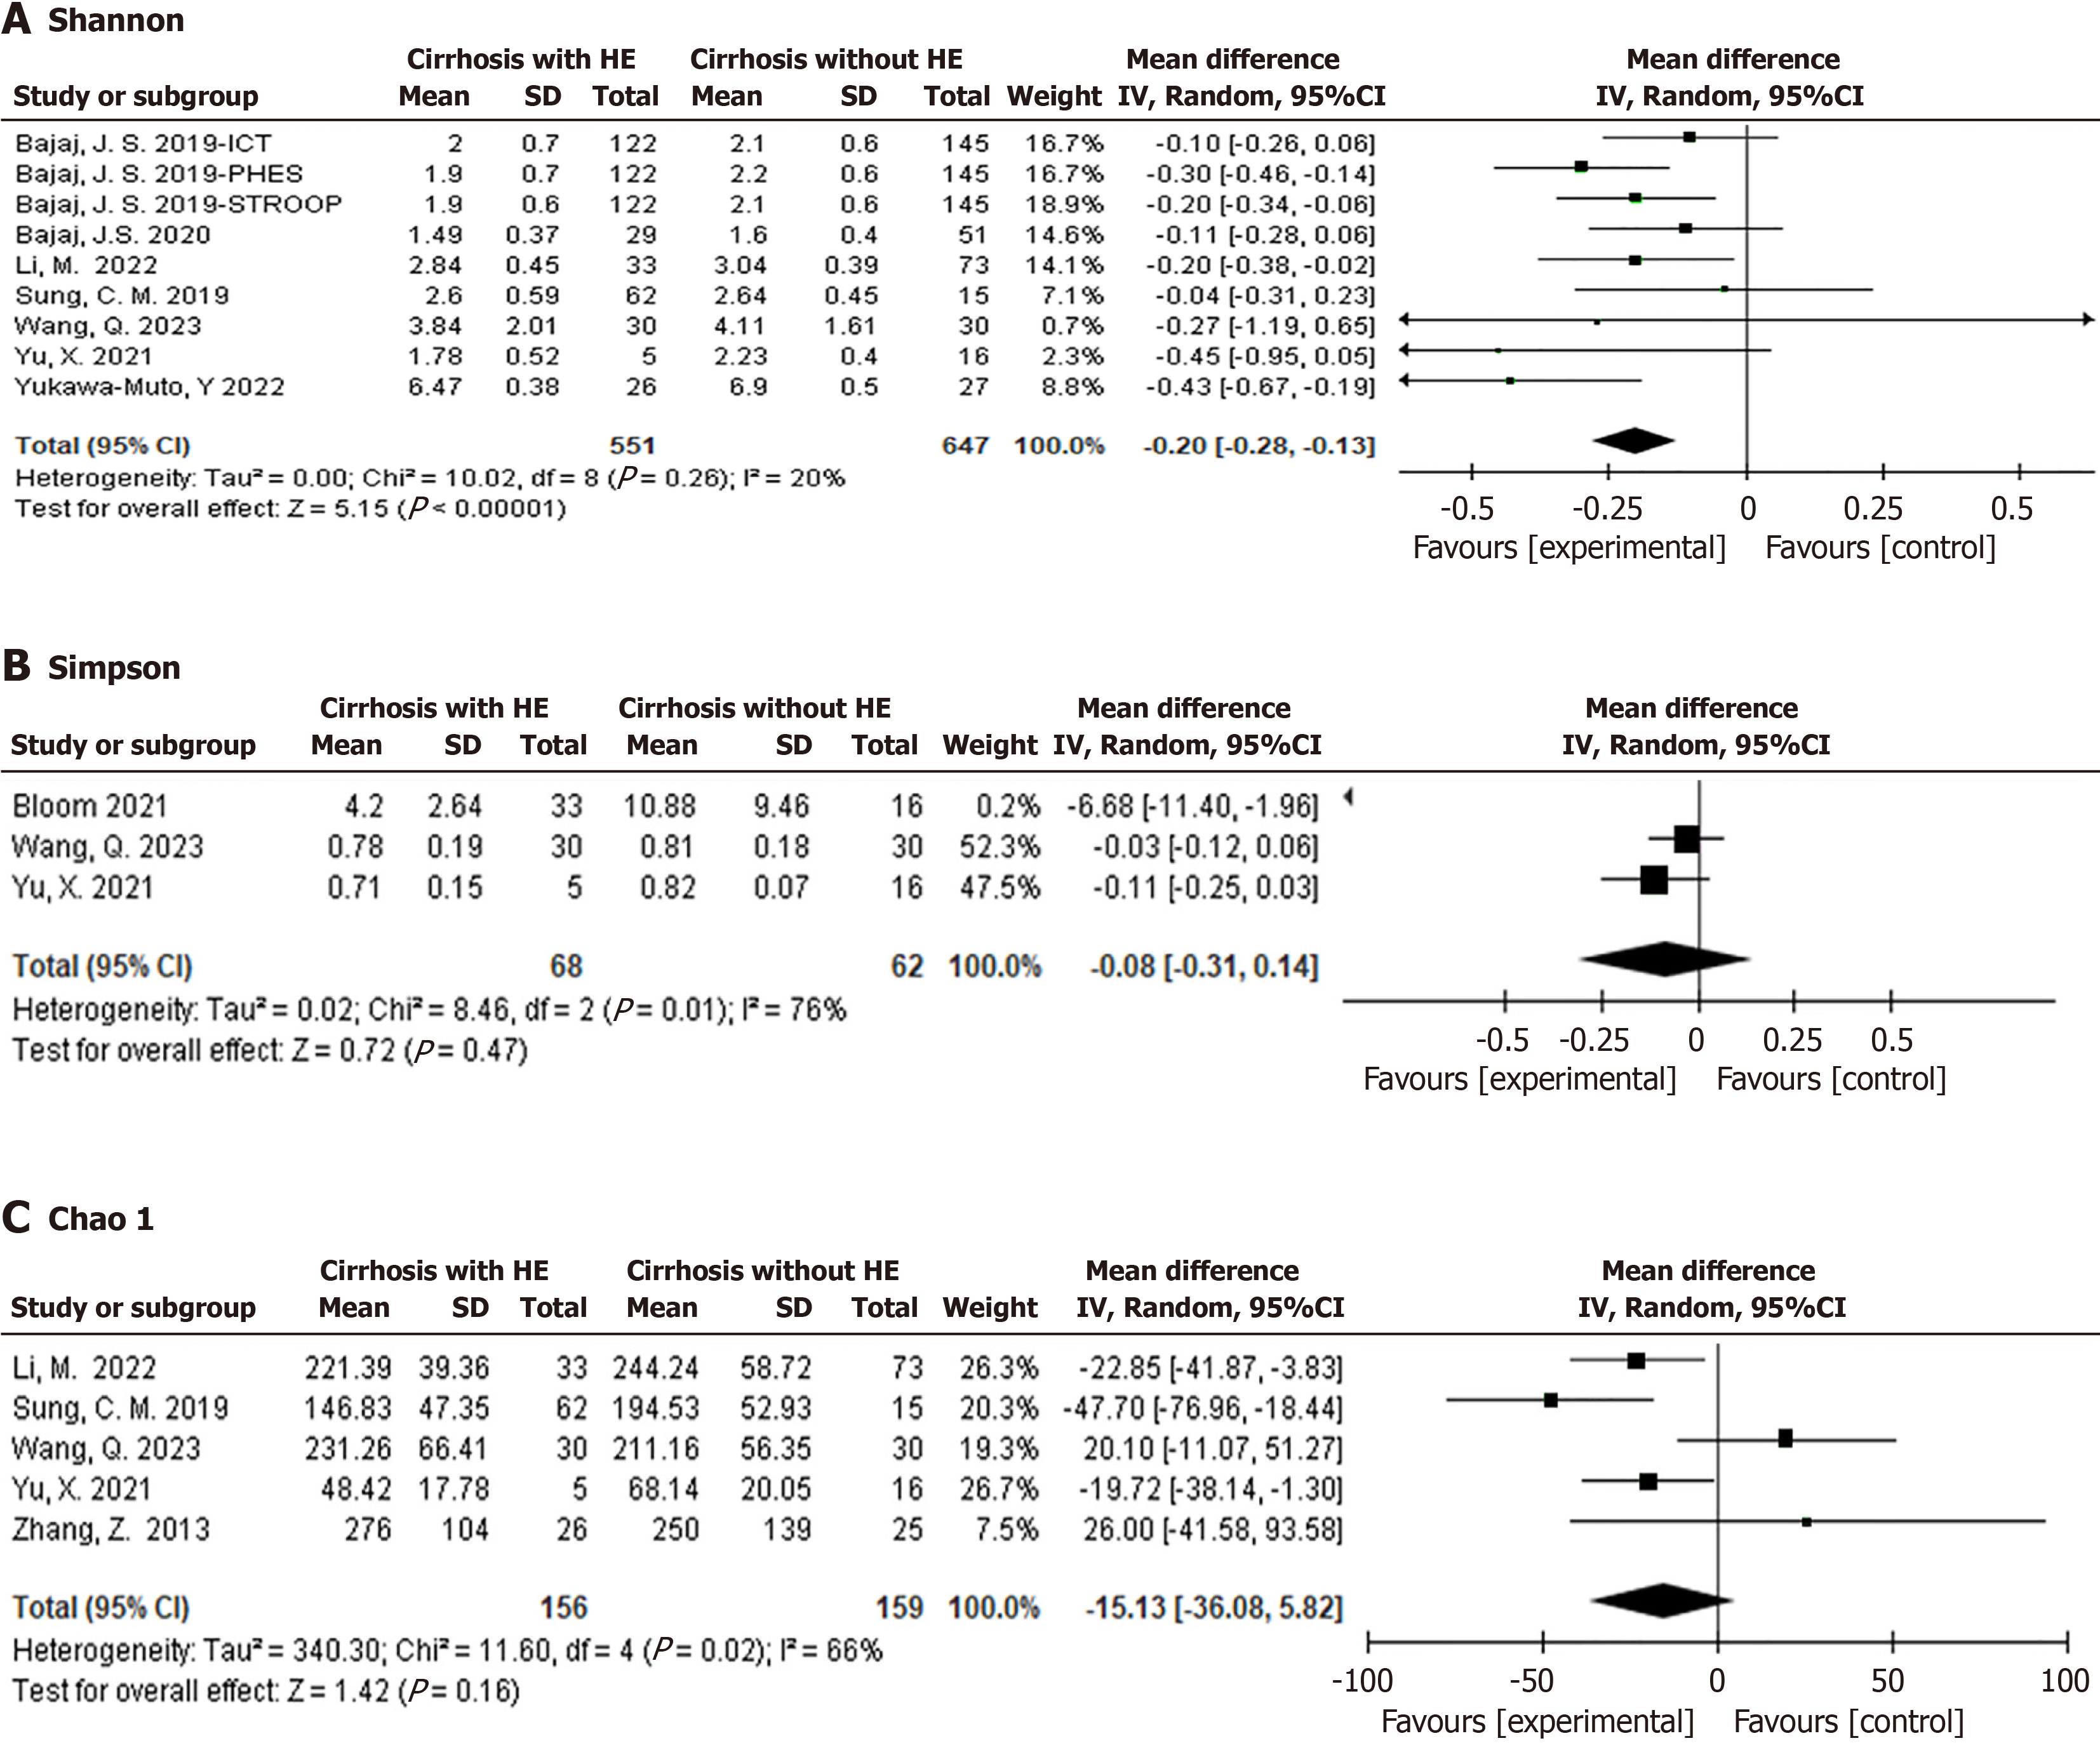
Figure 3 Alpha diversity indices of patients with liver cirrhosis with or without hepatic encephalopathy.
A: The Shannon index results; B: The Simpson index results; C: Chao 1 index results. HE: Hepatic encephalopathy; CI: Confidence interval.
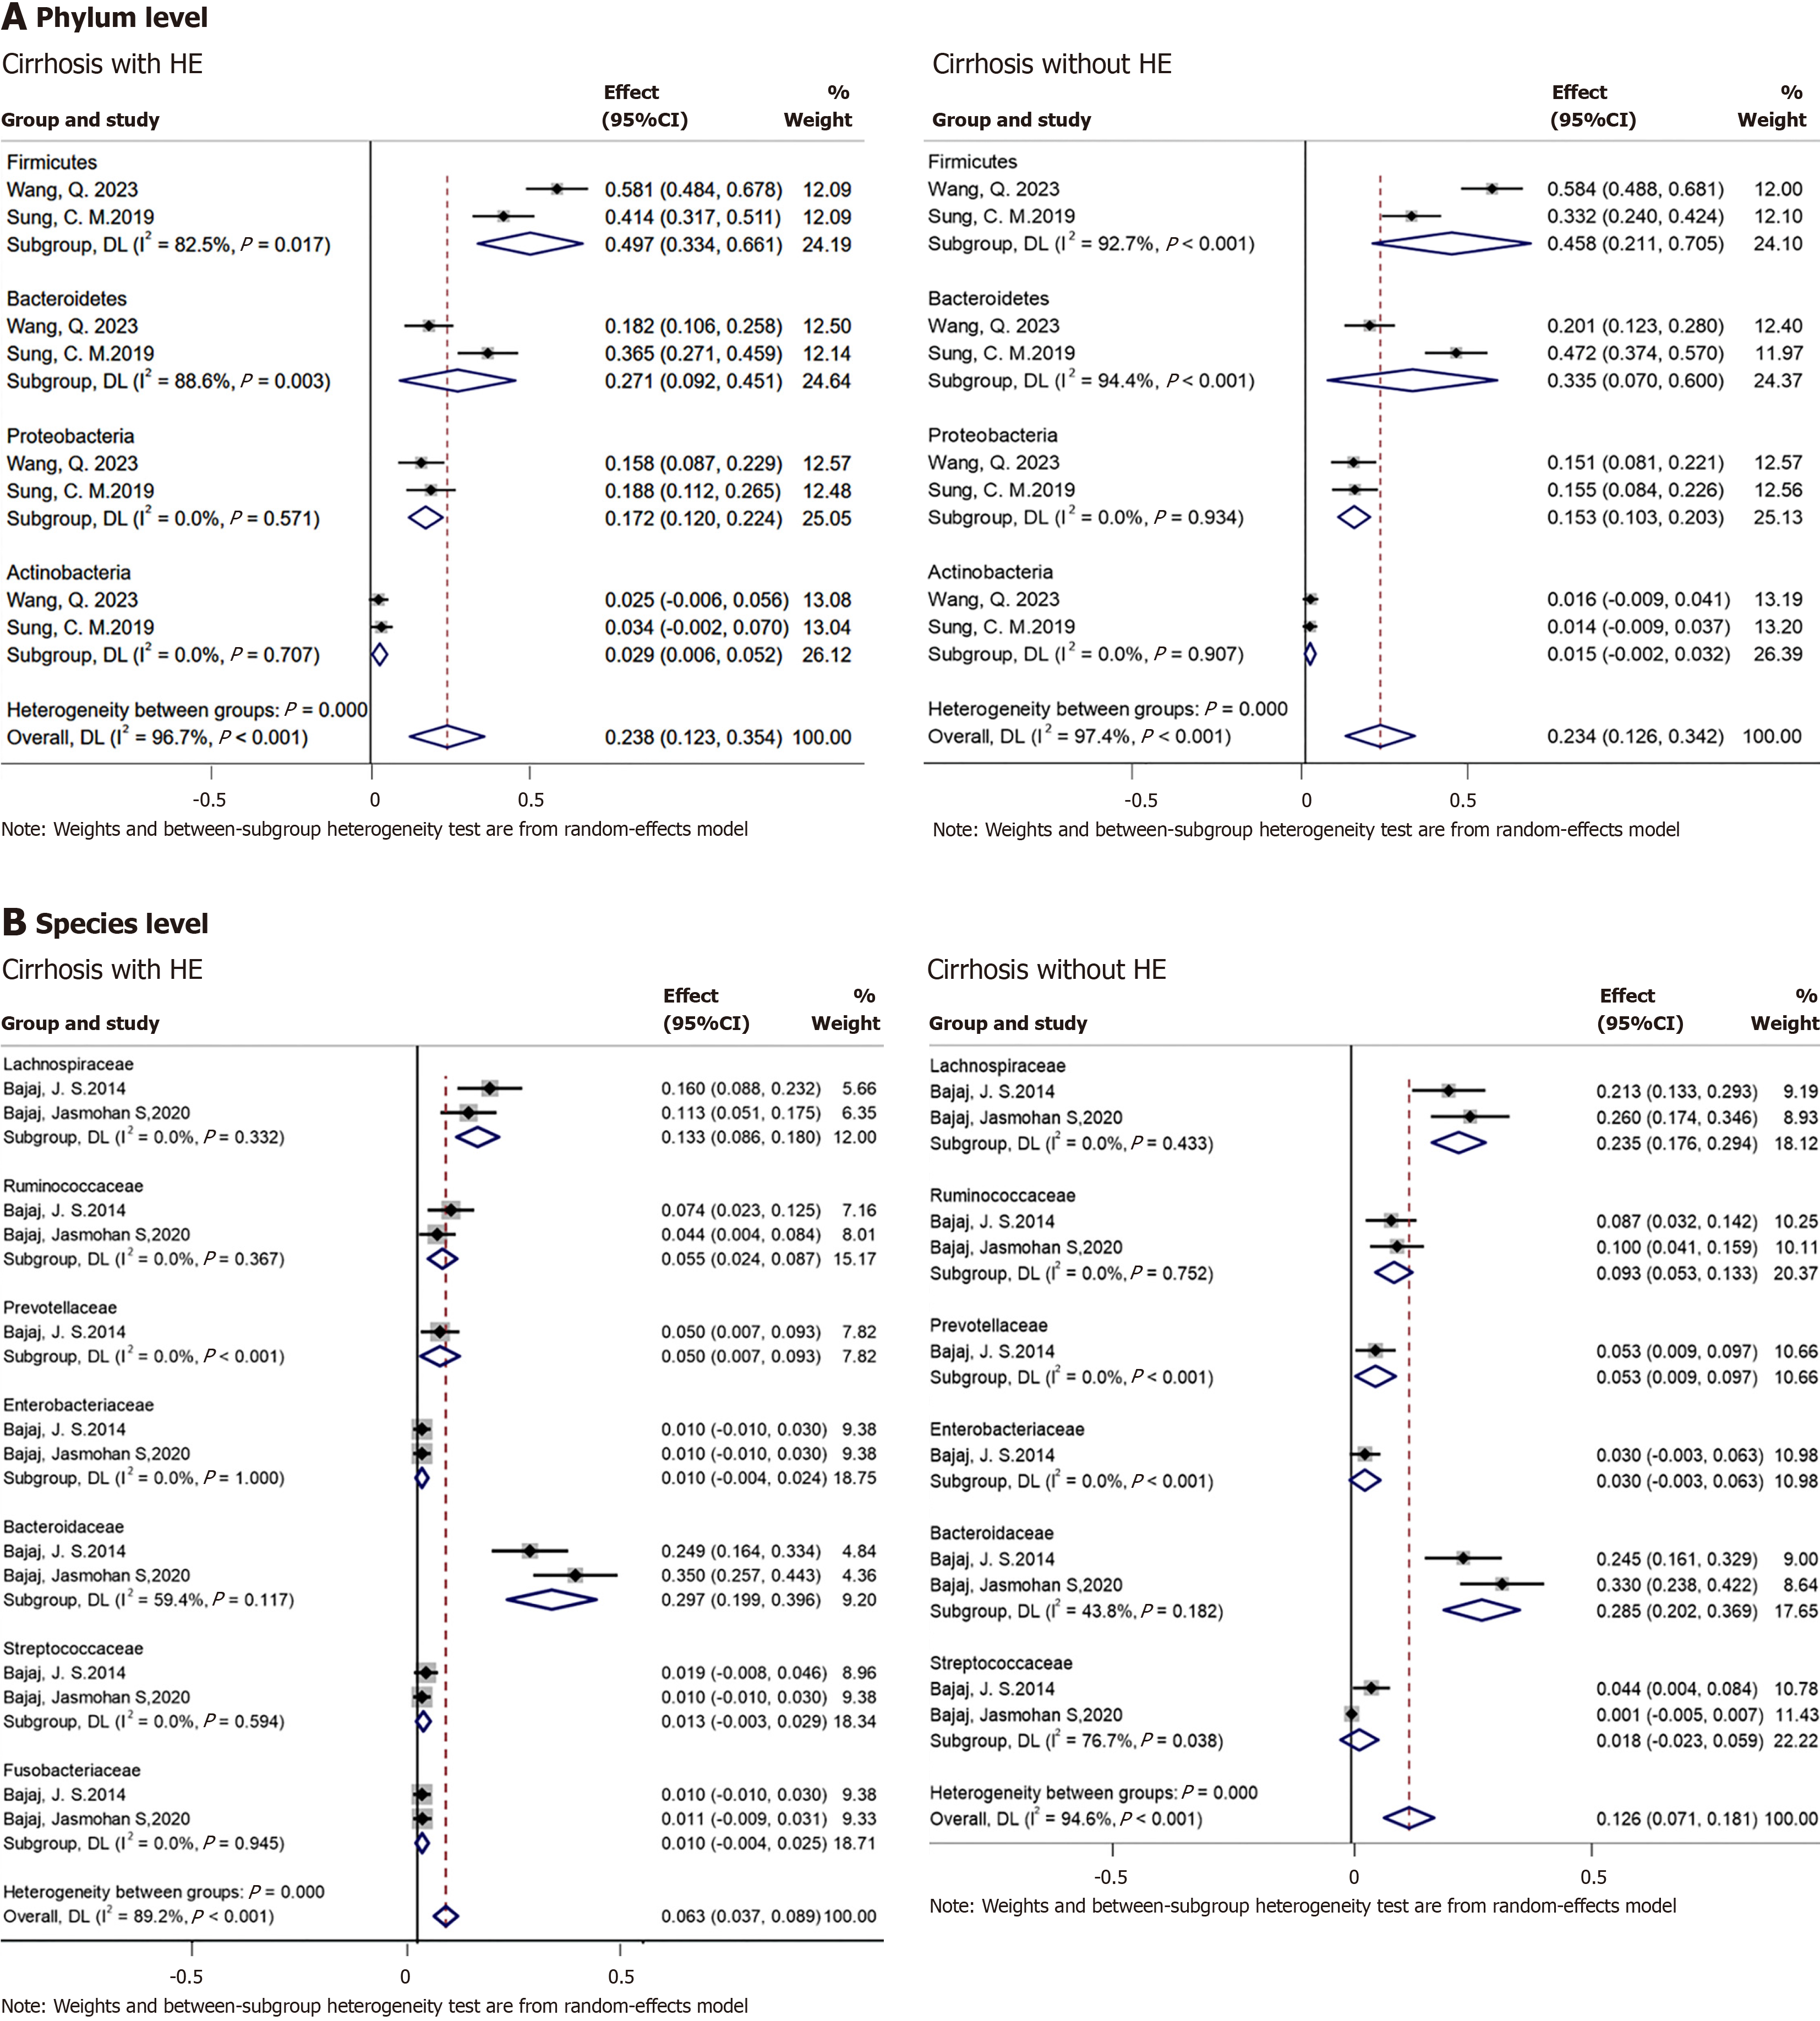
Figure 4 Comparison of the relative abundance of bacteria between cirrhosis patients with or without hepatic encephalopathy.
A: Comparison at the phylum level; B: Comparison at the species level. HE: Hepatic encephalopathy; CI: Confidence interval.
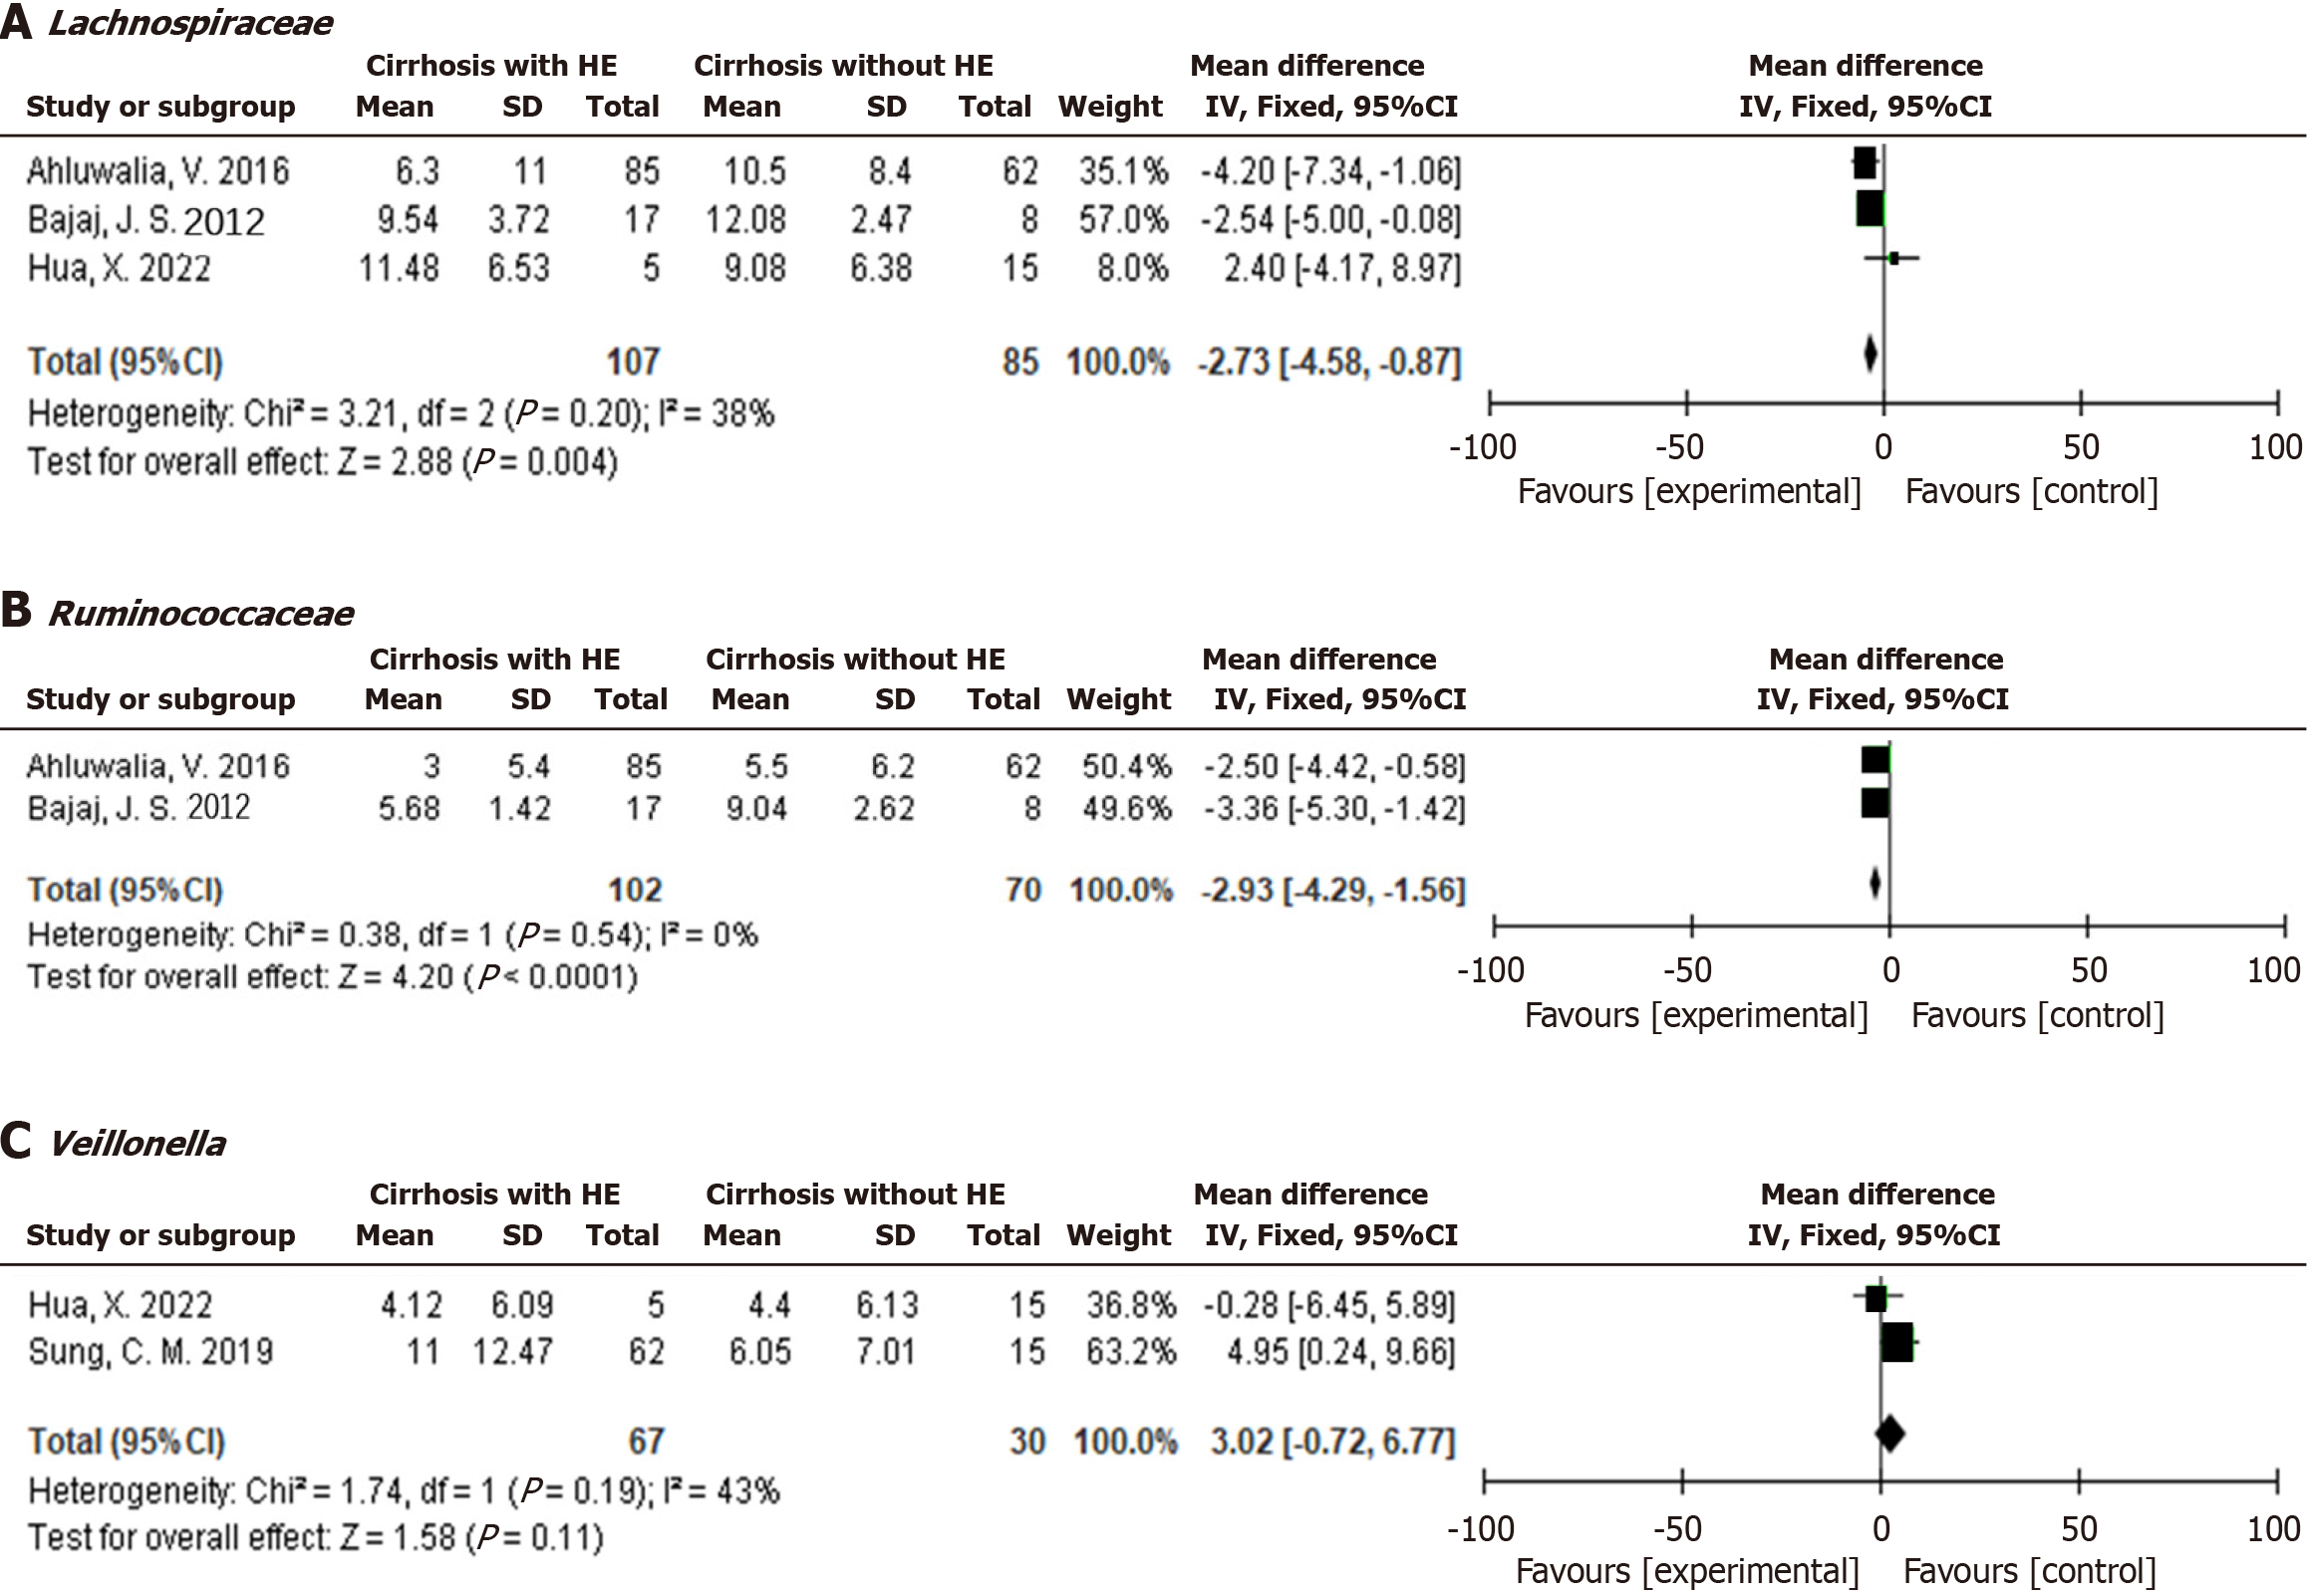
Figure 5 Comparison of the gut microbiota between patients with liver cirrhosis with or without hepatic encephalopathy.
A: Comparison of Lachnospiraceae; B: Comparison of Ruminococcaceae; C: Comparison of Veillonella. HE: Hepatic encephalopathy; CI: Confidence interval.
- Citation: Xu XT, Jiang MJ, Fu YL, Xie F, Li JJ, Meng QH. Gut microbiome composition in patients with liver cirrhosis with and without hepatic encephalopathy: A systematic review and meta-analysis. World J Hepatol 2025; 17(1): 100377
- URL: https://www.wjgnet.com/1948-5182/full/v17/i1/100377.htm
- DOI: https://dx.doi.org/10.4254/wjh.v17.i1.100377


