Copyright
©The Author(s) 2024.
World J Hepatol. Jun 27, 2024; 16(6): 932-950
Published online Jun 27, 2024. doi: 10.4254/wjh.v16.i6.932
Published online Jun 27, 2024. doi: 10.4254/wjh.v16.i6.932
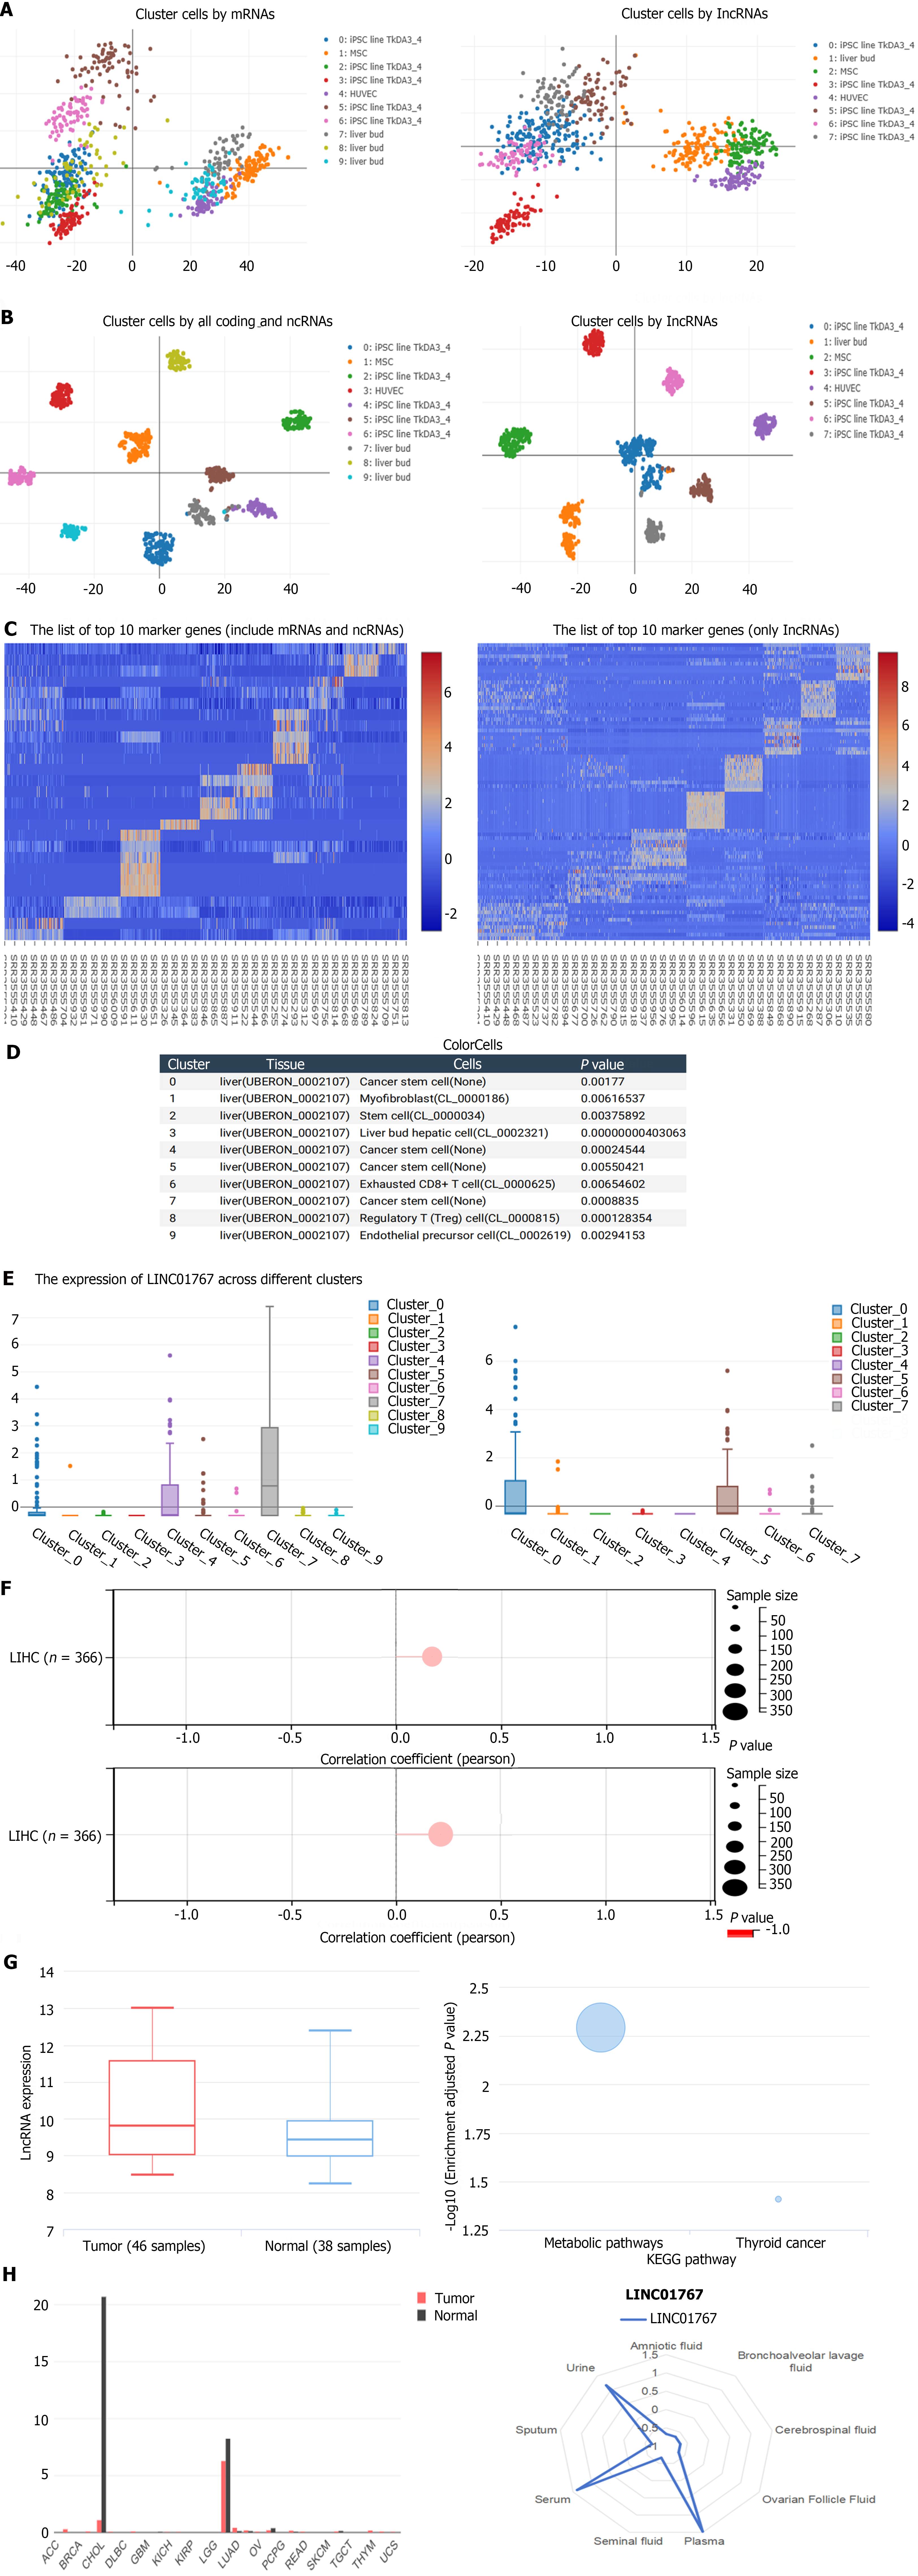
Figure 1 Single-cell sequencing analysis via the color cell web based on GSE81252 and validation.
A: The principal components analysis results showed that the 9-cluster cell by all coding and non-coding RNAs and 7-cluster cell by noncoding RNAs solely were identified; B: The t-SNE Nonlinear dimensionality reduction showed the corresponding dimensionality reduction; C: The differential genes among different cell-cluster; D: The 9-clusters cell subgroups; E: The expression of LINC01767 was upregulated in cluster 7 which was classified into cancer stem cell; F: DNAss (up) and RNAss (down) is associated in LIHC (n = 366, P < 0.001); G: GSE78160 (serum long noncoding RNAs) data showed that the serum LINC01767 was up regulated in hepatocellular carcinoma patients with a log fold change 0.699, P = 0.026524; LINC01767 is associated with the metabolic; H: LINC01767 was expressed in liver and bile duct with a significantly high level high level than other tissues LINC01767 demonstrate a high level in serum, urine, and plasma. ncRNA: Non-coding RNA; lncRNA: Long non-coding RNA.
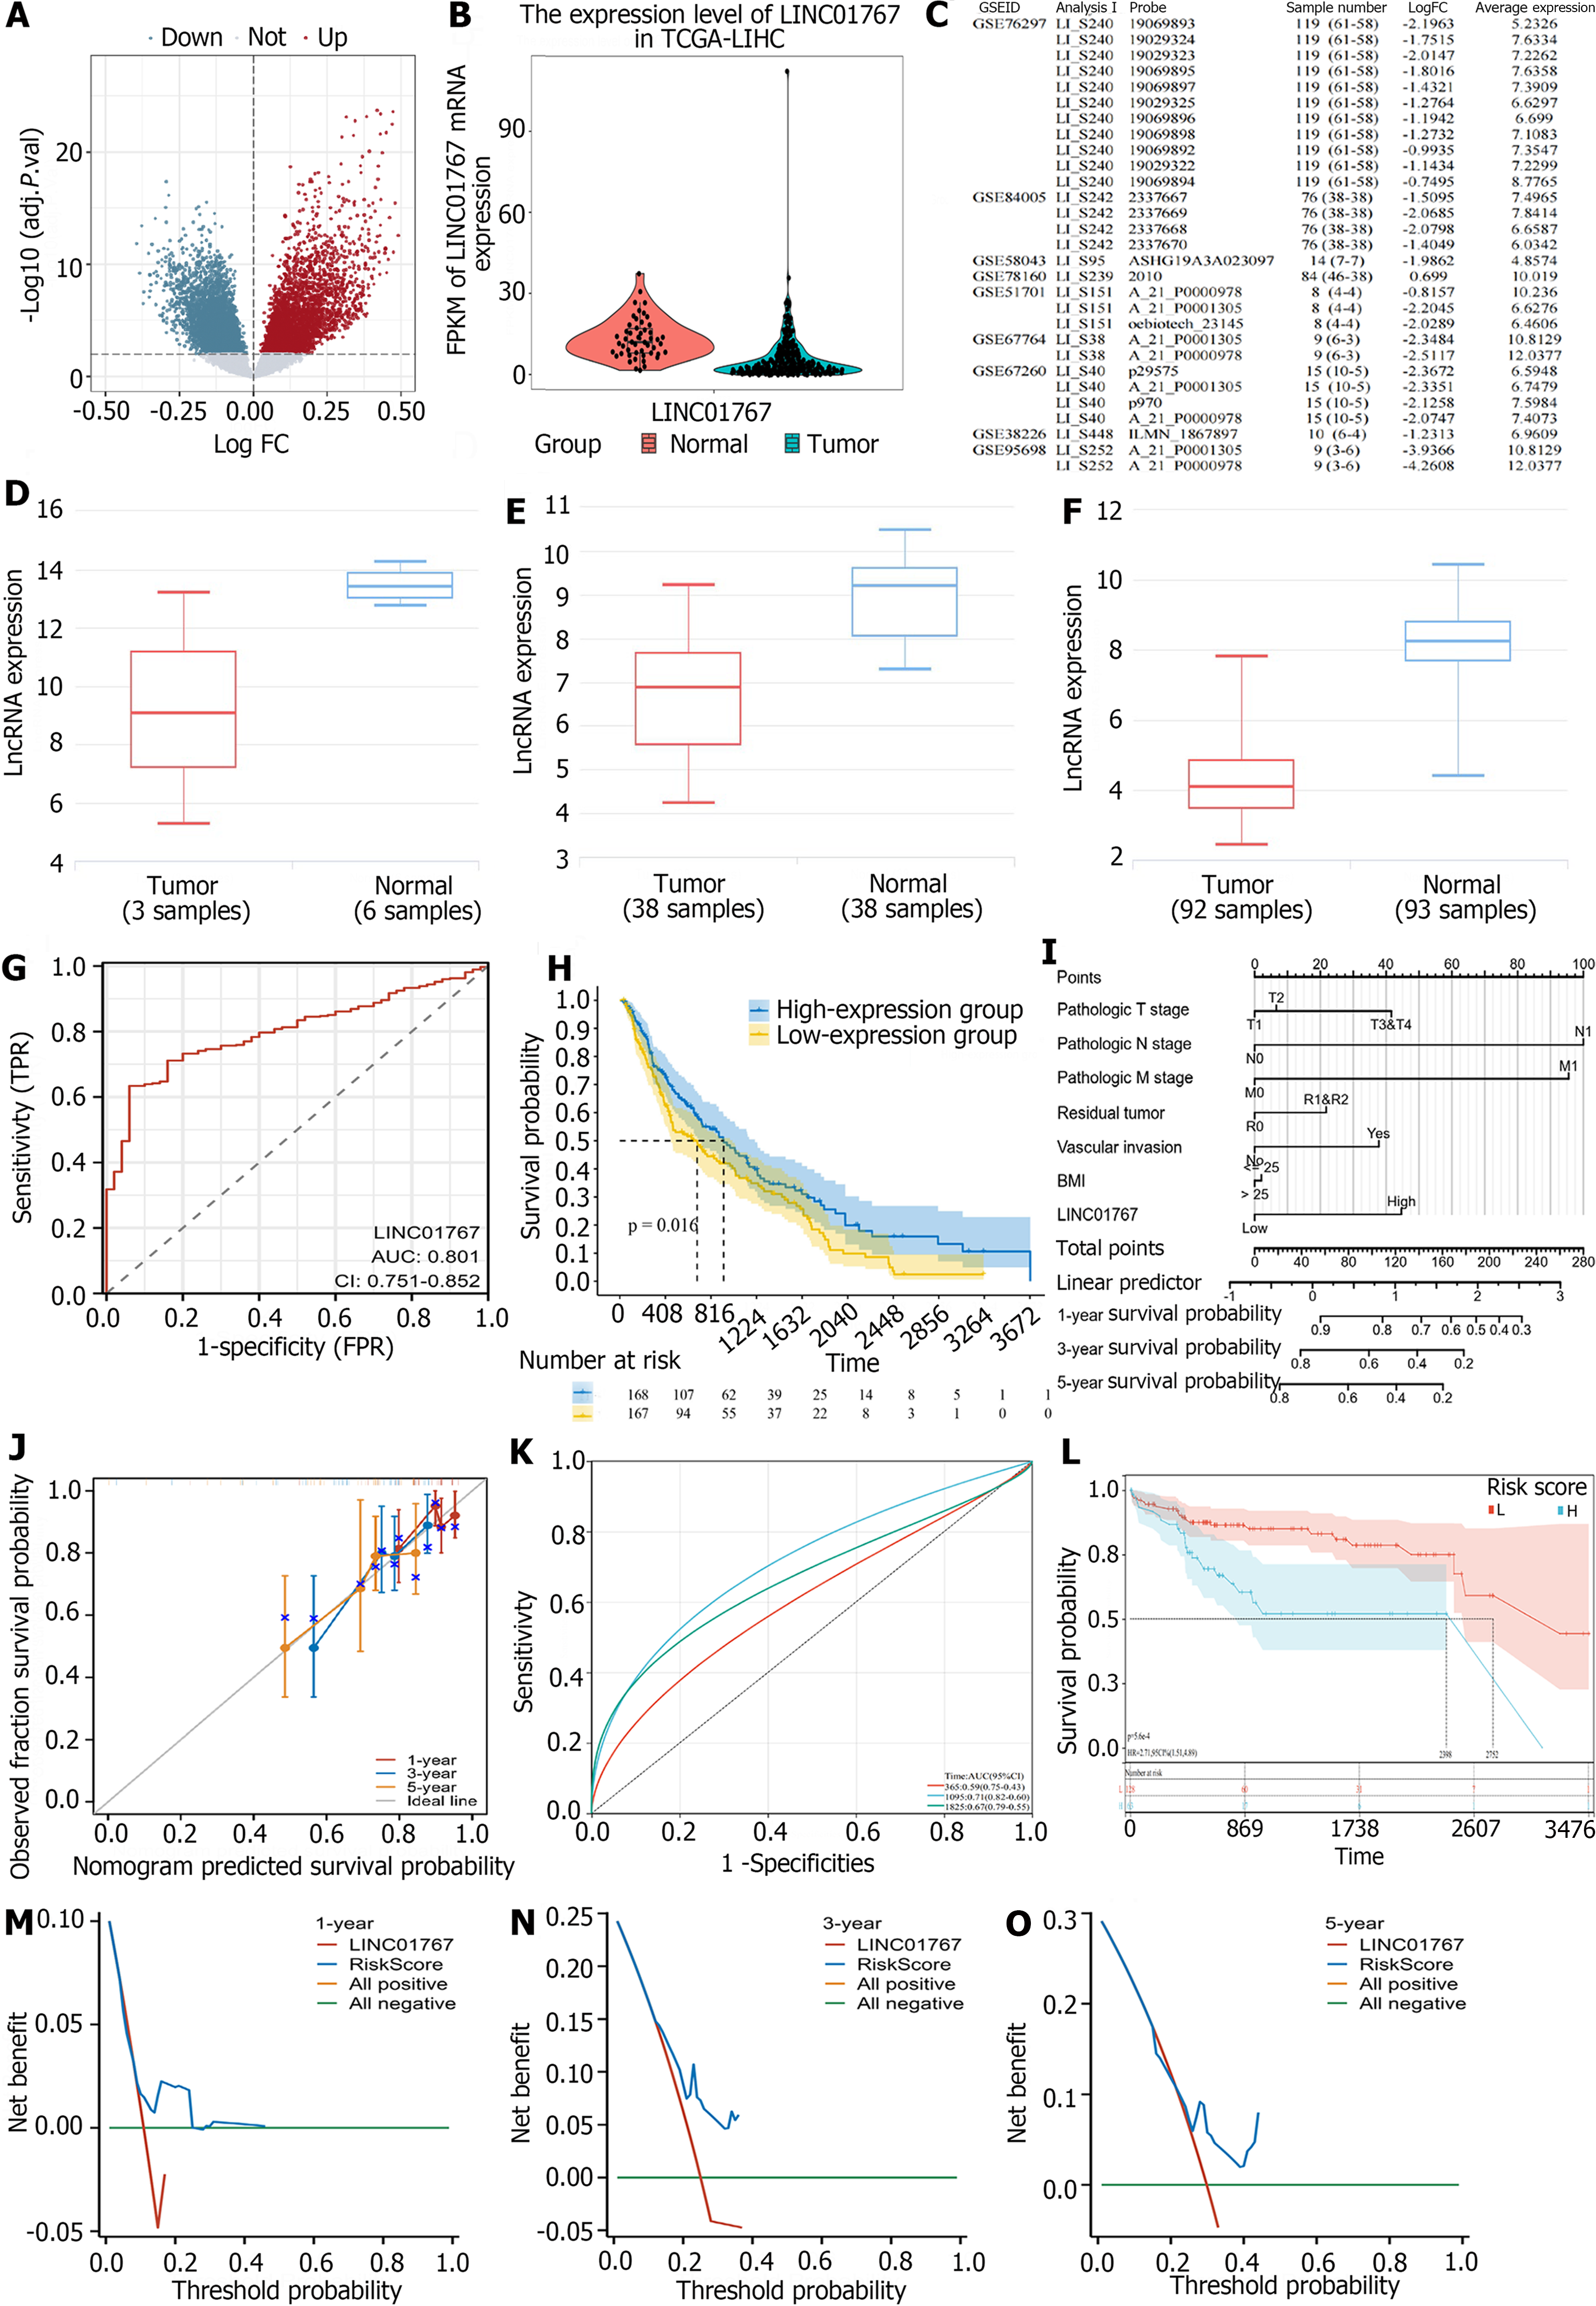
Figure 2 LINC01767 was downregulated and was potential diagnostic and prognostic marker in hepatocellular carcinoma.
A: A total of 3529 up regulated and 250 down regulated long noncoding RNAs were identified; B: The LINC01767 caught our attention with a log fold change -1.575 and P < 0.0001; C: Deferential expression of LINC01767 in Gene Expression Omnibus dataset; D: LINC01767 downregulated in GSE78160; E: LINC01767 downregulated GSE58043; F: LINC01767 downregulated GSE84005; G: Receiver-operating characteristic (ROC) curves of LINC01767 in The Cancer Genome Atlas (TCGA); H: The LINC01767 expression level stand as a predictor for overall survival (OS) (P = 0.016); I: The nomogram model including T/N/Residual tumor, vascular invasion, body mass index and LINC01767; J: The calibration curve showed that there was good concordance between the predicted and observed values of 1-year and 3-year OS; K: Area under the curve (AUC) of 3-year accuracy was 0.71 [95% confidence interval (CI): 0.82-0.60], the AUC of 5-year accuracy was 0.67 (95%CI: 0.79-0.55) with a good prediction performance; L: Showed the high-risk score group of TCGA having a worse prognosis with median survival time 2398 d comparing 2752 d in low risk group with hazard ratio = 2.71 (95%CI: 1.51-4.89, P = 5.6e-4); M-O: The nomogram model showed a better DCA performance than sole LINC01767 with greater than line 0. TCGA: The Cancer Genome Atlas; FC: Fold change; lncRNA: Long non-coding RNA.
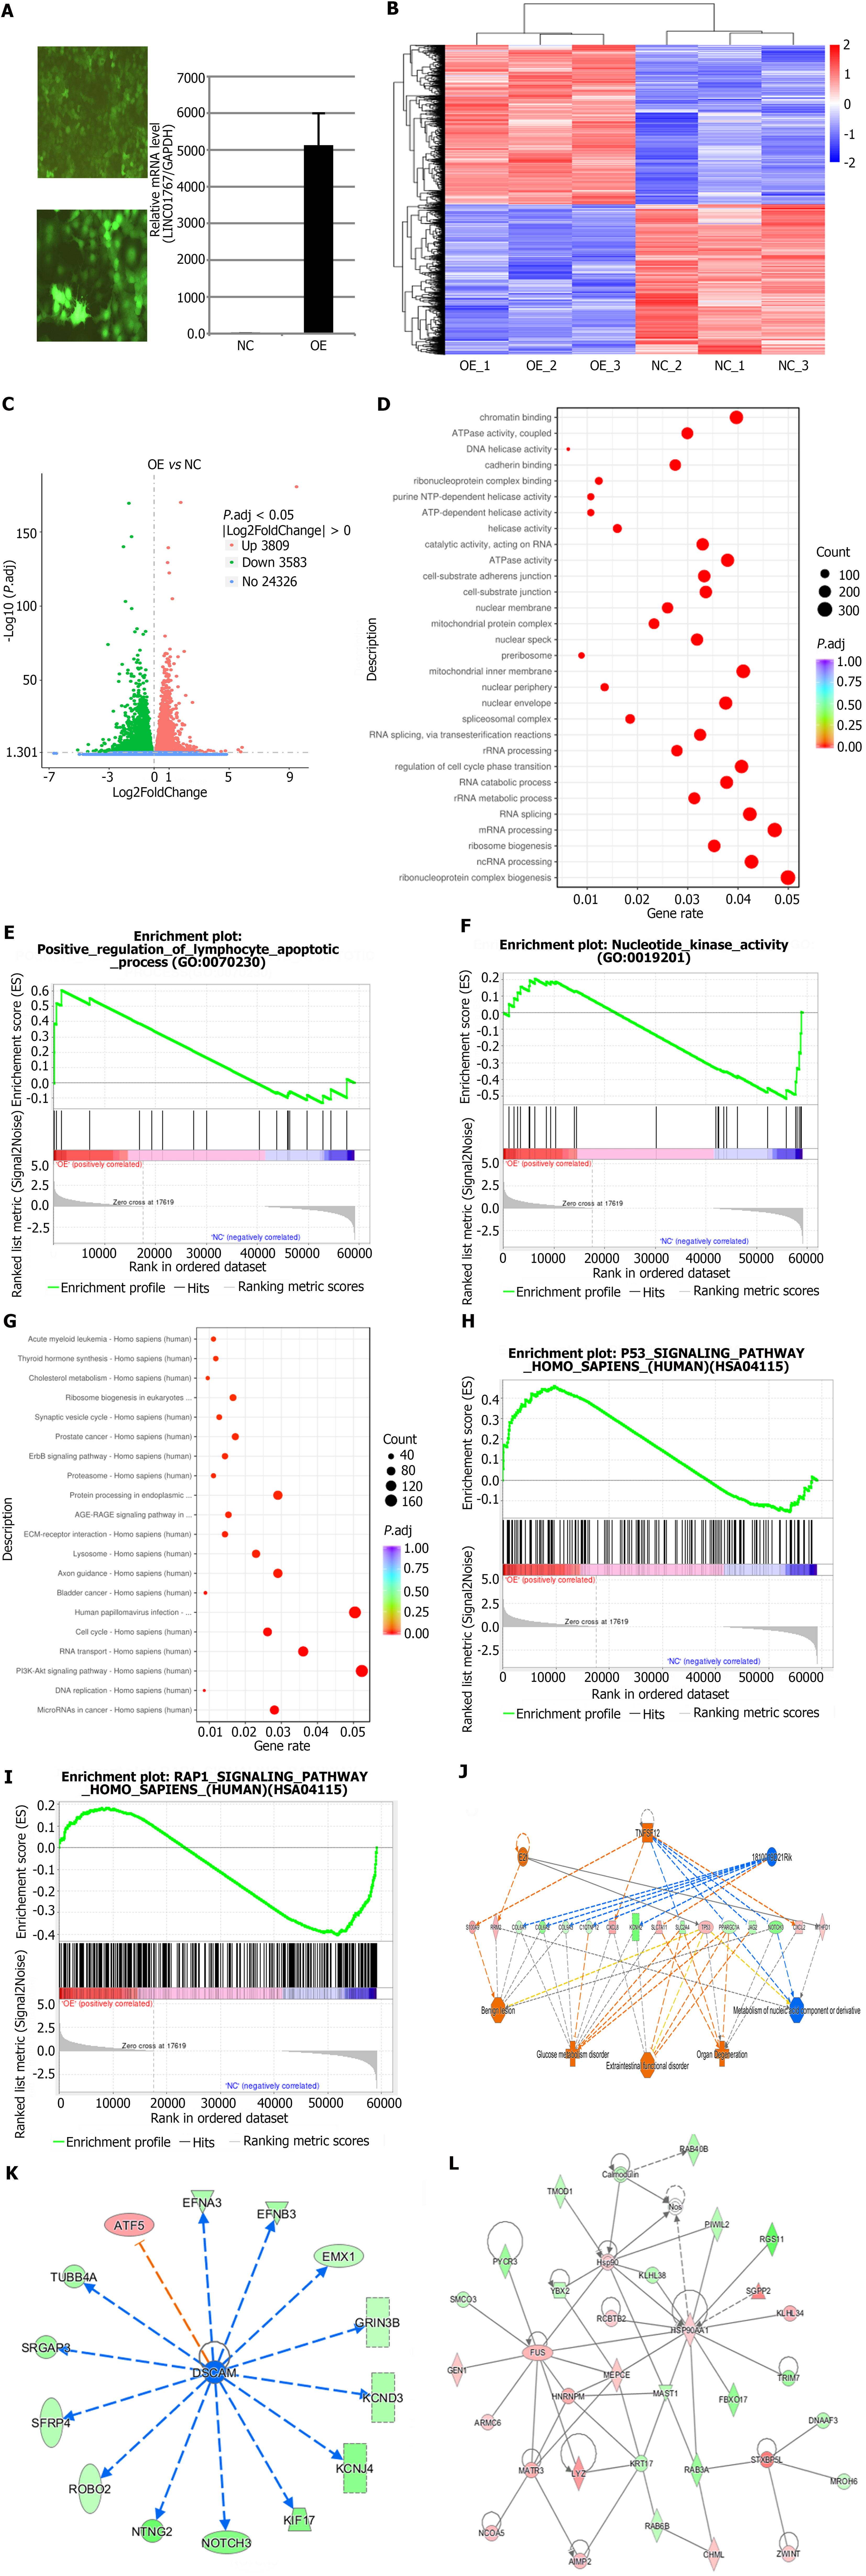
Figure 3 RNA-sequencing and bioinformatic analysis in Huh7 with LINC01767 over expression.
A: Over expression of LINC01767 in Huh7 cells; B: The differential expression heatmap is presented in using the log fold change (FC) > 1.5, and P < 0.05; C: The differential expression volcano plot is presented in using the logFC > 1.5, and P < 0.05; D: The top 10 most significantly enriched Gene Ontology terms; E and F: Gene Set Enrichment Analysis (GSEA) analysis showed that go term of LINC01767 involved in positive regulation of lymphocyte apoptosis, nucleotide kinase activity and so on; G: The top 10 most significantly enriched Kyoto Encyclopedia of Genes and Genomes (KEGG) terms; H and I: GSEA analysis showed KEGG pathway showed LINC01767 was involved in P53 signaling, RAP1 signaling and other important pathways; J: The top-ranked regulatory network in this regulatory effect analysis shows that the regulation net involved in regulators 1810019D21Rik, E2f, TNFSF12 through C1QTNF12, COL6A1, COL6A2, COL9A3, CXCL2, CXCL8, JAG2, KCNH2, MTHFD1, NOTCH3, PPARGC1A, RRM2, S100A9, SLC2A4, SLC7A11, TP53; K: The updream regulatory network analysis shows the DSCAM and ATF5 and so on involved in the regulatory net; L: Molecular network showed it can interact with HSP90, LYZ, FUS, and so on.
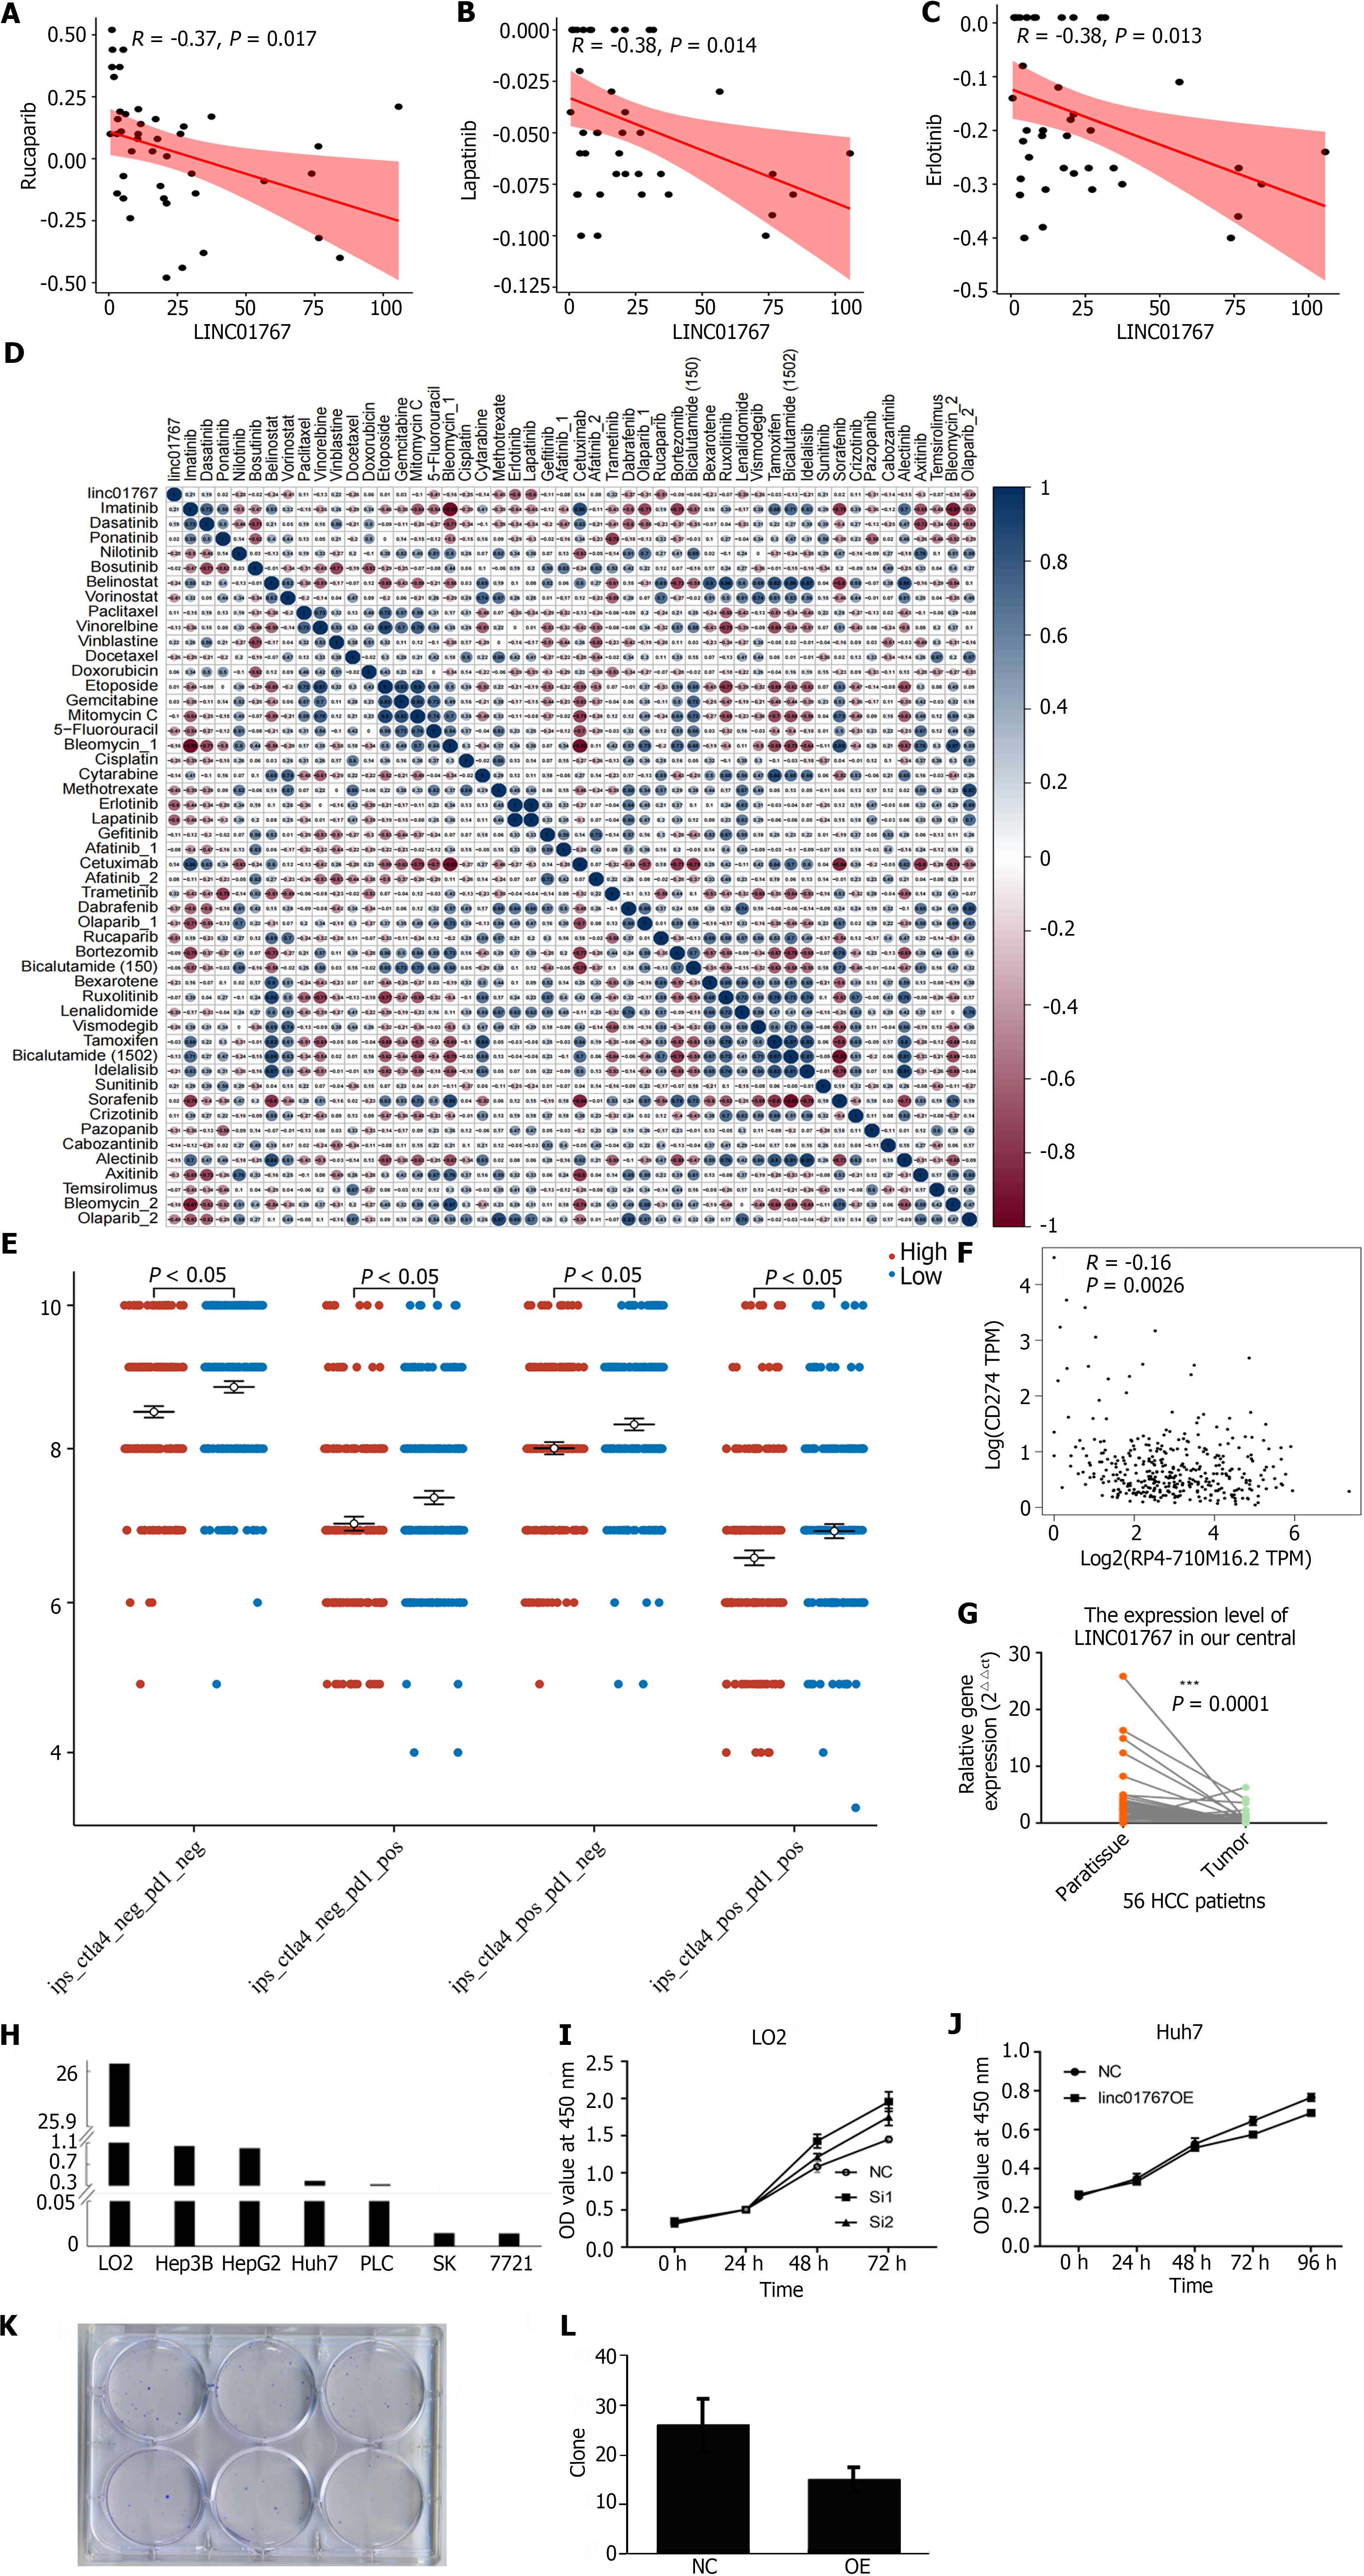
Figure 4 The role of LINC01767 of predicting drug sensitivity in hepatocellular carcinoma and the invitro experiment to valid the role of LINC01767 in Huh7.
A: The re-analysis results of the previous research showed LINC01767 was negatively with the sensitivity of rucapanib (R = -0.37, P = 0.017); B: Lapatinib (R = -0.38, P = 0.014); C: Erlotinib (R = -0.38, P = 0.013); D: Sperman correlation analysis was used to evaluate the mRNA level of LINC01767 and IC50 of the potential drugs; E: The immunophenoscore (IPS), IPS-programmed cell death protein 1 (PD1)/programmed cell death ligand 1 (PDL1)/PD-L2 and IPS-CTLA4 were significantly lower higher in different between LINC01767 high group than in low groups (all P < 0.05); F: The spearman correlation analysis showed LINC01767 was negatively correlated with PDL1, P = 0.0026; G: The quantitative real time polymerase chain reaction of tumor tissue and para-tumor tissue from hepatocellular carcinoma (HCC) patients in our cohort showed that the LINC01767 was down regulated obviously in tumor; H: The cell lines of HCC and normal cell LO2 showed that the LINC01767 was down regulated in cancer cell line comparing with LO2; I: The down regulation of LINC01767 in LO2 cell showed the growth of the LO2 was impeded; J: MTT method and formation of clones was conducted to observe cell proliferation showing the overexpression of LINC01767 inhibit the cell proliferation; K and L: LINC01767 over expression impede the clone formation of Huh7. HCC: Hepatocellular carcinoma; NC: Normal control; OE: Over expression.
- Citation: Zhang L, Cui TX, Li XZ, Liu C, Wang WQ. Diagnostic and prognostic role of LINC01767 in hepatocellular carcinoma. World J Hepatol 2024; 16(6): 932-950
- URL: https://www.wjgnet.com/1948-5182/full/v16/i6/932.htm
- DOI: https://dx.doi.org/10.4254/wjh.v16.i6.932


