Copyright
©The Author(s) 2024.
World J Hepatol. Nov 27, 2024; 16(11): 1290-1305
Published online Nov 27, 2024. doi: 10.4254/wjh.v16.i11.1290
Published online Nov 27, 2024. doi: 10.4254/wjh.v16.i11.1290
Figure 1 Expression of integrin αvβ3 in cultured hepatocytes.
Human LO2 hepatocytes were cultured with the medium containing 100 μmol/L palmitate acid and 200 μmol/L oleic acid (FFA) for 24 hours, and the cells cultured in the medium without FFA served as the control. A: Representative micrographs of the control and FFA-cultured hepatocytes after stained with Oil-Red O. Images were taken at original magnification (200 ×), scale bars = 20 μm; B and C: Representative fluorescent images of the control (B) and FFA-cultured (C) hepatocytes after separately stained with integrin αv and β3 subunits antibody (green color) and counterstained with albumin antibody (red color). 6-diamidino-2-phenylindole was used for nuclei staining. The merged images show the yellow color area by overlaying images of the counterstaining. Images were taken at original magnification (400 ×), scale bars = 100 μm; D: Comparison of the message RNA levels of integrin αv and β3 subunits in the control and FFA-cultured hepatocytes. The message RNA levels of integrin αv and β3 subunit were determined by quantitative real-time polymerase chain reaction analysis; E and F: Comparison of the protein amounts of integrin αv and β3 subunits in the control and FFA-cultured hepatocytes. The protein amounts of integrin αv and β3 subunits were analyzed by western-blot assay, and β-Tublin was used as the reference. All experiments were undertaken in triplicates. In all panels, data are expressed in means ± SD. FFA: Oleic acid; DAPI: 6-diamidino-2-phenylindole.
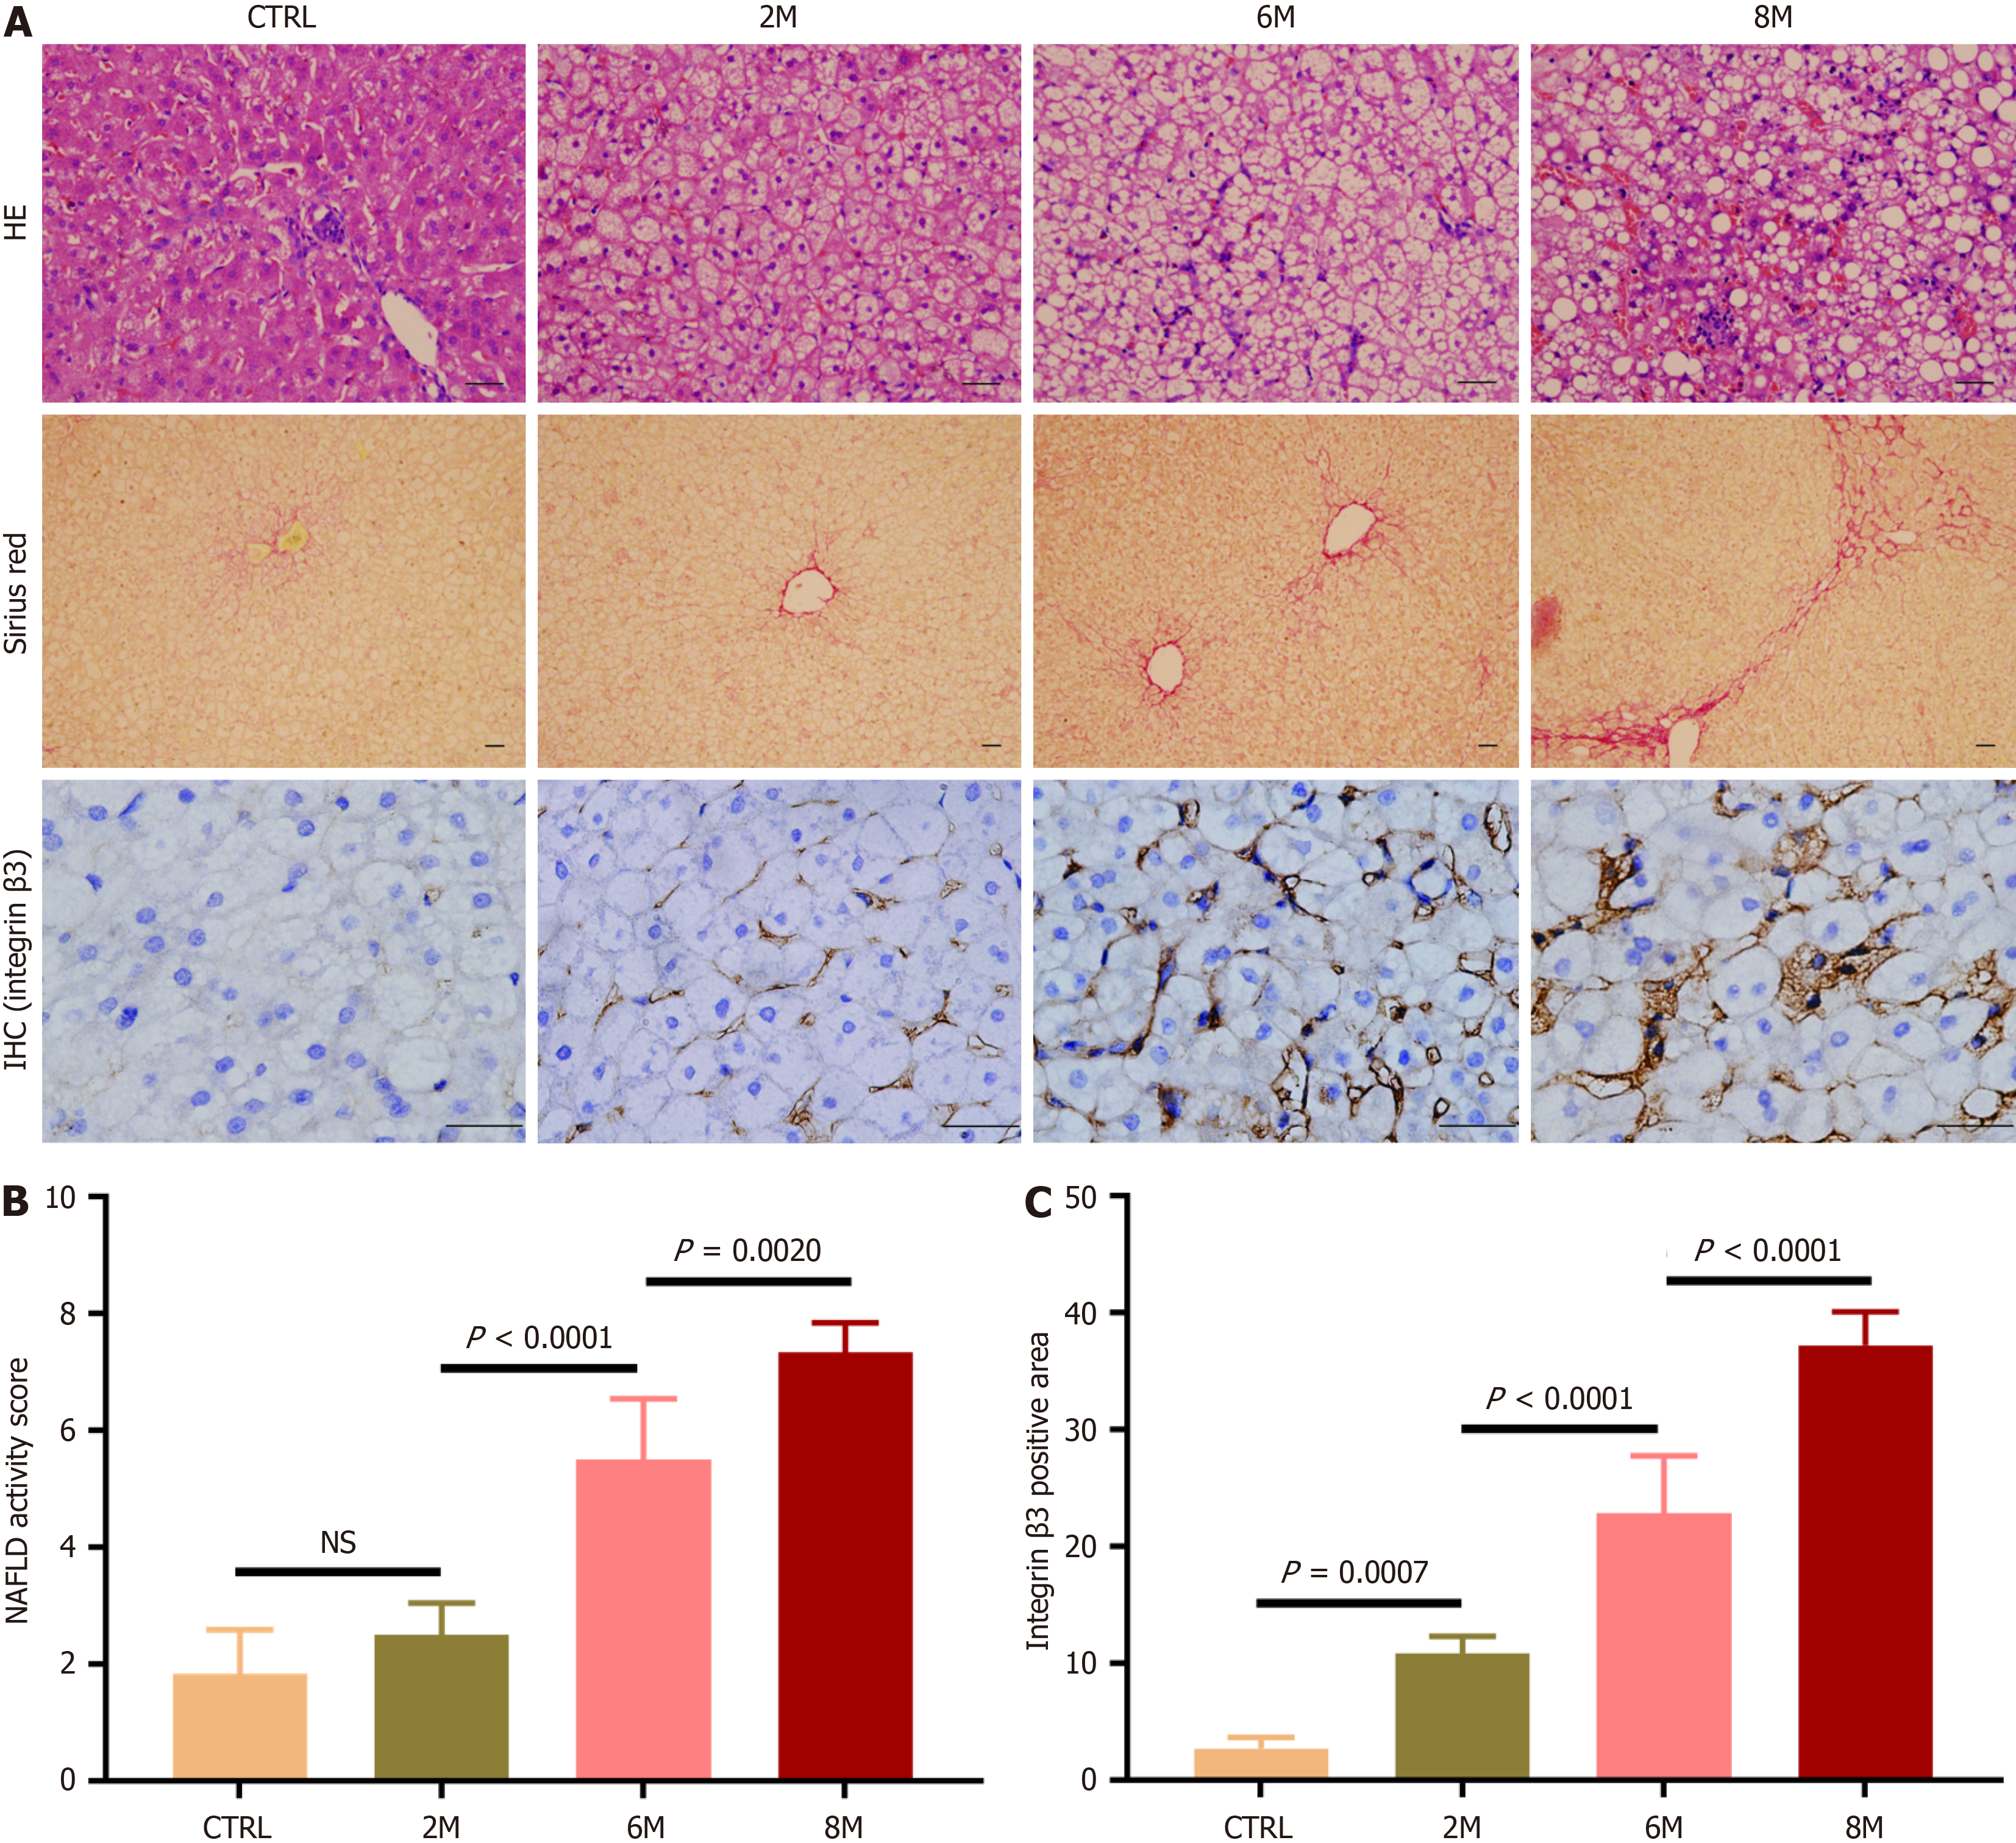
Figure 2 Expression of integrin αvβ3 in livers of rabbits with non-alcoholic fatty liver disease.
Non-alcoholic fatty liver disease was induced in rabbits by high-fat diet (HFD) for 2, 6, and 8 months (referred to as HFD-2M, 6M and 8M), and rabbits fed with regular diet for 8 months served as the control group (n = 6 per group). A: Representative micrographs of hepatic histology stained with hematoxylin-eosin staining (200 ×), Sirius red (100 ×), and immunohistochemistry for integrin β3 subunit (400 ×). In immunohistochemistry staining images, the brown areas indicated integrin β3 subunit positive staining, scale bars = 50 μm; B: Comparison of non-alcoholic fatty liver disease activity score in the control and HFD-fed rabbits; C: Comparison of the percentage of integrin β3 subunit positive-staining area in liver sections of the control and HFD-fed rabbits. For semi-quantitative analysis of hepatic integrin αvβ3 expression level, 10 fields were randomly selected and recorded from each section stained with immunohistochemistry for integrin β3 subunit. Then integrin β3 subunit positive-staining area was measured, and the percentages of the positive-staining area in liver sections were compared. In all panels, data are expressed in means ± SD. IHC: Immunohistochemistry; HE: Hematoxylin-eosin staining; CTRL: Normal control group; M: Month; NS: Not significant; NAFLD: Non-alcoholic fatty liver disease.
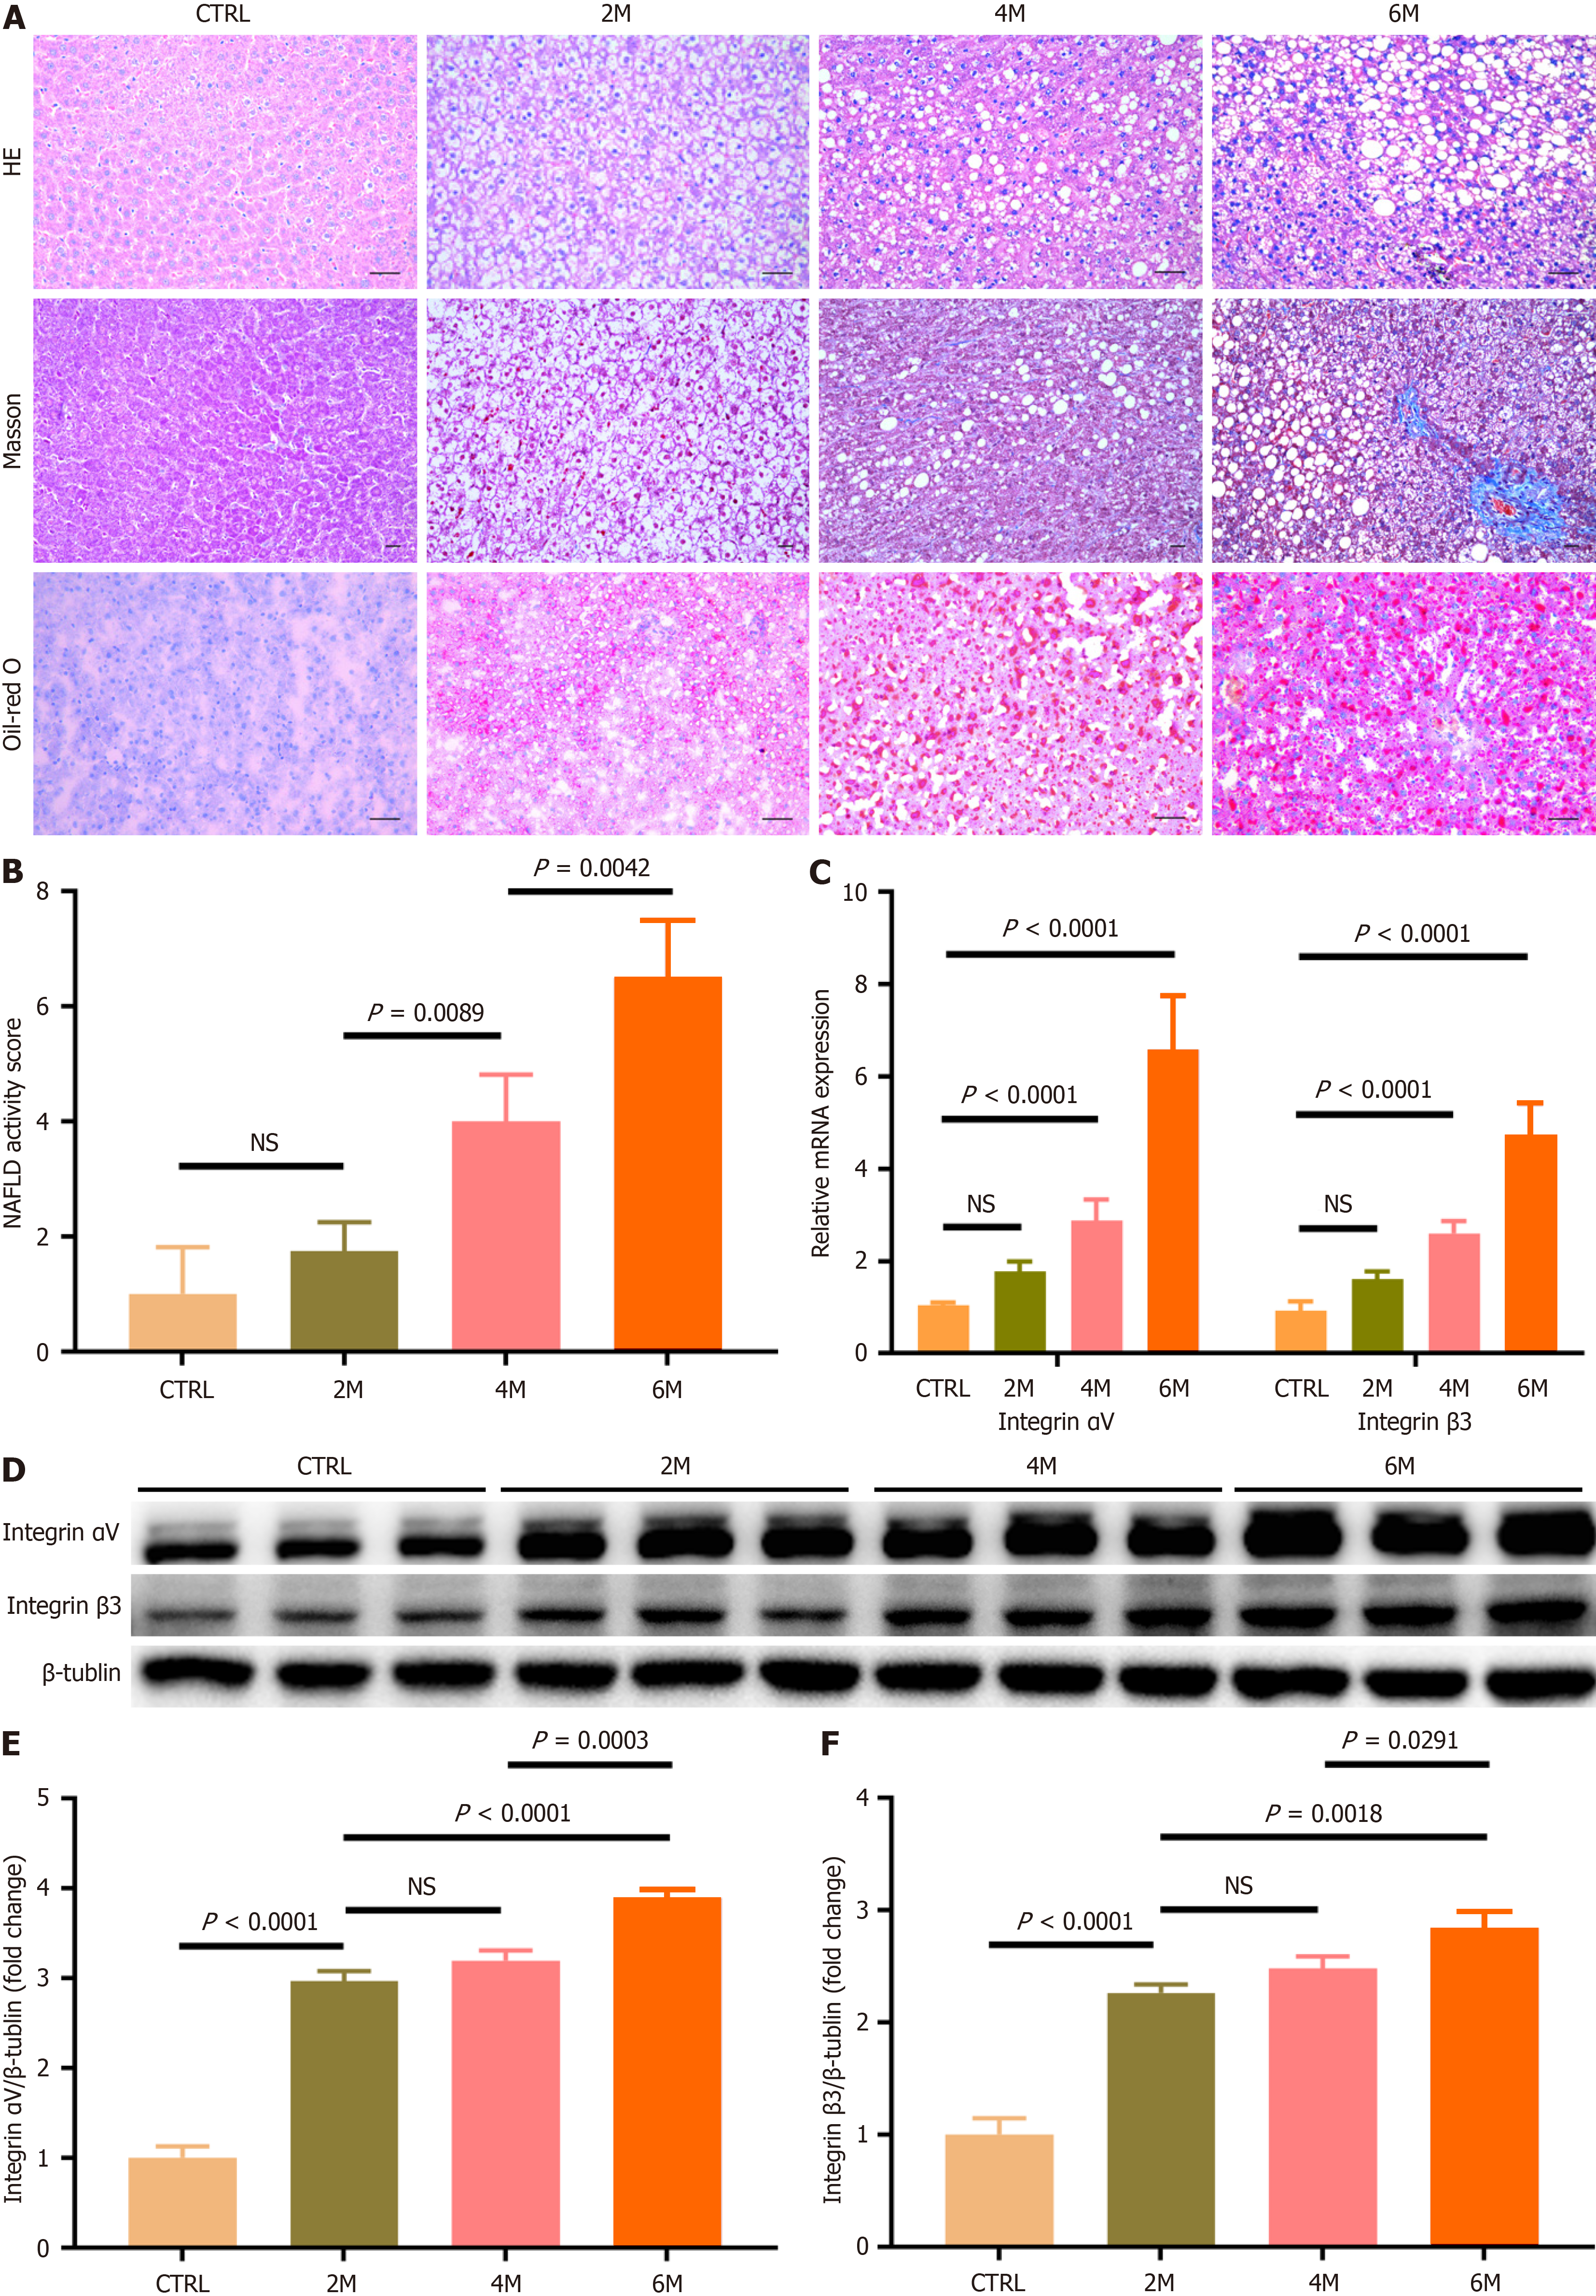
Figure 3 Expression of integrin αvβ3 in livers of rats with non-alcoholic fatty liver disease.
Non-alcoholic fatty liver disease was induced in rats by high-fat high-carbohydrate diet (HFCD) for 2, 4, and 6 months (referred to as HFCD-2M, 4M and 6M), and rats fed with regular diet for 6 months served as the control group (n= 6 per group). A: Representative micrographs of hepatic histology stained with H&E (200 ×), Masson (100 ×), and Oil-red O (200 ×), scale bars = 50 μm; B: Comparison of non-alcoholic fatty liver disease activity score in the control and HFCD-fed rats; C: Comparison of hepatic integrin αvβ3 message RNA level in the control and HFCD-fed rats. Hepatic message RNA levels of integrin αv and β3 subunits were respectively determined by quantitative real-time polymerase chain reaction analysis; D-F: Comparison of the protein amounts of integrin αvβ3 in livers of the control and HFCD-fed rats. The protein amounts of integrin αv and β3 subunits were analyzed by western-blot assay, and β-Tublin was used as the reference. In all panels, data are expressed in means ± SD. HE: Hematoxylin-eosin staining; CTRL: Normal control group; M: Month; NS: Not significant; NAFLD: Non-alcoholic fatty liver disease.
Figure 4 Immunofluorescent co-localization of integrin αvβ3 and the markers of various hepatic cells including α-smooth muscle actin, cluster of differentiation 31, cluster of differentiation 68 or cluster of differentiation 163 in livers of the control and high-fat high-carbohydrate diet-fed rats.
Representative fluorescent images of integrin β3 subunit (green color) and albumin, α-smooth muscle actin, cluster of differentiation (CD) 31, CD68 and CD163 (red color) in liver sections, which were separately stained with specific first antibodies and visualized by second antibodies, and counterstained with 6-diamidino-2-phenylindole for nuclei staining. The merged images show the yellow color area by overlaying images of the counterstaining, and amplified images corresponding to the indicated areas in boxes are present. Images were recorded at original magnification (400 ×), scale bars = 100 μm. A: Control; B: High-fat high-carbohydrate diet (HFCD)-2M; C: HFCD-4M; D: HFCD-6M rats; E: Comparison of the percentage of integrin β3 subunit positive-staining area in liver sections of the control and HFCD-fed rats. Ten fields were randomly selected and recorded from each section. Then integrin β3 positive-staining area was measured, and the percentages of the positive-staining area in liver sections were compared; F: Comparison of the ratio of the overlapped yellow area to integrin β3 subunit positive-staining green area in liver sections of HFCD-6M rats. Ten fields were randomly selected and recorded from each section. Then integrin β3 subunit positive-staining area and the area of integrin β3 subunit positive-staining overlapped with hepatic cellular markers positive-staining were respectively measured, and the ratios were compared. In all panels, data are expressed in means ± SD. DAPI: 6-diamidino-2-phenylindole; CTRL: Normal control group; M: Month; CD: Cluster of differentiation; αSMA: α-smooth muscle actin.
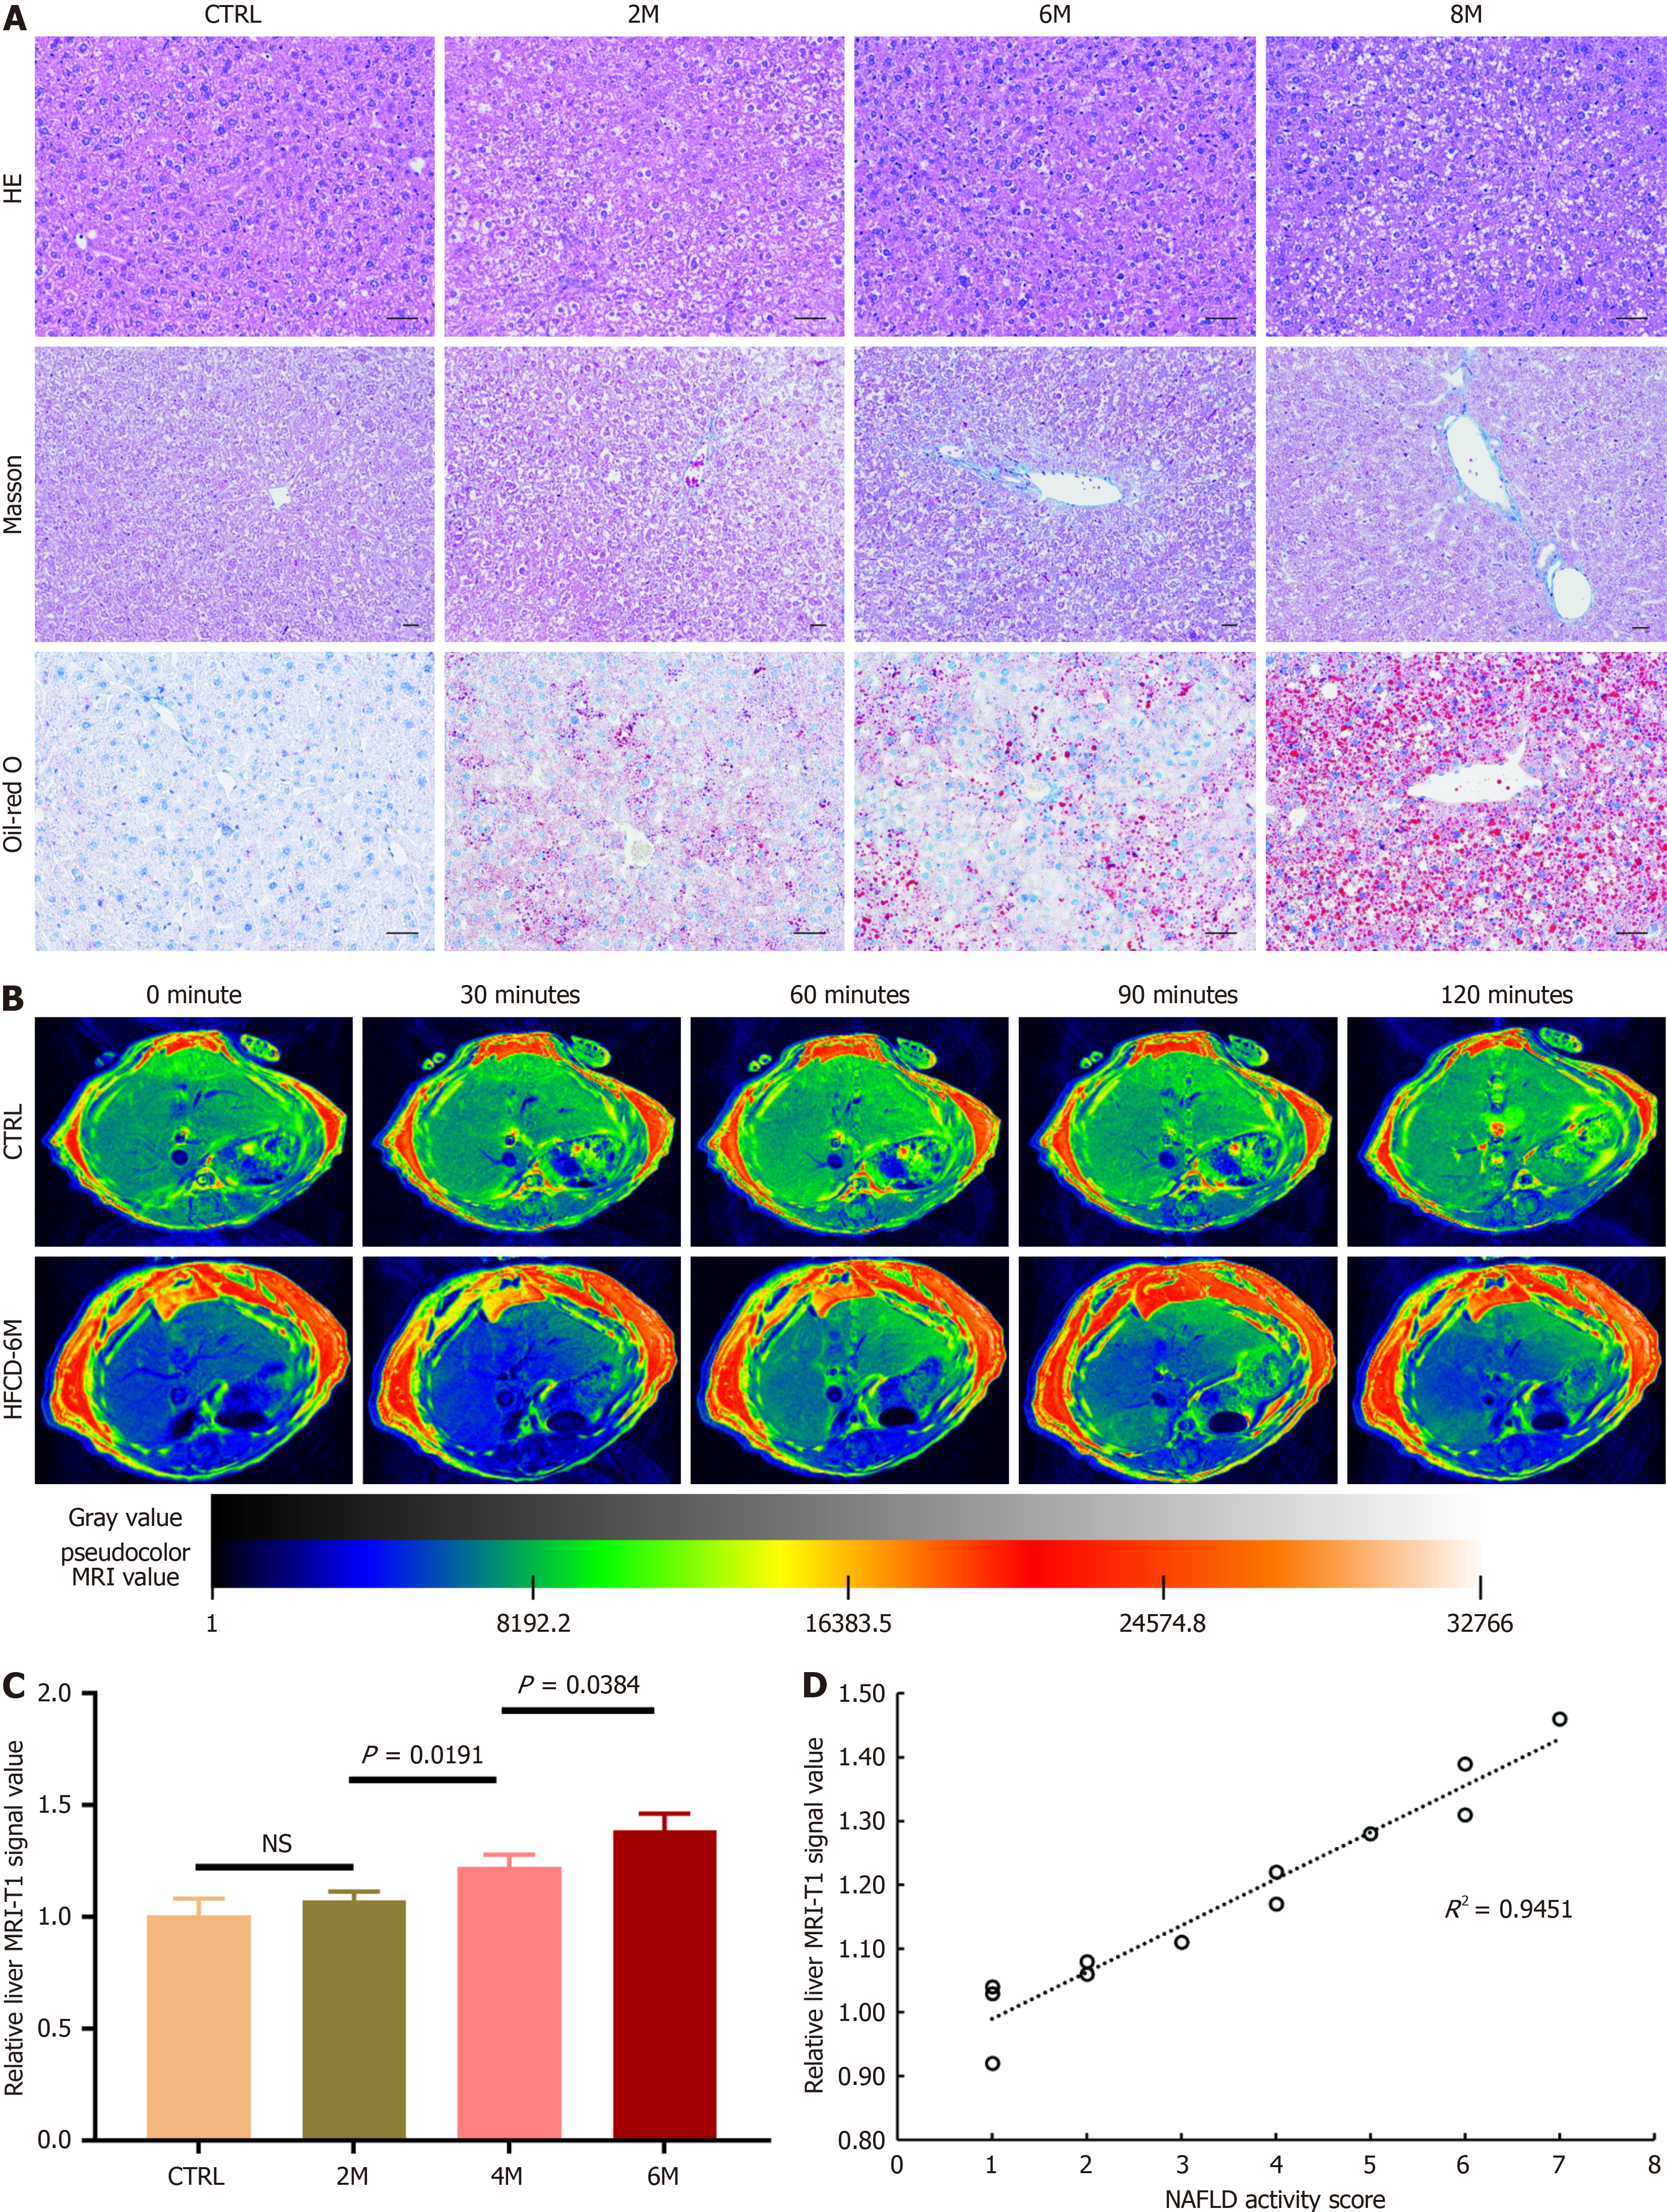
Figure 5 Imaging non-alcoholic fatty liver disease using a magnetic resonance imaging modality with cyclic arginine-glycine-aspartic acid peptides labeled with gadolinium through 1,4,7,10-tetraazacyclododecane-1,4,7,10-tetraacetic acid as a tracer in mice.
Non-alcoholic fatty liver disease was induced in mice by high-fat high-carbohydrate diet (HFCD) for 2, 4, and 6 months (referred to as HFCD-2M, 4M and 6M), and mice fed with regular diet for 6 months served as the control group (n= 3 per group). A: Representative micrographs of hepatic histology stained with hematoxylin-eosin staining (200 ×), Masson (100 ×), and Oil-red O (200 ×), scale bars = 50 μm; B: Representative hepatic T1-weighed magnetic resonance imaging (MRI) of the control and HFCD-6M mice prior to and at 30, 60, 90 and 120 minutes after cyclic arginine-glycine-aspartic acid (cRGD)-1,4,7,10-tetraazacyclododecane-1,4,7,10-tetraacetic acid (DOTA)-gadolinium (Gd) injection; C: Comparison of the relative liver MRI-T1 signal value in the control and HFCD-fed mice 60 minutes after cRGD-DOTA-Gd injection. Data are expressed in means ± SD; D: Correlation of the relative liver MRI-T1 signal value at 60 minutes post-injection of cRGD-DOTA-Gd with non-alcoholic fatty liver disease activity score was assessed. HE: Hematoxylin-eosin staining; CTRL: Normal control group; M: Month; NS: Not significant; NAFLD: Non-alcoholic fatty liver disease; HFCD: High-fat high-carbohydrate diet; MRI: Magnetic resonance imaging.
- Citation: Huang XQ, Wu L, Xue CY, Rao CY, Fang QQ, Chen Y, Xie C, Rao SX, Chen SY, Li F. Non-invasively differentiate non-alcoholic steatohepatitis by visualizing hepatic integrin αvβ3 expression with a targeted molecular imaging modality. World J Hepatol 2024; 16(11): 1290-1305
- URL: https://www.wjgnet.com/1948-5182/full/v16/i11/1290.htm
- DOI: https://dx.doi.org/10.4254/wjh.v16.i11.1290


