Copyright
©The Author(s) 2024.
World J Hepatol. Jan 27, 2024; 16(1): 41-53
Published online Jan 27, 2024. doi: 10.4254/wjh.v16.i1.41
Published online Jan 27, 2024. doi: 10.4254/wjh.v16.i1.41
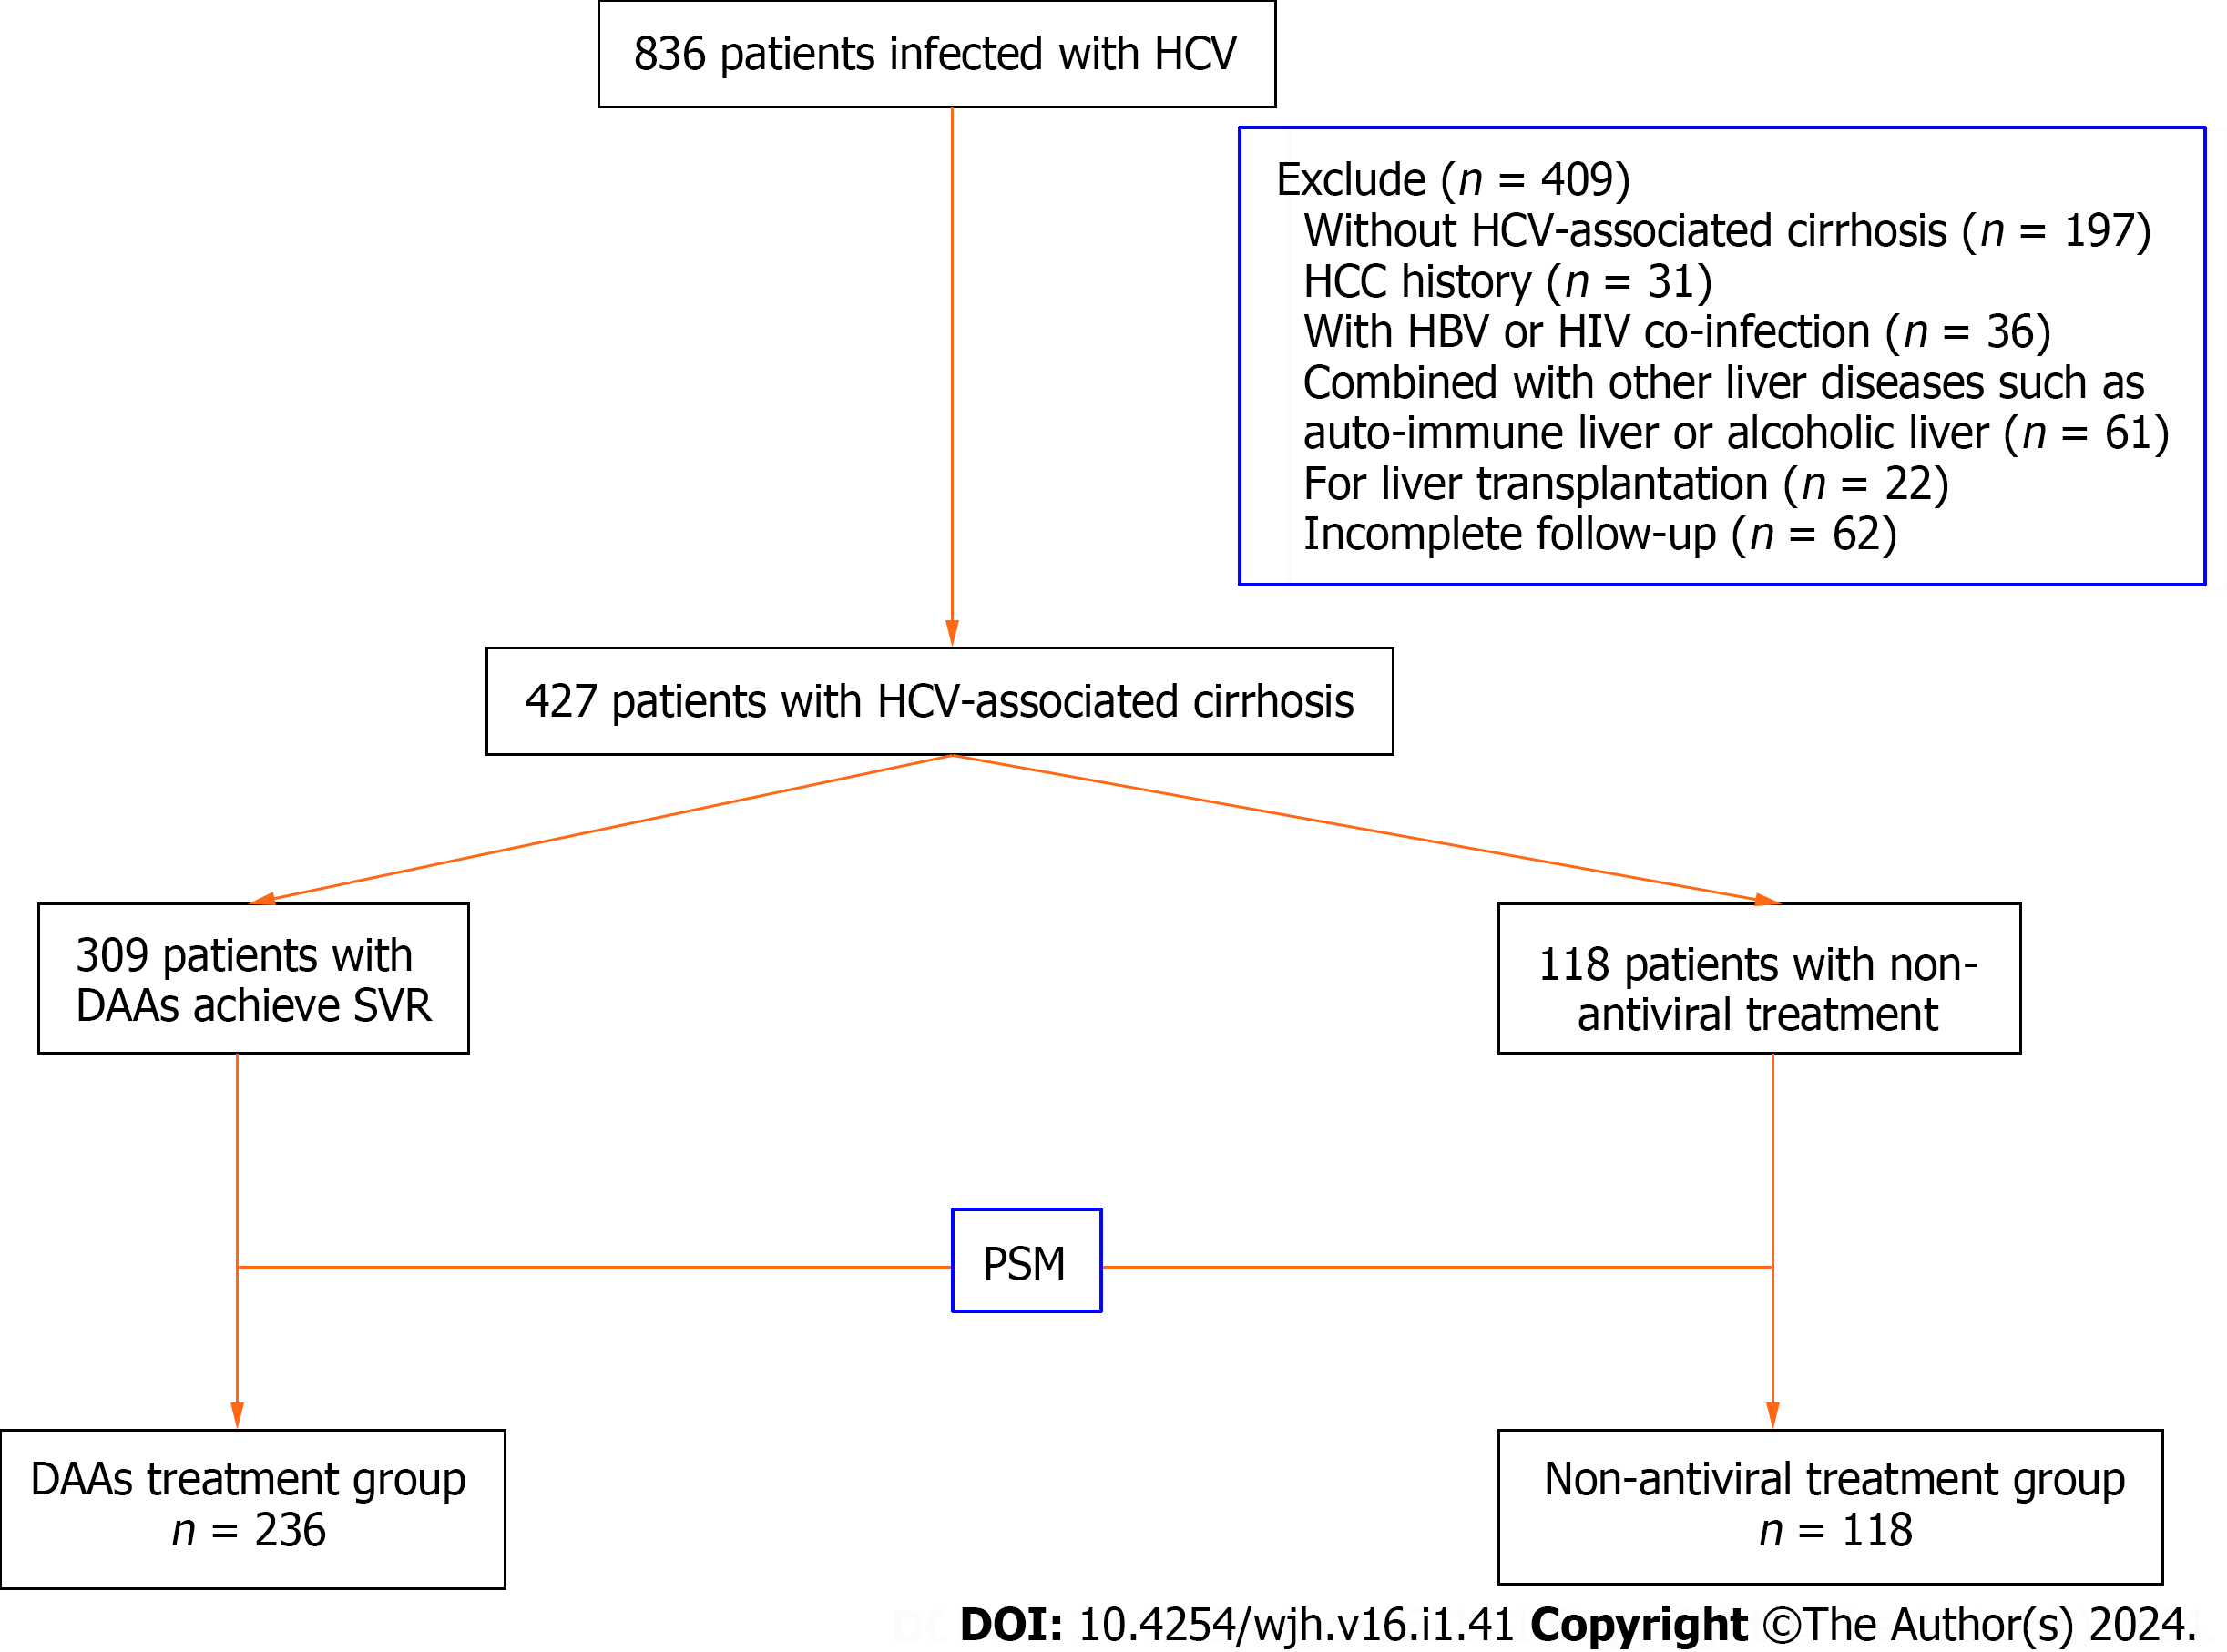
Figure 1 Flow chart of patients included in this study.
HCV: Hepatitis C virus; HCC: hepatocellular carcinoma; DAA: Direct-Acting Antiviral Agents; SVR: sustained virologic response; PSM: propensity score matching.
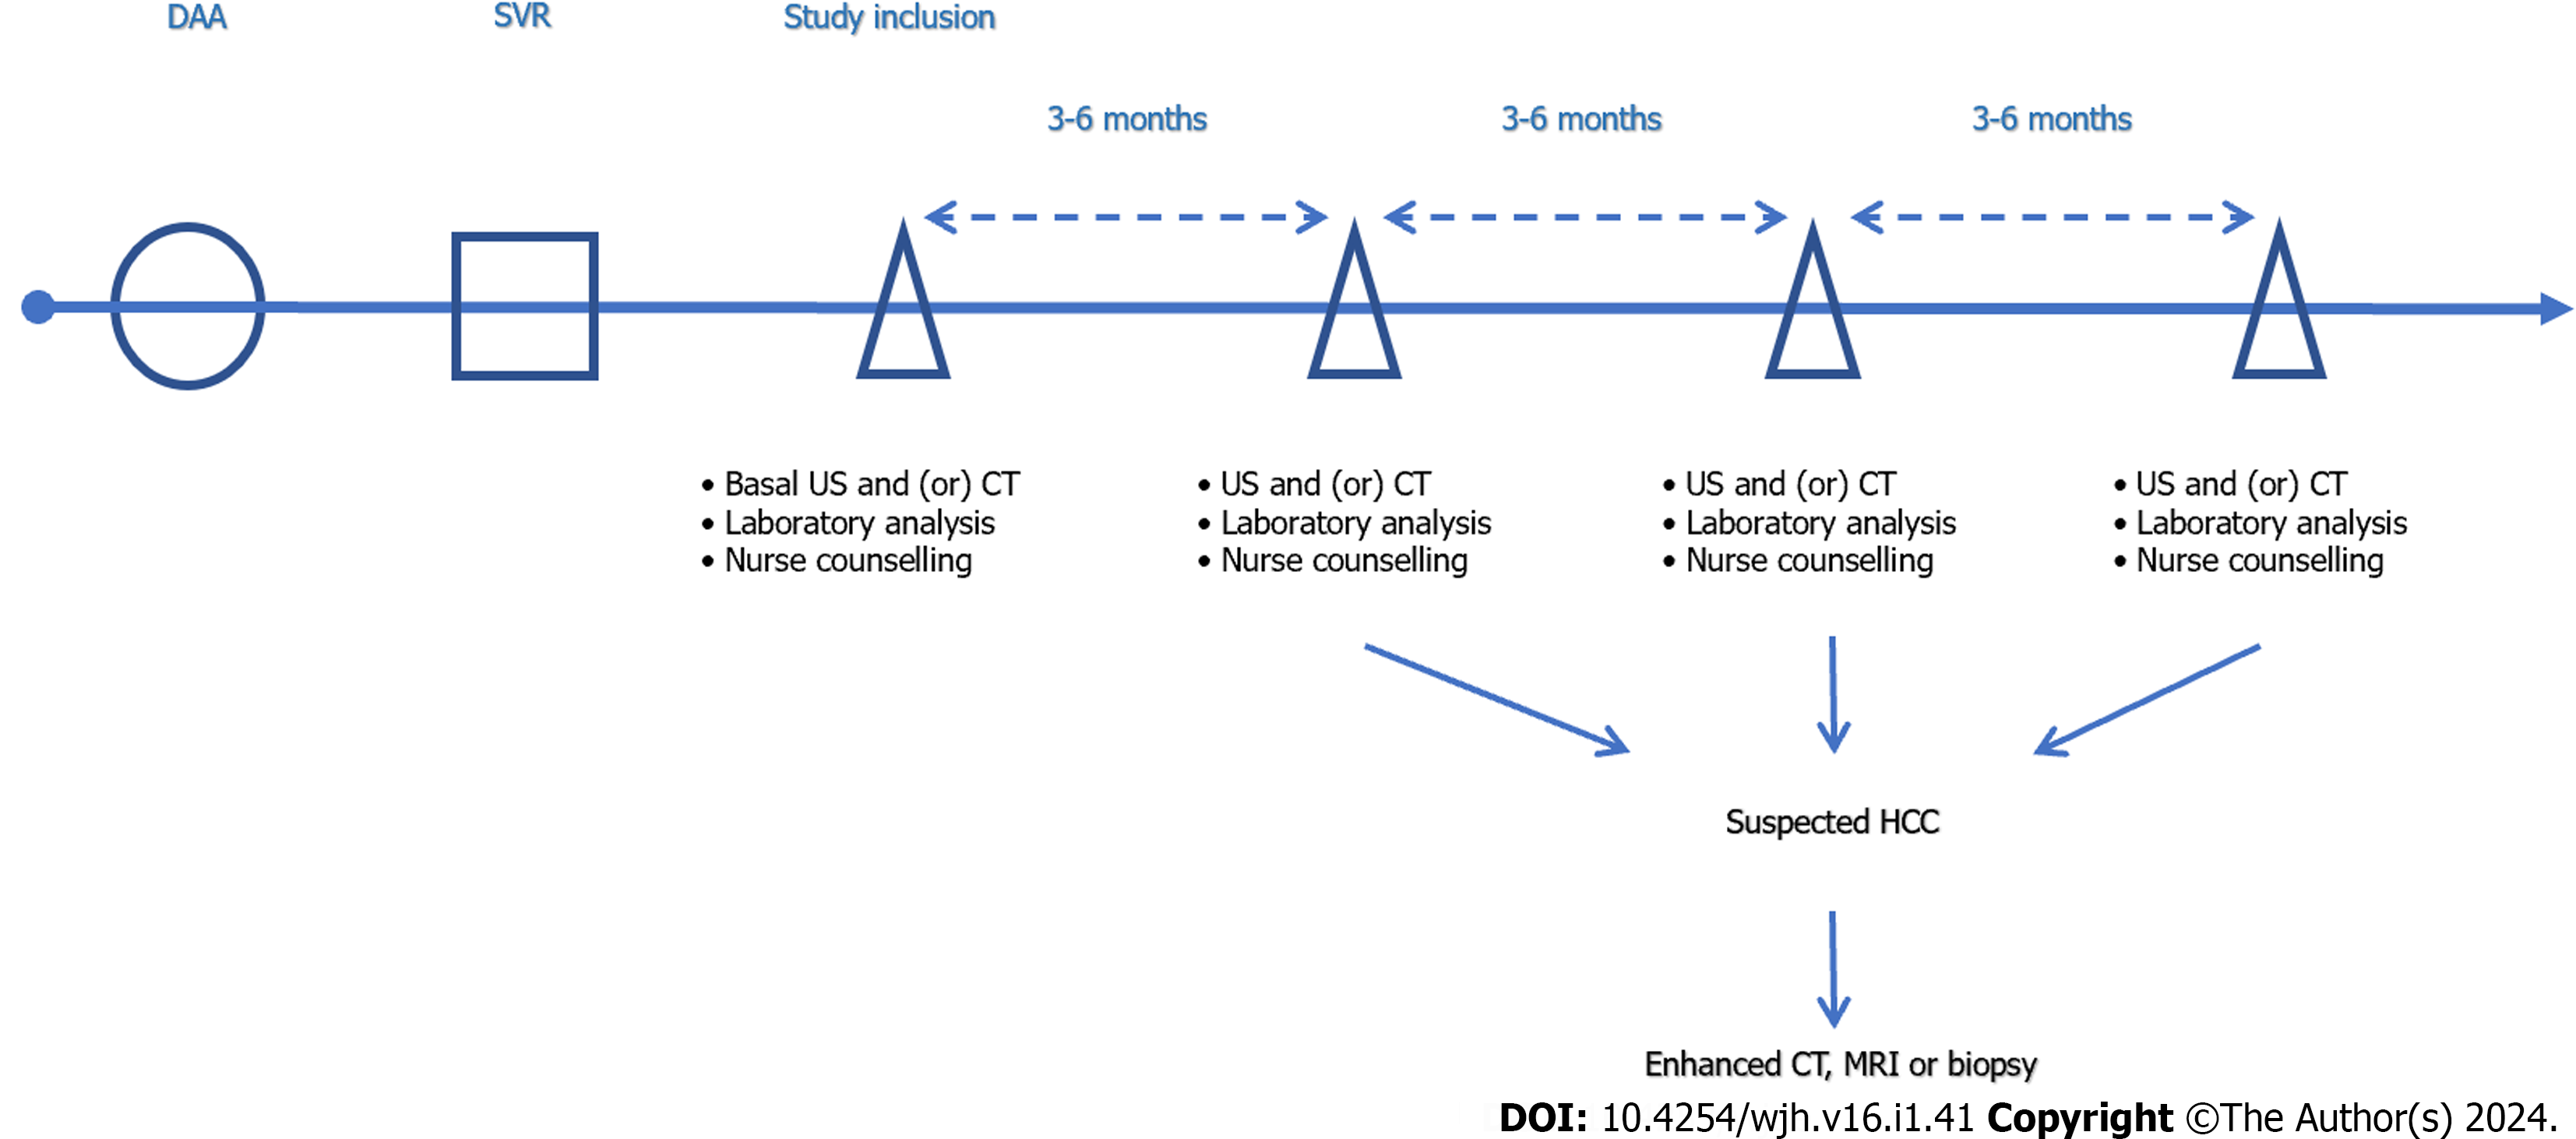
Figure 2 Study time points and follow-up of this study.
DAA: Direct-Acting Antiviral Agents; SVR: sustained virological response; US: Ultrasound; CT: Computed tomography; HCC: Hepatocellular carcinoma; MRI: Magnetic resonance imaging.
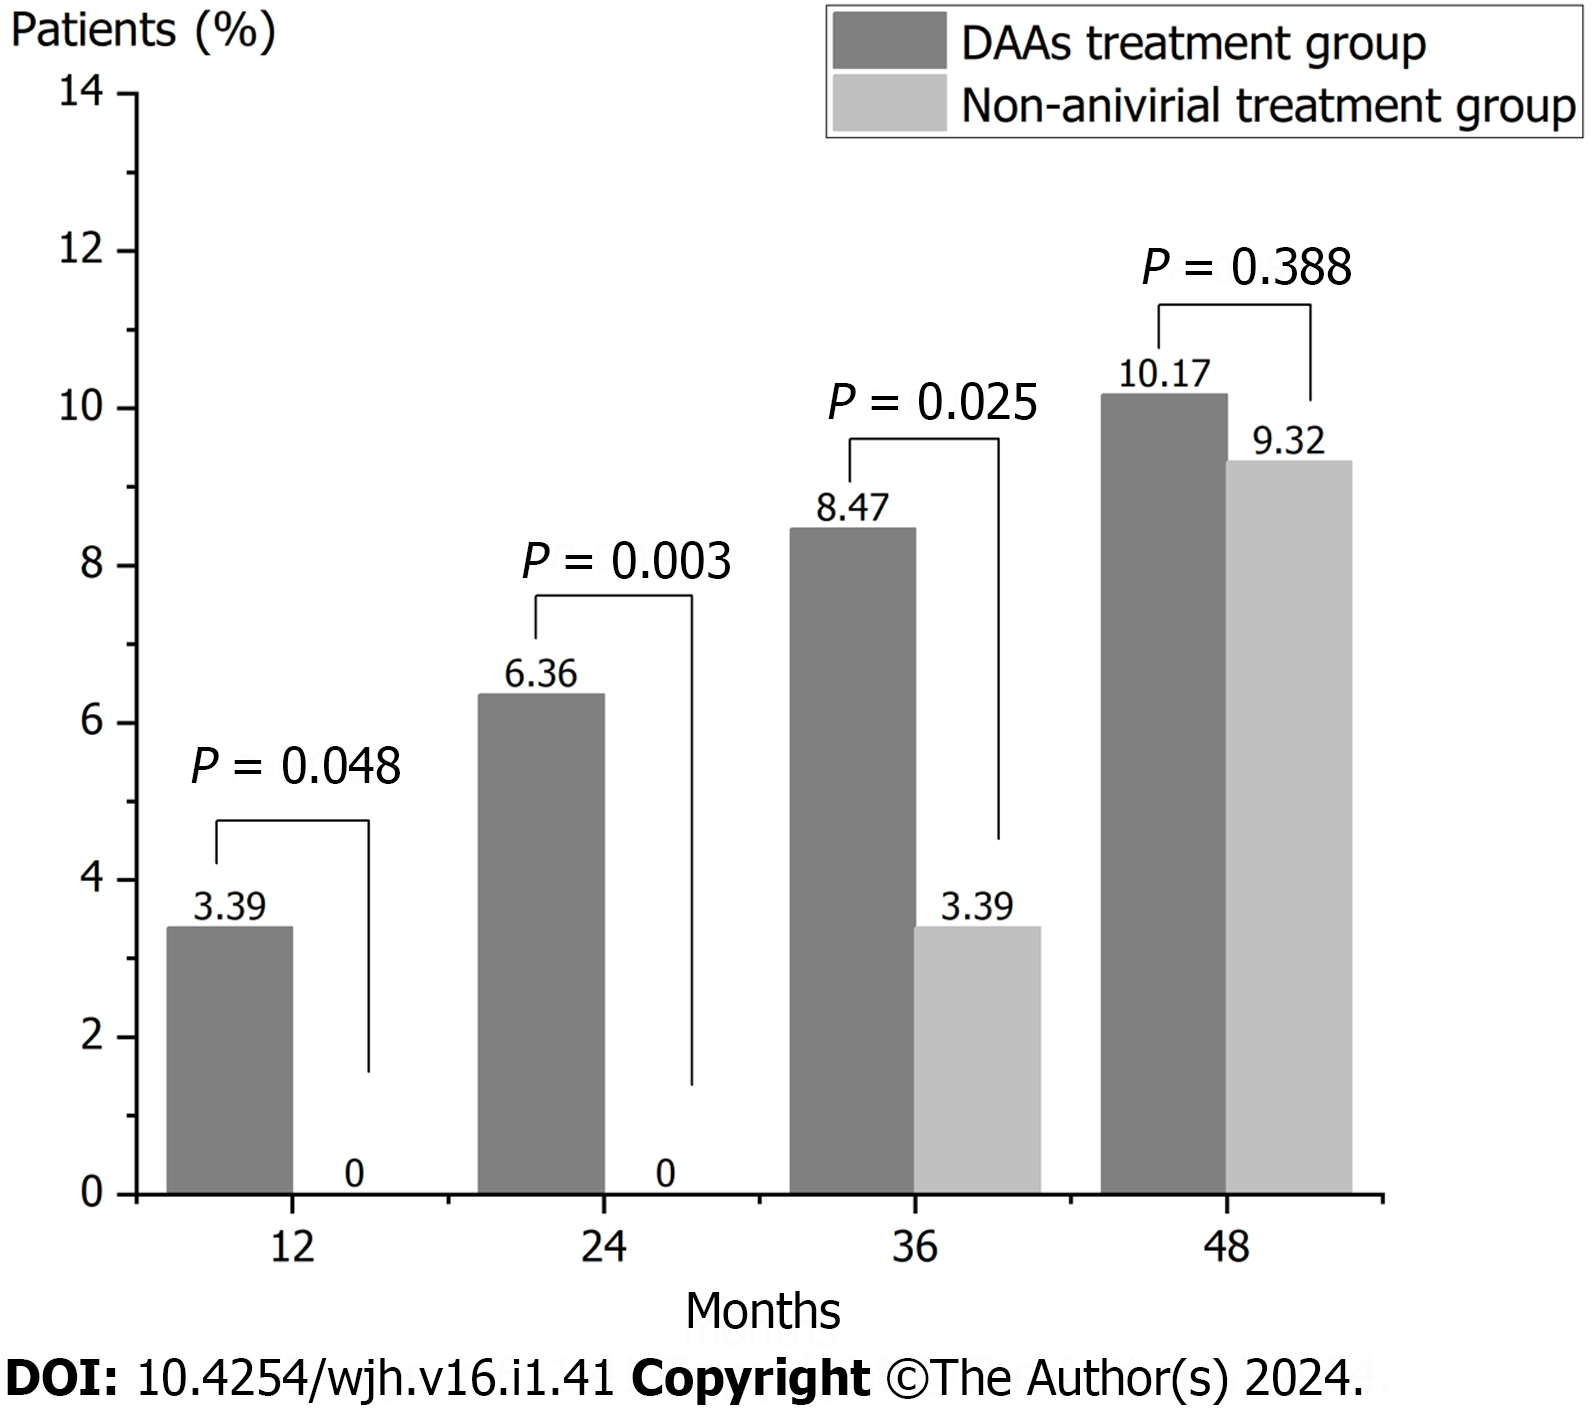
Figure 3 The incidence of hepatocellular carcinoma at 12 mo, 24 mo, 36 mo, and 48 mo between the direct-acting antiviral agents treatment group and the non-antiviral treatment group.
DAA: Direct-acting antiviral agents.
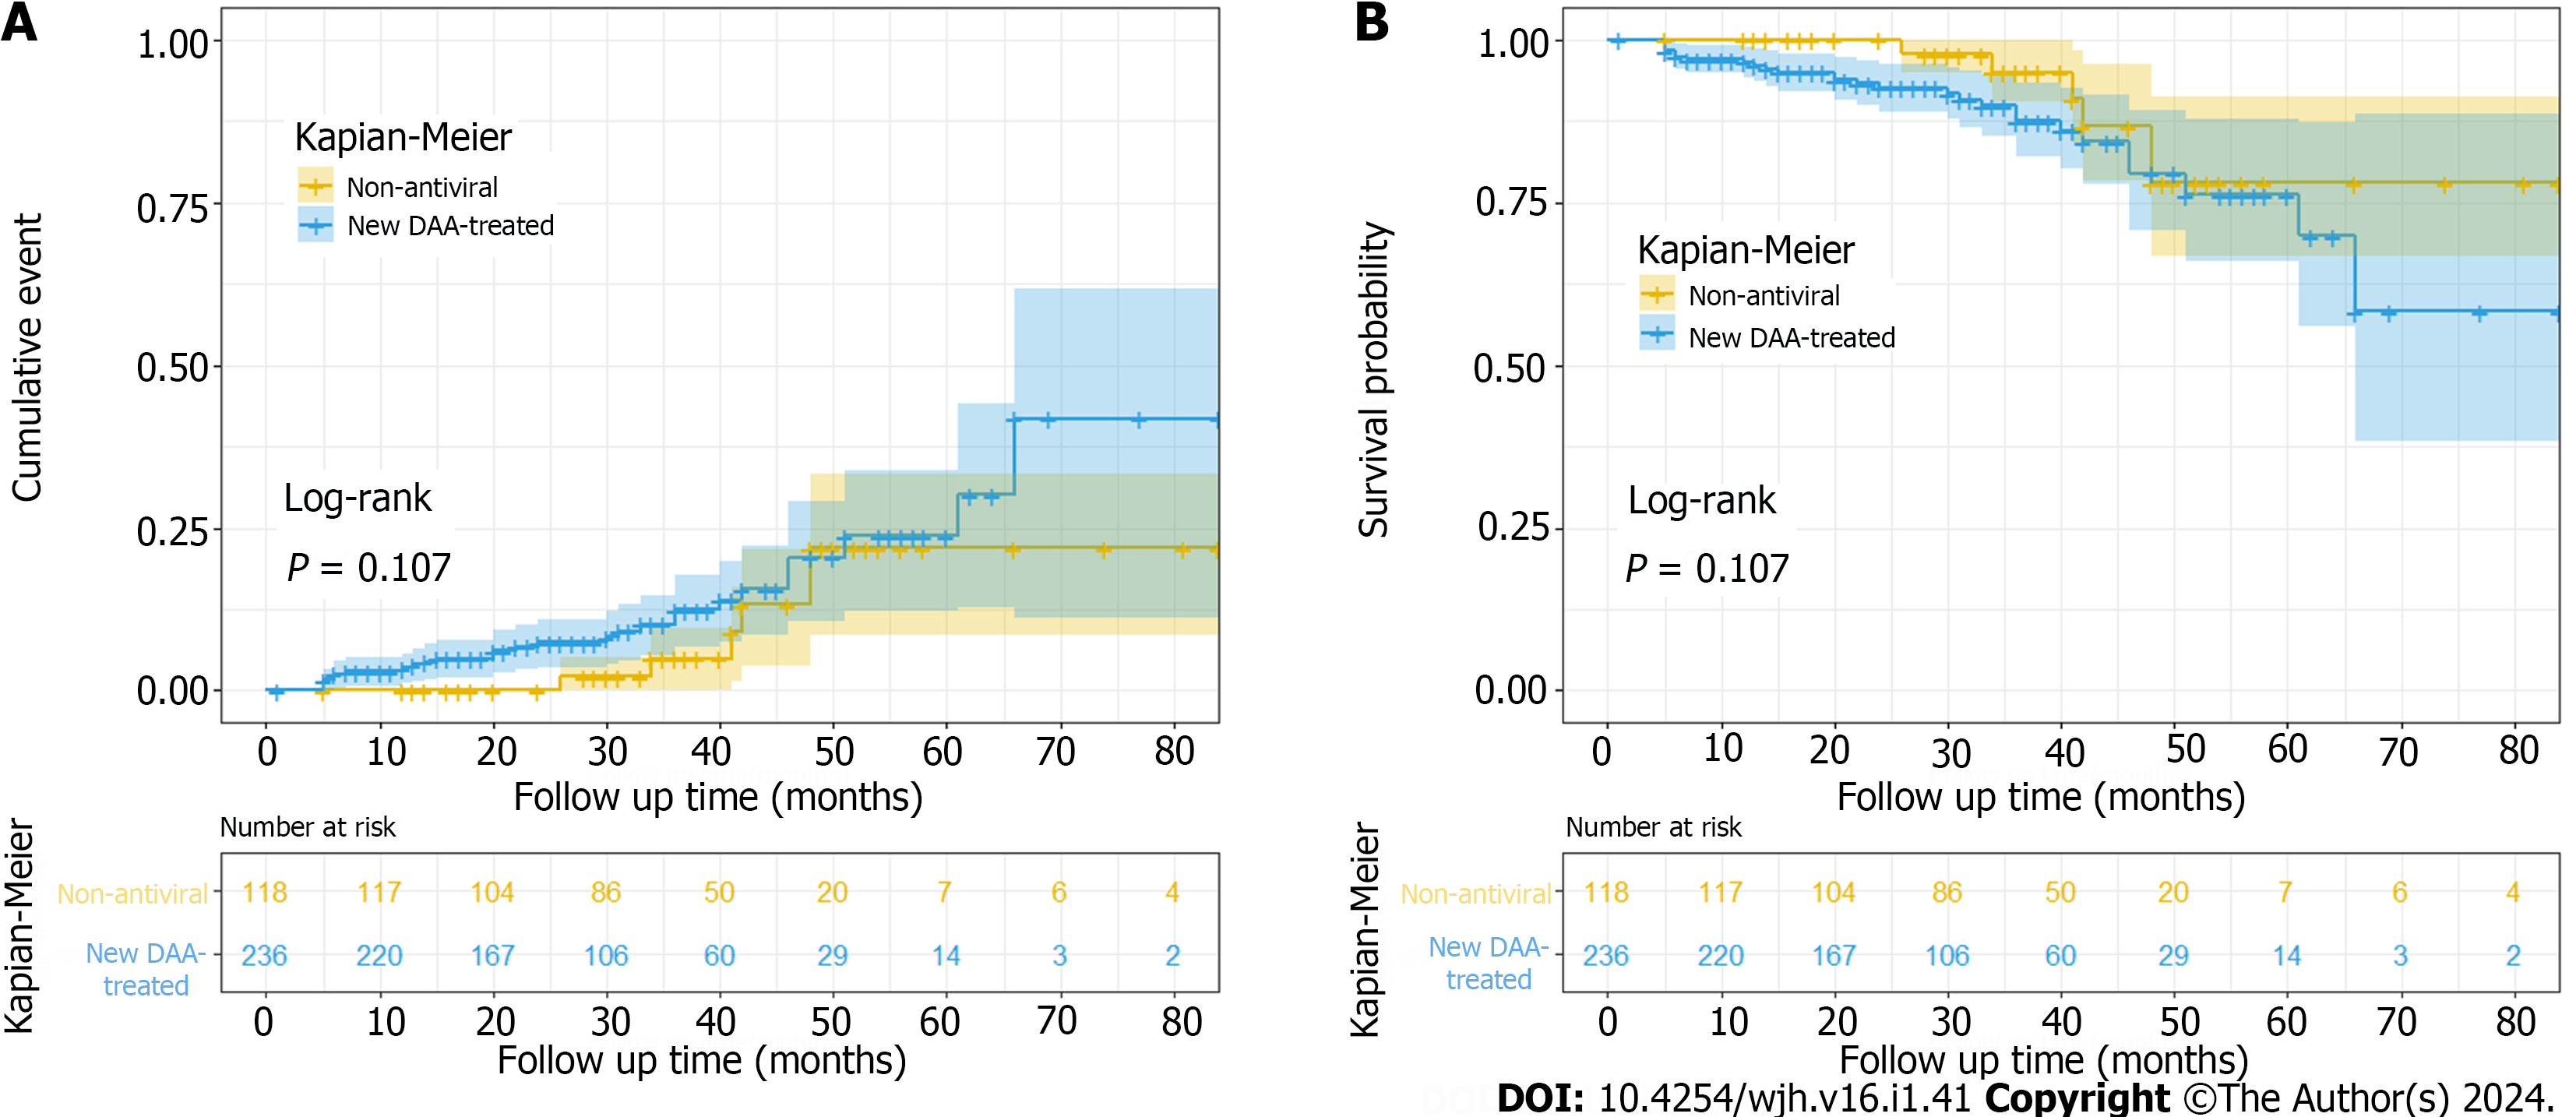
Figure 4 Cumulative incidence and Survival probability of hepatocellular carcinoma between the direct-acting antiviral agents treatment group and the non-antiviral treatment group.
A: Cumulative incidence of hepatocellular carcinoma (HCC) between direct-acting antiviral agents (DAAs) treatment group and non-antivial treatment group; B: Survival probability of HCC between new DAAs treatment group and non-antivial treatment group.
- Citation: Tao XM, Zeng MH, Zhao YF, Han JX, Mi YQ, Xu L. Direct-acting antivirals failed to reduce the incidence of hepatocellular carcinoma occurrence in hepatitis C virus associated cirrhosis: A real-world study. World J Hepatol 2024; 16(1): 41-53
- URL: https://www.wjgnet.com/1948-5182/full/v16/i1/41.htm
- DOI: https://dx.doi.org/10.4254/wjh.v16.i1.41


