Copyright
©The Author(s) 2023.
World J Hepatol. Dec 27, 2023; 15(12): 1338-1343
Published online Dec 27, 2023. doi: 10.4254/wjh.v15.i12.1338
Published online Dec 27, 2023. doi: 10.4254/wjh.v15.i12.1338
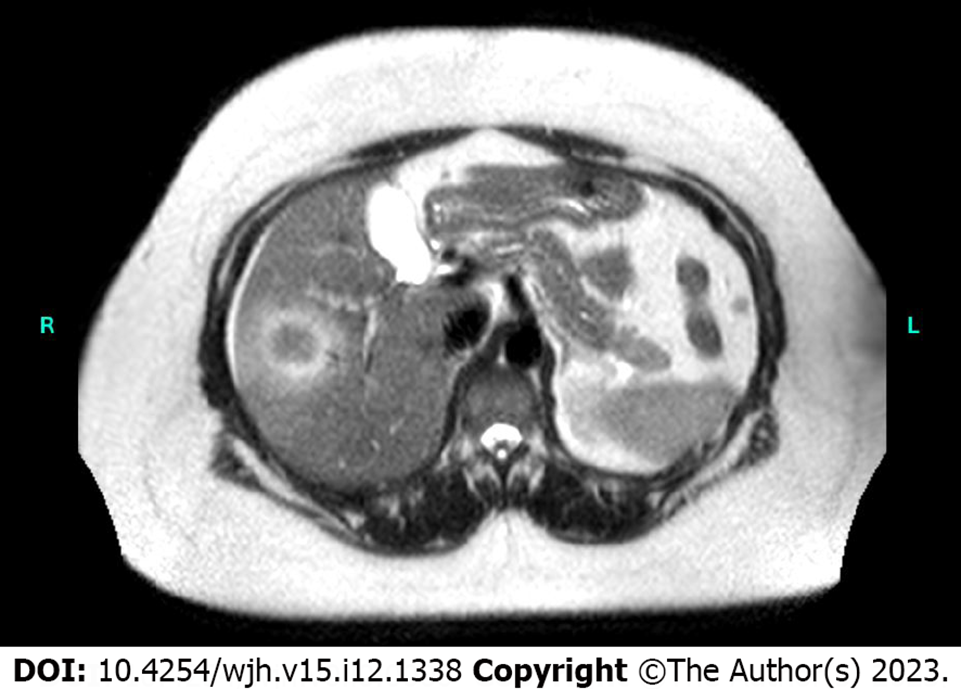
Figure 1 Representative magnetic resonance imaging of hepatic pseudotumor.
Gadolium-enhanced magnetic resonance imaging demonstrated a peripherally T2 hyperintense and centrally T2 hypointense lesion.
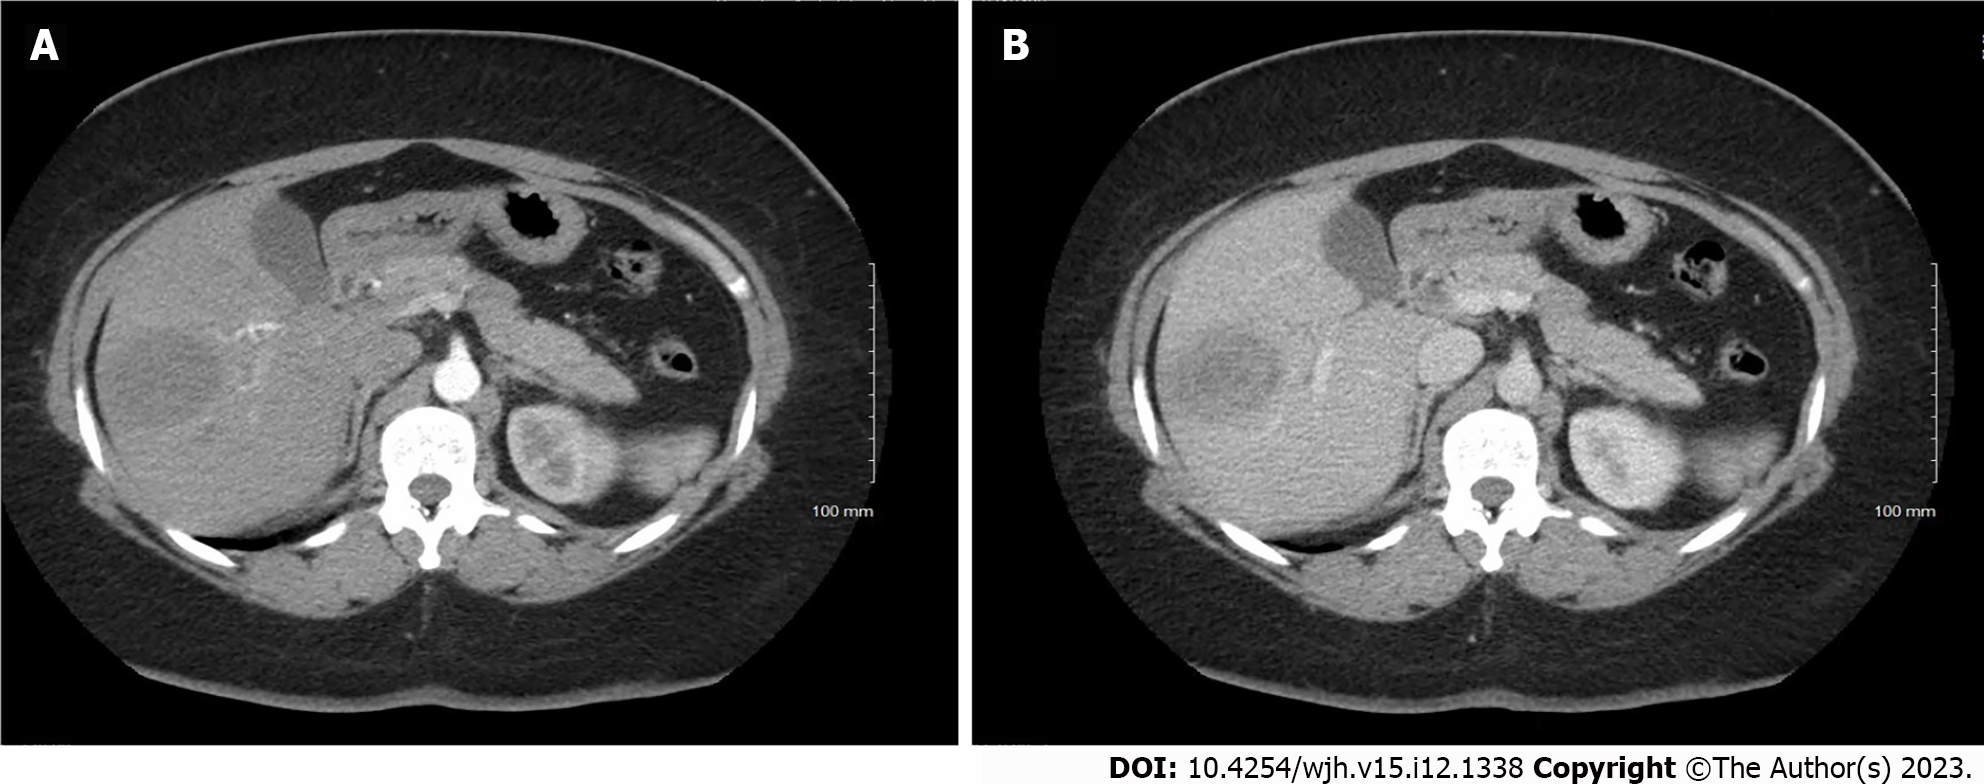
Figure 2 Representative computerized tomography imaging of hepatic pseudotumor.
A-B: Computerized tomography scan through the abdomen with arterial (A) and venous (B) phases demonstrated a low-density mass within the right hepatic lobe measuring up to 4.5 cm × 4.9 cm in largest dimensions. There was peripheral enhancement with centripetal filling; however, the enhancement was contiguous without significant nodularity and thus atypical for a hemangioma.
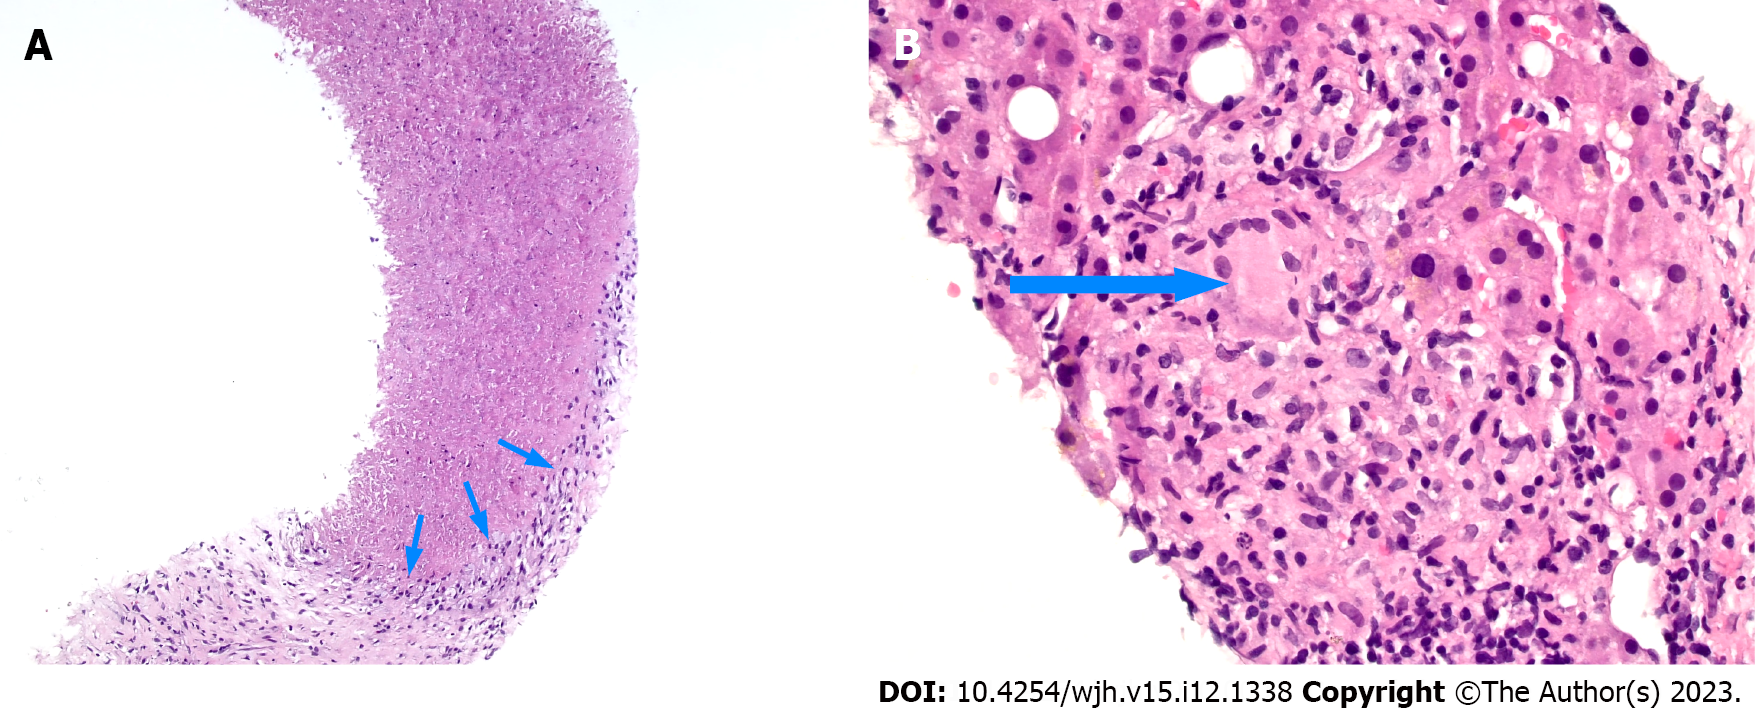
Figure 3 Histologic examination of the liver lesion.
A: The biopsy shows loose fibrous tissue (bottom) with large areas of necrosis rimmed by histiocytes (arrows), hematoxylin and eosin stain (100 ×); B: The adjacent viable hepatic parenchyma contains few non-necrotic granulomas. The arrow denotes a multinucleated giant cell within the granuloma, hematoxylin and eosin stain (400 ×).
- Citation: Gialanella JP, Steidl T, Korpela K, Grandhi MS, Langan RC, Alexander HR, Hudacko RM, Ecker BL. Hepatic pseudotumor associated with Strongyloides infection: A case report. World J Hepatol 2023; 15(12): 1338-1343
- URL: https://www.wjgnet.com/1948-5182/full/v15/i12/1338.htm
- DOI: https://dx.doi.org/10.4254/wjh.v15.i12.1338


